OPEN-SOURCE SCRIPT
Volatility/Volume Impact
We often hear statements such as follow the big volume to project possible price movements. Or low volatility is good for trend. How much of it is statistically right for different markets. I wrote this small script to study the impact of Volatility and Volume on price movements.
Concept is as below:
Similar calculation also applied for volatility.
With this, you can observe how price change is correlated to high/low volume and volatility.
Let us see some examples on different markets.
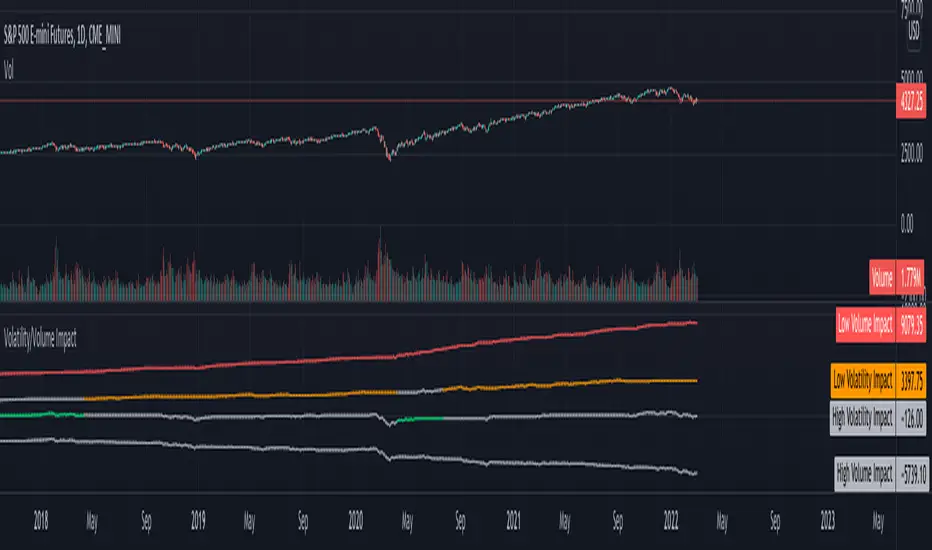
Example 1: SPY
SPY
From the chart snapshot below, it looks evident that SPY always thrive when there is low volatility and LOW VOLUME!!
https://www.tradingview.com/x/9sq1sUoN/
Example 2: TSLA
TSLA
The picture will be different if you look at individual stocks. For Tesla, the price movement is more correlated to high volume (unlike SPY where low volume days define the trend)
https://www.tradingview.com/x/729SP8PW/
Example 3:
 BTCUSDT
Unlike stocks and indices, high volatility defined the trend for BTC for long time. It thrived when volatility is more. We can see that high volume is still major influencer in BTC price movements.
https://www.tradingview.com/x/5GoJrgyM/
Settings are very simple and self explanatory.
https://www.tradingview.com/x/axehSIFT/
Hint: You can also move the indicator to chart overlay for better visualisation of comparison with close price.
https://www.tradingview.com/x/IurS9noh/
Concept is as below:
- Compare volume with a reference median value. You can also use moving average or other types for this comparison.
- If volume is higher than median, increment positive value impact with change in close price. If volume is less than median, then increment negative value impact with change in close price.
- With this we derive pvd and nvd which are measure of price change when volume is higher and lower respectively. pvd measures the price change when volume is higher than median whereas nvd measures price change when volume is lower than median.
- Calculate correlation of pvd and nvd with close price to see what is impacting the price by higher extent.
- Colors are applied to plots which have higher correlation to price movement. For example, if pvd has higher correlation to price movement, then pvd is coloured green whereas nvd is coloured silver. Similarly if nvd has higher correlation to price then nvd is coloured in red whereas pvd is coloured in silver.
Similar calculation also applied for volatility.
With this, you can observe how price change is correlated to high/low volume and volatility.
Let us see some examples on different markets.
Example 1:
From the chart snapshot below, it looks evident that SPY always thrive when there is low volatility and LOW VOLUME!!
https://www.tradingview.com/x/9sq1sUoN/
Example 2:
The picture will be different if you look at individual stocks. For Tesla, the price movement is more correlated to high volume (unlike SPY where low volume days define the trend)
https://www.tradingview.com/x/729SP8PW/
Example 3:
Unlike stocks and indices, high volatility defined the trend for BTC for long time. It thrived when volatility is more. We can see that high volume is still major influencer in BTC price movements.
https://www.tradingview.com/x/5GoJrgyM/
Settings are very simple and self explanatory.
https://www.tradingview.com/x/axehSIFT/
Hint: You can also move the indicator to chart overlay for better visualisation of comparison with close price.
https://www.tradingview.com/x/IurS9noh/
Script open-source
Nello spirito di TradingView, l'autore di questo script lo ha reso open source, in modo che i trader possano esaminarne e verificarne la funzionalità. Complimenti all'autore! Sebbene sia possibile utilizzarlo gratuitamente, ricordiamo che la ripubblicazione del codice è soggetta al nostro Regolamento.
Trial - trendoscope.io/trial
Subscribe - trendoscope.io/pricing
Blog - docs.trendoscope.io
Subscribe - trendoscope.io/pricing
Blog - docs.trendoscope.io
Declinazione di responsabilità
Le informazioni e le pubblicazioni non sono intese come, e non costituiscono, consulenza o raccomandazioni finanziarie, di investimento, di trading o di altro tipo fornite o approvate da TradingView. Per ulteriori informazioni, consultare i Termini di utilizzo.