OPEN-SOURCE SCRIPT
Aggiornato [blackcat] L2 Banker Fund Trajectory for Indice
Level: 2
Background
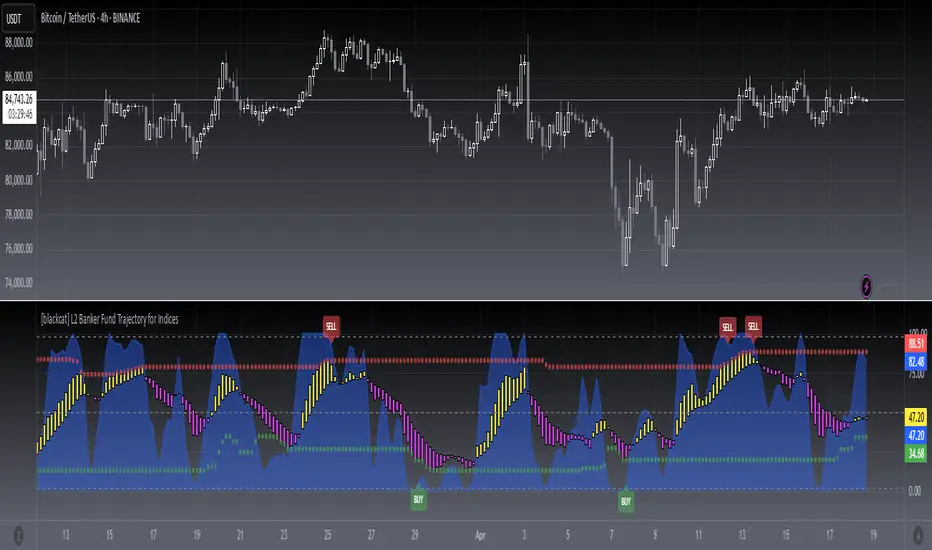
This script creates a model of banker fund (whale) with yellow and fuchsia candles. I use blue waves (b5) to detect oversold and overbought, which is more sensistive than candles.
Function
Use composite banker fund trajectory oversold and overbought for long and short entries, which works better for indice trading pairs
Key Signal
j --> banker fund fast line
a2 --> banker funder slow line
support --> dynamic support levels
resistance --> dynamic resistance levels
long --> oversold long entry
short --> overbought short entry
Pros and Cons
This script is suitable for indice trading pairs. It will not work so well for other trading pairs due to overbought and oversold is not as stable as an index trading pair
Remarks
You feedbacks on index trading pairs are appreciated.
Readme
In real life, I am a prolific inventor. I have successfully applied for more than 60 international and regional patents in the past 12 years. But in the past two years or so, I have tried to transfer my creativity to the development of trading strategies. Tradingview is the ideal platform for me. I am selecting and contributing some of the hundreds of scripts to publish in Tradingview community. Welcome everyone to interact with me to discuss these interesting pine scripts.
The scripts posted are categorized into 5 levels according to my efforts or manhours put into these works.
Level 1 : interesting script snippets or distinctive improvement from classic indicators or strategy. Level 1 scripts can usually appear in more complex indicators as a function module or element.
Level 2 : composite indicator/strategy. By selecting or combining several independent or dependent functions or sub indicators in proper way, the composite script exhibits a resonance phenomenon which can filter out noise or fake trading signal to enhance trading confidence level.
Level 3 : comprehensive indicator/strategy. They are simple trading systems based on my strategies. They are commonly containing several or all of entry signal, close signal, stop loss, take profit, re-entry, risk management, and position sizing techniques. Even some interesting fundamental and mass psychological aspects are incorporated.
Level 4 : script snippets or functions that do not disclose source code. Interesting element that can reveal market laws and work as raw material for indicators and strategies. If you find Level 1~2 scripts are helpful, Level 4 is a private version that took me far more efforts to develop.
Level 5 : indicator/strategy that do not disclose source code. private version of Level 3 script with my accumulated script processing skills or a large number of custom functions. I had a private function library built in past two years. Level 5 scripts use many of them to achieve private trading strategy.
Background
This script creates a model of banker fund (whale) with yellow and fuchsia candles. I use blue waves (b5) to detect oversold and overbought, which is more sensistive than candles.
Function
Use composite banker fund trajectory oversold and overbought for long and short entries, which works better for indice trading pairs
Key Signal
j --> banker fund fast line
a2 --> banker funder slow line
support --> dynamic support levels
resistance --> dynamic resistance levels
long --> oversold long entry
short --> overbought short entry
Pros and Cons
This script is suitable for indice trading pairs. It will not work so well for other trading pairs due to overbought and oversold is not as stable as an index trading pair
Remarks
You feedbacks on index trading pairs are appreciated.
Readme
In real life, I am a prolific inventor. I have successfully applied for more than 60 international and regional patents in the past 12 years. But in the past two years or so, I have tried to transfer my creativity to the development of trading strategies. Tradingview is the ideal platform for me. I am selecting and contributing some of the hundreds of scripts to publish in Tradingview community. Welcome everyone to interact with me to discuss these interesting pine scripts.
The scripts posted are categorized into 5 levels according to my efforts or manhours put into these works.
Level 1 : interesting script snippets or distinctive improvement from classic indicators or strategy. Level 1 scripts can usually appear in more complex indicators as a function module or element.
Level 2 : composite indicator/strategy. By selecting or combining several independent or dependent functions or sub indicators in proper way, the composite script exhibits a resonance phenomenon which can filter out noise or fake trading signal to enhance trading confidence level.
Level 3 : comprehensive indicator/strategy. They are simple trading systems based on my strategies. They are commonly containing several or all of entry signal, close signal, stop loss, take profit, re-entry, risk management, and position sizing techniques. Even some interesting fundamental and mass psychological aspects are incorporated.
Level 4 : script snippets or functions that do not disclose source code. Interesting element that can reveal market laws and work as raw material for indicators and strategies. If you find Level 1~2 scripts are helpful, Level 4 is a private version that took me far more efforts to develop.
Level 5 : indicator/strategy that do not disclose source code. private version of Level 3 script with my accumulated script processing skills or a large number of custom functions. I had a private function library built in past two years. Level 5 scripts use many of them to achieve private trading strategy.
Note di rilascio
As reply to socalstew suggestion, simple "Buy" and "Sell" alerts are added in this version.Note di rilascio
OVERVIEW This indicator, developed by blackcat1402, provides a comprehensive view of market dynamics through the L2 Banker Fund Trajectory analysis for indices. It combines multiple technical indicators to generate potential trading signals and visualize market trends.FEATURES
• 📊 Normalized Price Tracking: Monitors price movements within defined bands
• ⚡ Momentum Analysis: Includes three layers of momentum calculations
• 📈 Support & Resistance Levels: Identifies key market levels
• 🔵 BUY/SELL Signals: Clear visual indicators for potential trade opportunities
• 🎯 Alert System: Automatic notifications for significant signals
HOW TO USE
Add the indicator to your chart
Adjust the input parameters: • Short Lookback Period: Default value is 3 • Long Lookback Period: Default value is 6
Monitor the normalized price area and momentum signals
Watch for BUY/SELL labels for potential entry points
VISUAL ELEMENTS
• Blue shaded area: Normalized price movement
• Yellow candlesticks: Momentum above EMAs
• Fuchsia candlesticks: Momentum below EMAs
• Red circles: Resistance levels
• Green circles: Support levels
• Horizontal lines at 50%, 2%, and 98%
LIMITATIONS
• This indicator should not be used as the sole basis for trading decisions
• Backtesting results may differ from live market conditions
• Parameters may need adjustment based on market volatility
NOTES
• Requires sufficient historical data (max_bars_back=5000)
• Works best with index-based instruments
• Consider combining with other technical analysis tools
Script open-source
Nello spirito di TradingView, l'autore di questo script lo ha reso open source, in modo che i trader possano esaminarne e verificarne la funzionalità. Complimenti all'autore! Sebbene sia possibile utilizzarlo gratuitamente, ricordiamo che la ripubblicazione del codice è soggetta al nostro Regolamento.
Avoid losing contact!Don't miss out! The first and most important thing to do is to join my Discord chat now! Click here to start your adventure: discord.com/invite/ZTGpQJq 防止失联,请立即行动,加入本猫聊天群: discord.com/invite/ZTGpQJq
Declinazione di responsabilità
Le informazioni e le pubblicazioni non sono intese come, e non costituiscono, consulenza o raccomandazioni finanziarie, di investimento, di trading o di altro tipo fornite o approvate da TradingView. Per ulteriori informazioni, consultare i Termini di utilizzo.