OPEN-SOURCE SCRIPT
RSI XTR with selective candle color by Edwin K
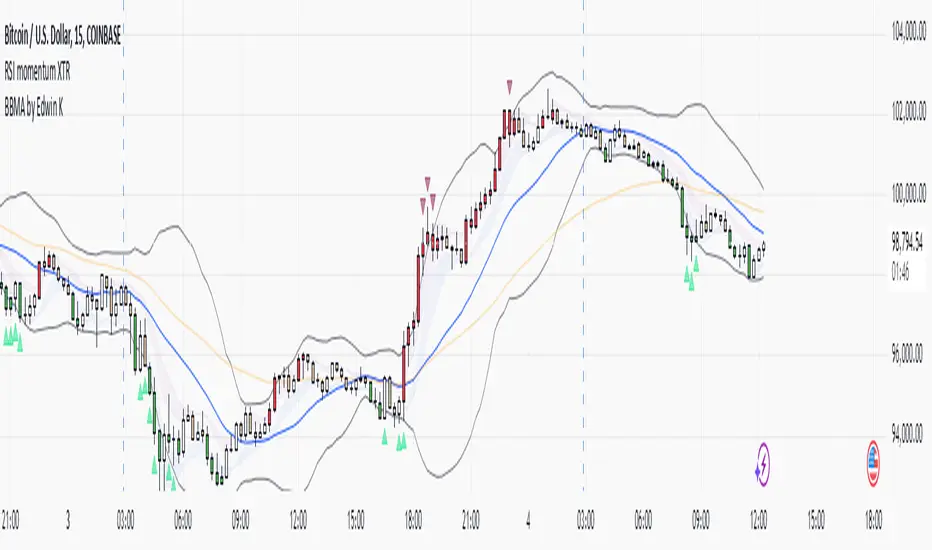
This tradingView indicator named "RSI XTR with selective candle color", which modifies the candle colors on the chart based on RSI (Relative Strength Index) conditions. Here's how it works:
- rsiPeriod: Defines the RSI calculation period (default = 5).
- rsiOverbought: RSI level considered overbought (default = 70).
- rsiOversold: RSI level considered oversold (default = 30).
- These values can be modified by the user in the settings.
RSI Calculation
- Computes the RSI value using the ta.rsi() function on the closing price (close).
- The RSI is a momentum indicator that measures the magnitude of recent price changes.
Conditions for Candle Coloring
- when the RSI is above the overbought level.
- when the RSI is below the oversold level.
How It Works in Practice
- When the RSI is above 70 (overbought) → Candles turn red.
- When the RSI is below 30 (oversold) → Candles turn green.
- If the RSI is between 30 and 70, the candle keeps its default color.
This helps traders quickly spot potential reversal zones based on RSI momentum.
Script open-source
Nello spirito di TradingView, l'autore di questo script lo ha reso open source, in modo che i trader possano esaminarne e verificarne la funzionalità. Complimenti all'autore! Sebbene sia possibile utilizzarlo gratuitamente, ricordiamo che la ripubblicazione del codice è soggetta al nostro Regolamento.
Declinazione di responsabilità
Le informazioni e le pubblicazioni non sono intese come, e non costituiscono, consulenza o raccomandazioni finanziarie, di investimento, di trading o di altro tipo fornite o approvate da TradingView. Per ulteriori informazioni, consultare i Termini di utilizzo.