OPEN-SOURCE SCRIPT
Difference from Highest Price (Last N Candles)
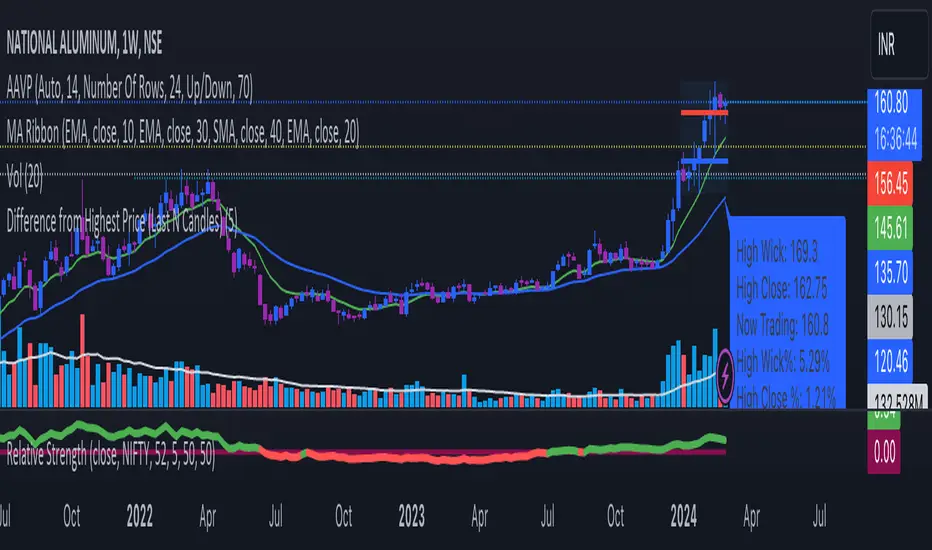
The output of this TradingView indicator is a label that appears below the latest candle on the chart. This label provides information about:
The highest high of the last N candles.
The highest close of the last N candles.
The current trading price.
The percentage difference between the highest high and the current trading price.
The percentage difference between the highest close and the current trading price.
The percentage change in price from the previous candle.
The N-day average percentage change.
This information is useful for traders to understand the relationship between the current price and recent price action, as well as to identify potential overbought or oversold conditions based on the comparison with recent highs and closes.
Here's a breakdown of what the code does:
It takes an input parameter for the number of days (or candles) to consider (input_days).
It calculates the highest high and highest close of the last N candles (highest_last_n_high and highest_last_n_close).
It calculates the difference between the close of the current candle and the close of the previous candle (diff), along with the percentage change.
It maintains an array of percentage changes of the last N days (percentage_changes), updating it with the latest percentage change.
It calculates the sum of percentage changes and the N-day average percentage change.
It calculates the difference between the highest high/highest close of the last N candles and the current trading price, along with their percentage differences.
Finally, it plots this information as a label below the candle for the latest bar.
Script open-source
Nello spirito di TradingView, l'autore di questo script lo ha reso open source, in modo che i trader possano esaminarne e verificarne la funzionalità. Complimenti all'autore! Sebbene sia possibile utilizzarlo gratuitamente, ricordiamo che la ripubblicazione del codice è soggetta al nostro Regolamento.
Declinazione di responsabilità
Le informazioni e le pubblicazioni non sono intese come, e non costituiscono, consulenza o raccomandazioni finanziarie, di investimento, di trading o di altro tipo fornite o approvate da TradingView. Per ulteriori informazioni, consultare i Termini di utilizzo.