OPEN-SOURCE SCRIPT
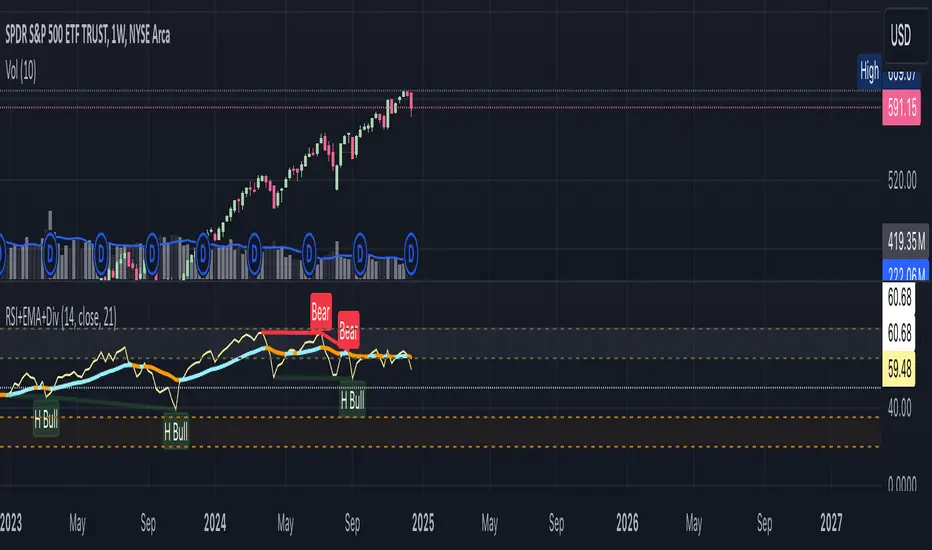
RSI+EMA+MZONES with Divergences

Features:
1. RSI Calculation:
2. EMA of RSI:
3. Bullish and Bearish Divergences:
4. Customizable Labels:
5. Alerts:
6. Fully Customizable:
How to Use:
1. RSI Calculation:
- Uses user-defined periods to calculate the RSI and visualize momentum shifts.
- Plots key RSI zones, including upper (overbought), lower (oversold), and middle levels.
2. EMA of RSI:
- Includes an Exponential Moving Average (EMA) of the RSI for trend smoothing and confirmation.
3. Bullish and Bearish Divergences:
- Detects Regular divergences (labeled as “Bull” and “Bear”) for classic signals.
- Identifies Hidden divergences (labeled as “H Bull” and “H Bear”) for potential trend continuation opportunities.
4. Customizable Labels:
- Displays divergence labels directly on the chart.
- Labels can be toggled on or off for better chart visibility.
5. Alerts:
- Predefined alerts for both regular and hidden divergences to notify users in real time.
6. Fully Customizable:
- Adjust RSI period, lookback settings, divergence ranges, and visibility preferences.
- Colors and styles are easily configurable to match your trading style.
How to Use:
- RSI Zones: Use RSI and its zones to identify overbought/oversold conditions.
- EMA: Look for crossovers or confluence with divergences for confirmation.
- Divergences: Monitor for “Bull,” “Bear,” “H Bull,” or “H Bear” labels to spot key reversal or continuation signals.
- Alerts: Set alerts to be notified of divergence opportunities without constant chart monitoring.
Script open-source
Nello spirito di TradingView, l'autore di questo script lo ha reso open source, in modo che i trader possano esaminarne e verificarne la funzionalità. Complimenti all'autore! Sebbene sia possibile utilizzarlo gratuitamente, ricordiamo che la ripubblicazione del codice è soggetta al nostro Regolamento.
Declinazione di responsabilità
Le informazioni e le pubblicazioni non sono intese come, e non costituiscono, consulenza o raccomandazioni finanziarie, di investimento, di trading o di altro tipo fornite o approvate da TradingView. Per ulteriori informazioni, consultare i Termini di utilizzo.