OPEN-SOURCE SCRIPT
Aggiornato CQ_[TACHIMETER]
The Tachimeter Indicator: A Fun Financial Gauge
Visualizing Market Momentum in Real Time
Introduction
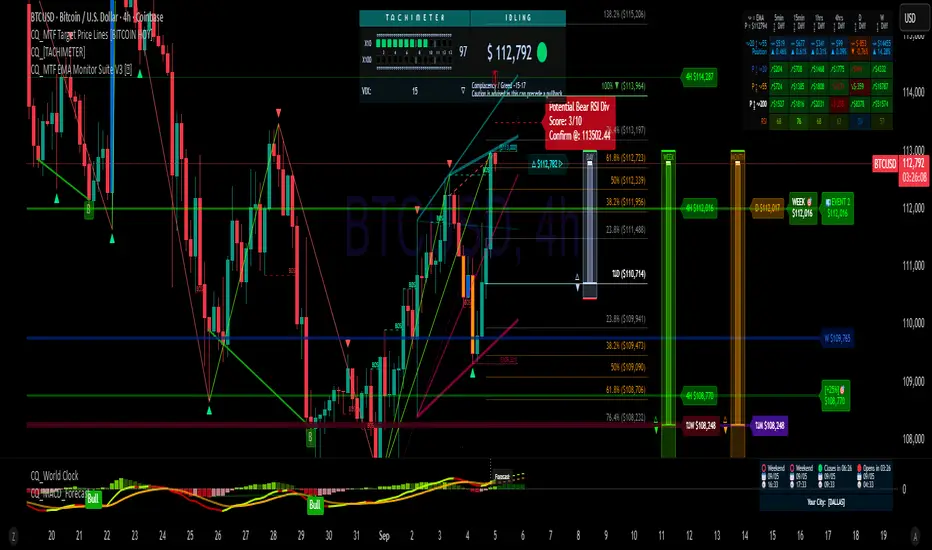
The Tachimeter is a playful and innovative indicator designed for those who enjoy observing the financial markets with a touch of excitement. Much like the tachometer in a car measures engine revolutions per minute, the Tachimeter measures the "revolutions" of money in the market — showing just how fast funds are moving in or out, every twenty seconds.
What Does the Tachimeter Show?
At its core, the Tachimeter displays how much money (in U.S. dollars) is shifting direction — either up or down — from the current price within a 20-second window. The indicator operates on a scale that starts at $0 (no significant movement) and extends to $1200, representing the maximum flow observed in each 20-second period.
• Scale: $0 to $1200 every 20 seconds
• Direction: Indicates if money is moving upwards (buying) or downwards (selling)
• Purpose: For entertainment and observation, not for actual trading decisions
Visual Design and Interpretation
The Tachimeter features a gauge reminiscent of a car’s tachometer. The gauge moves to show the current intensity of money flowing into or out of the market right now, providing an immediate sense of how "fast" buyers or sellers are acting.
• Gauge Indicator: The amount of squares shows the speed of ongoing transactions, just like a rev counter in a vehicle.
• Color-Coded Title: The title of the indicator switches colors based on the market’s relationship to the daily opening price:
• Red: When the current price is lower than the daily opening price, indicating downward momentum.
• Green: When the current price is higher than the daily opening price, signaling buying momentum.
How to Use the Tachimeter
This indicator is intended purely for fun — it gives you a rapid, visual sense of market activity, letting you "feel" the excitement of fluctuating prices. If you enjoy watching the markets move, the Tachimeter adds a dynamic, visceral element to your experience.
• Watch the needle twitch higher as heavy buying or selling takes place.
• Notice title color changes as the market sentiment shifts from bullish (green) to bearish (red), or vice versa.
• Use it as a conversation starter or to enhance your enjoyment of fast-paced trading sessions.
Final Thoughts
Like your car’s tachometer helps you sense when to shift gears, the Tachimeter lets you sense when the market is "revving up." It’s not a tool for serious decision-making, but it transforms raw financial data into an engaging, interactive visual — perfect for those who appreciate both finance and a bit of fun.
Enjoy watching the market’s RPMs!
Visualizing Market Momentum in Real Time
Introduction
The Tachimeter is a playful and innovative indicator designed for those who enjoy observing the financial markets with a touch of excitement. Much like the tachometer in a car measures engine revolutions per minute, the Tachimeter measures the "revolutions" of money in the market — showing just how fast funds are moving in or out, every twenty seconds.
What Does the Tachimeter Show?
At its core, the Tachimeter displays how much money (in U.S. dollars) is shifting direction — either up or down — from the current price within a 20-second window. The indicator operates on a scale that starts at $0 (no significant movement) and extends to $1200, representing the maximum flow observed in each 20-second period.
• Scale: $0 to $1200 every 20 seconds
• Direction: Indicates if money is moving upwards (buying) or downwards (selling)
• Purpose: For entertainment and observation, not for actual trading decisions
Visual Design and Interpretation
The Tachimeter features a gauge reminiscent of a car’s tachometer. The gauge moves to show the current intensity of money flowing into or out of the market right now, providing an immediate sense of how "fast" buyers or sellers are acting.
• Gauge Indicator: The amount of squares shows the speed of ongoing transactions, just like a rev counter in a vehicle.
• Color-Coded Title: The title of the indicator switches colors based on the market’s relationship to the daily opening price:
• Red: When the current price is lower than the daily opening price, indicating downward momentum.
• Green: When the current price is higher than the daily opening price, signaling buying momentum.
How to Use the Tachimeter
This indicator is intended purely for fun — it gives you a rapid, visual sense of market activity, letting you "feel" the excitement of fluctuating prices. If you enjoy watching the markets move, the Tachimeter adds a dynamic, visceral element to your experience.
• Watch the needle twitch higher as heavy buying or selling takes place.
• Notice title color changes as the market sentiment shifts from bullish (green) to bearish (red), or vice versa.
• Use it as a conversation starter or to enhance your enjoyment of fast-paced trading sessions.
Final Thoughts
Like your car’s tachometer helps you sense when to shift gears, the Tachimeter lets you sense when the market is "revving up." It’s not a tool for serious decision-making, but it transforms raw financial data into an engaging, interactive visual — perfect for those who appreciate both finance and a bit of fun.
Enjoy watching the market’s RPMs!
Note di rilascio
New horizontal design.Note di rilascio
Minor update, eliminating redundant arrowhead.Note di rilascio
Minor corrections made to script.Note di rilascio
Added VIX analysis row.Script open-source
In pieno spirito TradingView, il creatore di questo script lo ha reso open-source, in modo che i trader possano esaminarlo e verificarne la funzionalità. Complimenti all'autore! Sebbene sia possibile utilizzarlo gratuitamente, ricorda che la ripubblicazione del codice è soggetta al nostro Regolamento.
Declinazione di responsabilità
Le informazioni ed i contenuti pubblicati non costituiscono in alcun modo una sollecitazione ad investire o ad operare nei mercati finanziari. Non sono inoltre fornite o supportate da TradingView. Maggiori dettagli nelle Condizioni d'uso.
Script open-source
In pieno spirito TradingView, il creatore di questo script lo ha reso open-source, in modo che i trader possano esaminarlo e verificarne la funzionalità. Complimenti all'autore! Sebbene sia possibile utilizzarlo gratuitamente, ricorda che la ripubblicazione del codice è soggetta al nostro Regolamento.
Declinazione di responsabilità
Le informazioni ed i contenuti pubblicati non costituiscono in alcun modo una sollecitazione ad investire o ad operare nei mercati finanziari. Non sono inoltre fornite o supportate da TradingView. Maggiori dettagli nelle Condizioni d'uso.