OPEN-SOURCE SCRIPT
Aggiornato MA Trends — mura vision
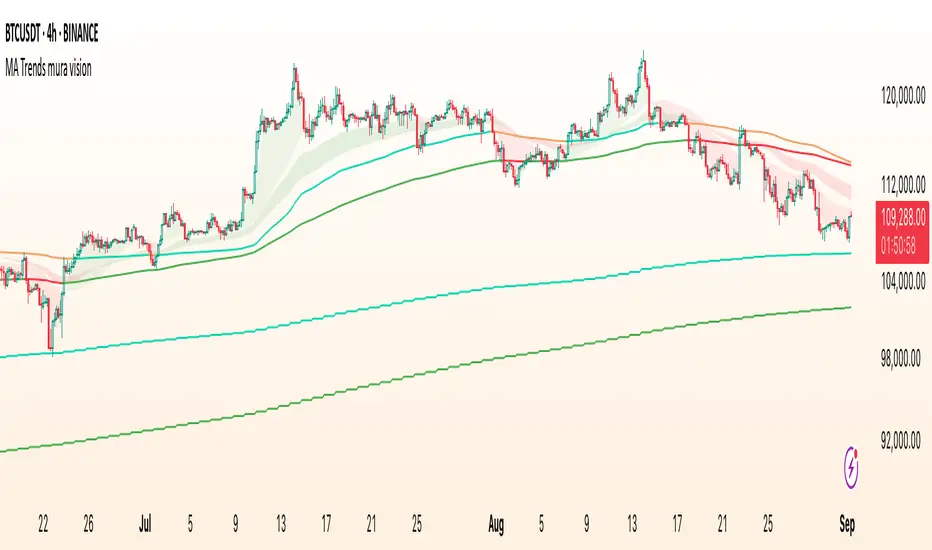
MA Trends — mura vision is a multi-timeframe trend map that blends two local trend “ribbons” on the current timeframe with higher-timeframe context lines. It helps you read market bias at a glance and align entries with the dominant trend.
What the indicator plots
On the current timeframe
Higher-timeframe context
Optional (disabled by default)
EMA 233 & KAMA 233 on the current TF — toggle on if you want the same 233 anchors on the chart’s timeframe.
Note: All higher-TF series are requested viaPine Script® with Pine Script® .
How to read it
1 Bias: Use the 4H/1D EMA/KAMA 233 as dynamic anchors.
• Green = price is above the anchor on that HTF (supportive context).
• Red = price is below the anchor on that HTF (resistive context).
2 Alignment: When both ribbons are green (SMA5>34 and EMA55>89) while HTF anchors are green, momentum and context agree (higher-quality trend). The opposite coloring suggests bearish alignment.
3 Pullbacks: Retracements toward the ribbon edges often act as retest zones within the prevailing regime.
Inputs & customization
SMA 5/34 (current TF), EMA 55/89 (current TF), EMA/KAMA 233 for 4H, 1D, and current TF (the latter are off by default).
Lines for SMA5/SMA34 and EMA55/EMA89 (plotted with high transparency), fill colors for up/down trend ribbons, and separate support/resistance colors for EMA/KAMA 233.
MTF behavior & repainting notes
Good practices
What this script is / isn’t
Credits & license
Disclaimer
Trading involves risk. This indicator is provided “as is” for informational/educational use only and is not financial advice. Always test on historical data and use proper risk management.
What the indicator plots
On the current timeframe
- SMA 5/34 — short-term trend ribbon (filled area between SMA5 and SMA34).
- EMA 55/89 — swing trend ribbon (filled area between EMA55 and EMA89).
Higher-timeframe context
- EMA 233 (4H & 1D) — plotted as lines. Color reflects whether price on the same HTF is above (support) or below (resistance).
- KAMA 233 (4H & 1D) — plotted as lines using a custom Kaufman implementation (Efficiency Ratio with fast=2, slow=30; squared smoothing). Color logic is the same as EMA 233.
Optional (disabled by default)
EMA 233 & KAMA 233 on the current TF — toggle on if you want the same 233 anchors on the chart’s timeframe.
Note: All higher-TF series are requested via
request.security()
lookahead_off
How to read it
1 Bias: Use the 4H/1D EMA/KAMA 233 as dynamic anchors.
• Green = price is above the anchor on that HTF (supportive context).
• Red = price is below the anchor on that HTF (resistive context).
2 Alignment: When both ribbons are green (SMA5>34 and EMA55>89) while HTF anchors are green, momentum and context agree (higher-quality trend). The opposite coloring suggests bearish alignment.
3 Pullbacks: Retracements toward the ribbon edges often act as retest zones within the prevailing regime.
Inputs & customization
- Visibility toggles for each block:
SMA 5/34 (current TF), EMA 55/89 (current TF), EMA/KAMA 233 for 4H, 1D, and current TF (the latter are off by default).
- Colors:
Lines for SMA5/SMA34 and EMA55/EMA89 (plotted with high transparency), fill colors for up/down trend ribbons, and separate support/resistance colors for EMA/KAMA 233.
- Line width for all 233 anchors.
MTF behavior & repainting notes
- HTF lines (4H/1D) are computed with and update intrabar until the higher-TF candle closes. This is expected on TradingView and not “future-looking”, but values can stabilize only at the close of the 4H/1D bar.
Pine Script® lookahead_off - If you require strictly confirmed HTF values, use a “previous bar” approach (e.g., plotting series[1]) — not included here to keep the display responsive.
Good practices
- Determine direction with 4H/1D EMA/KAMA 233, then refine timing with the current-TF ribbons.
- For conservative use, favor trades with the color of the dominant HTF anchor.
- Combine with your own risk management and confirmation rules.
What this script is / isn’t
- ✅ Visual analysis tool for multi-timeframe trend context.
- ❌ Not a strategy: it does not generate orders or calculate P&L.
Credits & license
- © trading_mura — Published for educational purposes under the Mozilla Public License 2.0.
- KAMA is implemented via a custom Kaufman method (ER with fast=2, slow=30, squared smoothing), not .
Pine Script® ta.kama()
Disclaimer
Trading involves risk. This indicator is provided “as is” for informational/educational use only and is not financial advice. Always test on historical data and use proper risk management.
Note di rilascio
Made some small updatesScript open-source
Nello spirito di TradingView, l'autore di questo script lo ha reso open source, in modo che i trader possano esaminarne e verificarne la funzionalità. Complimenti all'autore! Sebbene sia possibile utilizzarlo gratuitamente, ricordiamo che la ripubblicazione del codice è soggetta al nostro Regolamento.
✅My Telegram
t.me/trading_mura
t.me/trading_mura
Declinazione di responsabilità
Le informazioni e le pubblicazioni non sono intese come, e non costituiscono, consulenza o raccomandazioni finanziarie, di investimento, di trading o di altro tipo fornite o approvate da TradingView. Per ulteriori informazioni, consultare i Termini di utilizzo.
Script open-source
Nello spirito di TradingView, l'autore di questo script lo ha reso open source, in modo che i trader possano esaminarne e verificarne la funzionalità. Complimenti all'autore! Sebbene sia possibile utilizzarlo gratuitamente, ricordiamo che la ripubblicazione del codice è soggetta al nostro Regolamento.
✅My Telegram
t.me/trading_mura
t.me/trading_mura
Declinazione di responsabilità
Le informazioni e le pubblicazioni non sono intese come, e non costituiscono, consulenza o raccomandazioni finanziarie, di investimento, di trading o di altro tipo fornite o approvate da TradingView. Per ulteriori informazioni, consultare i Termini di utilizzo.