OPEN-SOURCE SCRIPT
Aggiornato [blackcat] L1 Vitali Apirine Weekly And Daily MACD
Level 1
Background
This indicator was originally formulated by Vitali Apirine for TASC - December 2017 Traders Tips, “Weekly & Daily MACD”.
Function
In the article “Weekly & Daily MACD” in this issue, author Vitali Apirine introduces a novel approach to using the classic MACD indicator in a way that simulates calculations based on different timeframes while using just a daily-interval chart. He describes a number of ways to use this new indicator that allows traders to adapt it to differing markets and conditions.
Remarks
Feedbacks are appreciated.
Note di rilascio
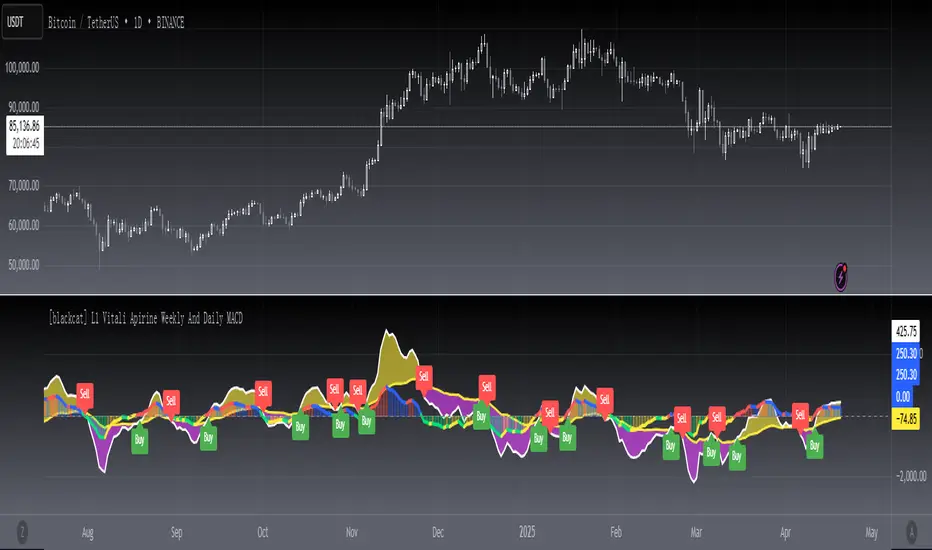
OVERVIEWThe [blackcat] L1 Vitali Apirine Weekly And Daily MACD indicator combines both daily and weekly Moving Average Convergence Divergence (MACD) calculations to provide a comprehensive view of market momentum across different timeframes. This script plots the MACD lines and histograms, generating alerts and labels for potential buy and sell opportunities. By analyzing the relationship between daily and weekly MACD values, traders can gain insights into short-term and long-term market trends 📈💹.
FEATURES
Calculates Daily MACD and Weekly MACD using customizable lengths:
Daily Fast Length: Default 12 periods.
Daily Slow Length: Default 26 periods.
Weekly Fast Length: Default 60 periods.
Weekly Slow Length: Default 130 periods.
Signal Length: Default 9 periods.
Plots Weekly MACD and Relative Daily MACD lines for easy visualization:
Yellow line represents Weekly MACD.
White line represents Relative Daily MACD.
Generates alerts based on crossover events between Relative Daily MACD and Weekly MACD 🔔
Displays buy ('Buy') and sell ('Sell') labels on the chart for quick identification 🏷️
Includes a dynamic MACD histogram with color-coded bars indicating trend strength:
HOW TO USE
Add the indicator to your TradingView chart by selecting it from the indicators list.
Adjust the input parameters (Fast Lengths, Slow Lengths, and Signal Length) to suit your preferred sensitivity ⚙️.
Monitor the chart for buy and sell labels indicating potential trade opportunities.
Set up alerts based on the generated signals to receive notifications when conditions are met 📲.
Analyze the MACD histogram for additional context on market momentum.
LIMITATIONS
The indicator relies heavily on MACD, which might not capture all market nuances.
False signals can occur in ranging or sideways markets 🌪️.
Users should always confirm signals with other forms of analysis before making trading decisions.
NOTES
Ensure that you have sufficient historical data available for accurate MACD calculations.
Test the indicator thoroughly on demo accounts before applying it to live trading 🔍.
Customize the appearance and parameters as needed to fit your trading strategy.
Script open-source
Nello spirito di TradingView, l'autore di questo script lo ha reso open source, in modo che i trader possano esaminarne e verificarne la funzionalità. Complimenti all'autore! Sebbene sia possibile utilizzarlo gratuitamente, ricordiamo che la ripubblicazione del codice è soggetta al nostro Regolamento.
Avoid losing contact!Don't miss out! The first and most important thing to do is to join my Discord chat now! Click here to start your adventure: discord.com/invite/ZTGpQJq 防止失联,请立即行动,加入本猫聊天群: discord.com/invite/ZTGpQJq
Declinazione di responsabilità
Le informazioni e le pubblicazioni non sono intese come, e non costituiscono, consulenza o raccomandazioni finanziarie, di investimento, di trading o di altro tipo fornite o approvate da TradingView. Per ulteriori informazioni, consultare i Termini di utilizzo.