OPEN-SOURCE SCRIPT
Aggiornato 9-20 sma multi timeframe indicator
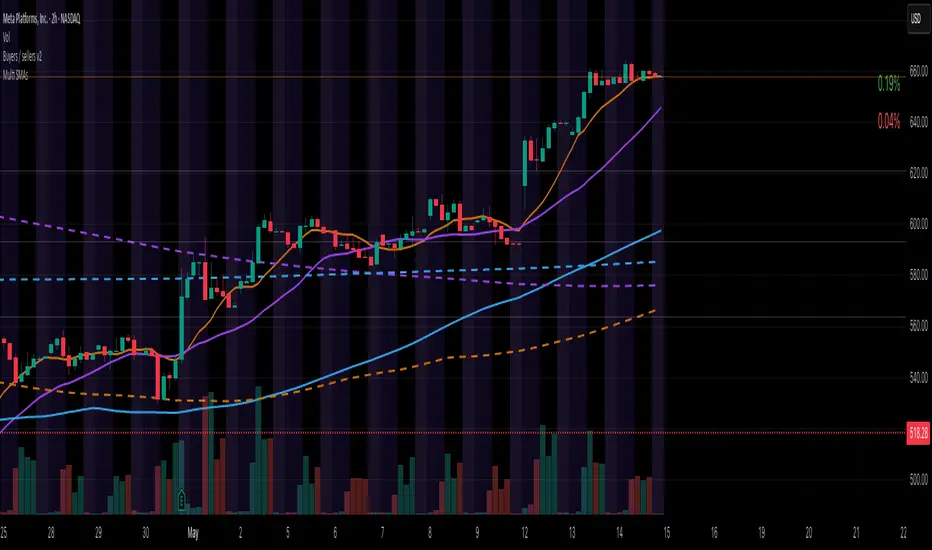
This is an indicator to help visualizing the 9 and the 20 sma on 3 different timeframes.
When they cross, you will see a cross on the band representing the timeframe.
When a trade is favorable the band will color in green for up trend and in red for downtrend:
- Conditions in uptrend: Start after the first green candle closed above the 9 sma, Stop after the first red candle closed under the 9 sma
- Conditions in downtrend: Start after the first red candle closed below the 9 sma, Stop after the first green candle closed above the 9 sma
Note di rilascio
updated titleNote di rilascio
Fixed timeframe calculation for the "D" taking into account extended market / futures / cryptoScript open-source
Nello spirito di TradingView, l'autore di questo script lo ha reso open source, in modo che i trader possano esaminarne e verificarne la funzionalità. Complimenti all'autore! Sebbene sia possibile utilizzarlo gratuitamente, ricordiamo che la ripubblicazione del codice è soggetta al nostro Regolamento.
Declinazione di responsabilità
Le informazioni e le pubblicazioni non sono intese come, e non costituiscono, consulenza o raccomandazioni finanziarie, di investimento, di trading o di altro tipo fornite o approvate da TradingView. Per ulteriori informazioni, consultare i Termini di utilizzo.
Script open-source
Nello spirito di TradingView, l'autore di questo script lo ha reso open source, in modo che i trader possano esaminarne e verificarne la funzionalità. Complimenti all'autore! Sebbene sia possibile utilizzarlo gratuitamente, ricordiamo che la ripubblicazione del codice è soggetta al nostro Regolamento.
Declinazione di responsabilità
Le informazioni e le pubblicazioni non sono intese come, e non costituiscono, consulenza o raccomandazioni finanziarie, di investimento, di trading o di altro tipo fornite o approvate da TradingView. Per ulteriori informazioni, consultare i Termini di utilizzo.