OPEN-SOURCE SCRIPT
Aggiornato Emibap's Uniswap V3 HEX/USDC 3% Liquidity Pool
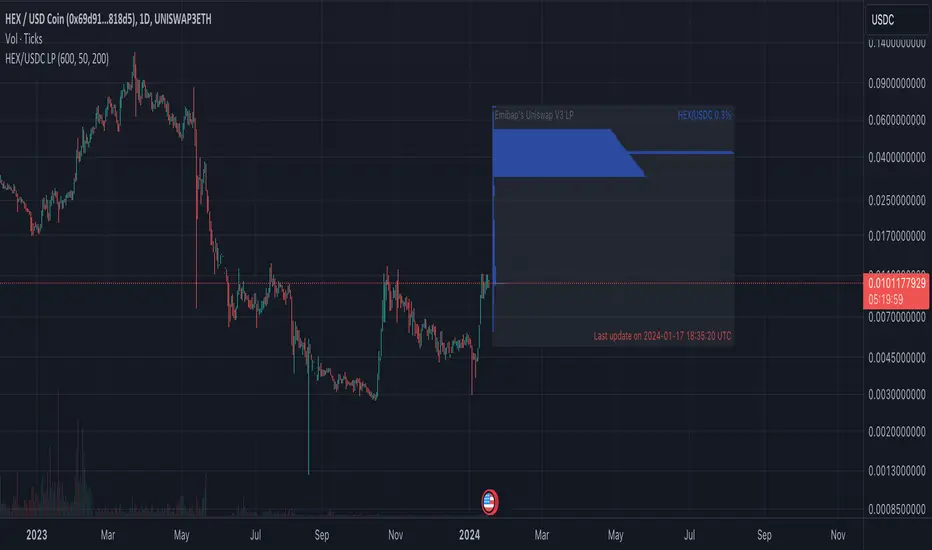
This script will display a histogram of the Uniswap V3 HEX / USDC 3% liquidity pool.
Similar to what you can see in the liquidity section of the Uniswap pool page but conveniently rendered alongside your chart.
It's meant to be used on any HEX / USDC chart only.
One of the main motivations for using this in your HEX / USDC chart is to get an idea of the current sentiment: If most of the volume is below the price it might be an indication of an upcoming move up, for instance.
I'll try to update the liquidity regularly; if possible several times a day.
Using the 4h, daily, or weekly time frames is highly recommended.
The options are straightforward:
- Histogram bars color. Default is blue
- Histogram background color. Default is black at 20% opacity
- Upper price limit of the diagram: Visible upper bound price limit for the histogram, based on the current price. I.E: 200%: If the price is 1, the histogram will show 3 as the upper bound
- Lower price limit of the diagram. Visible lower bound price limit for the histogram, based on the current price. I.E: 99%: If the price is 1, the histogram will show 0. 01 as the upper bound
- Width of the widest bar: Width (in bars) for the widest bar of the histogram. The more the higher resolution you'll get
Note di rilascio
Updated liquidityNote di rilascio
Updated liquidityNote di rilascio
Updated liquidityNote di rilascio
Updated liquidityNote di rilascio
Updated liquidityNote di rilascio
Updated liquidityNote di rilascio
Updated liquidityNote di rilascio
Updated liquidityNote di rilascio
Updated liquidityNote di rilascio
Updated liquidityNote di rilascio
Updated liquidityNote di rilascio
Updated liquidityNote di rilascio
Updated liquidityNote di rilascio
Updated liquidityNote di rilascio
Updated liquidityNote di rilascio
Updated liquidityNote di rilascio
Updated liquidityNote di rilascio
Updated liquidityNote di rilascio
Updated liquidityNote di rilascio
Updated liquidityNote di rilascio
Updated liquidityNote di rilascio
Updated liquidityNote di rilascio
Updated liquidityNote di rilascio
Updated liquidityNote di rilascio
Updated liquidityNote di rilascio
Updated liquidityNote di rilascio
Updated liquidityNote di rilascio
Updated liquidityNote di rilascio
Updated liquidityNote di rilascio
Updated liquidityNote di rilascio
Updated liquidityNote di rilascio
Updated liquidityNote di rilascio
Updated liquidityNote di rilascio
Updated liquidityNote di rilascio
Updated liquidityNote di rilascio
Updated liquidityNote di rilascio
Updated liquidityNote di rilascio
Updated liquidityNote di rilascio
Updated liquidityNote di rilascio
Updated liquidityNote di rilascio
Updated liquidityNote di rilascio
Updated liquidityNote di rilascio
Updated liquidityNote di rilascio
Updated liquidityNote di rilascio
Updated liquidityNote di rilascio
Updated liquidityNote di rilascio
Updated liquidityNote di rilascio
Updated liquidityNote di rilascio
Updated liquidityNote di rilascio
Updated liquidityNote di rilascio
Updated liquidityNote di rilascio
Updated liquidityNote di rilascio
Updated liquidityNote di rilascio
Updated liquidityNote di rilascio
Updated liquidityNote di rilascio
Updated liquidityNote di rilascio
Updated liquidityNote di rilascio
Updated liquidityNote di rilascio
Updated liquidityNote di rilascio
Updated liquidityNote di rilascio
Updated liquidityNote di rilascio
Updated liquidityNote di rilascio
Updated liquidityNote di rilascio
Updated liquidityNote di rilascio
Updated liquidityNote di rilascio
Updated liquidityNote di rilascio
Updated liquidityNote di rilascio
Updated liquidityNote di rilascio
Updated liquidityNote di rilascio
Updated liquidityNote di rilascio
Updated liquidityNote di rilascio
Updated liquidityNote di rilascio
Updated liquidityNote di rilascio
Updated liquidityNote di rilascio
Updated liquidityNote di rilascio
Updated liquidityNote di rilascio
Updated liquidityNote di rilascio
Updated liquidityNote di rilascio
Updated liquidityNote di rilascio
Updated liquidityNote di rilascio
Updated liquidityNote di rilascio
Updated liquidityNote di rilascio
Updated liquidityNote di rilascio
Updated liquidityNote di rilascio
Updated liquidityNote di rilascio
Updated liquidityNote di rilascio
Updated liquidityNote di rilascio
Updated liquidityNote di rilascio
Updated liquidityNote di rilascio
Updated liquidityNote di rilascio
Updated liquidityNote di rilascio
Updated liquidityNote di rilascio
Updated liquidityNote di rilascio
Updated liquidityNote di rilascio
Updated liquidityNote di rilascio
Updated liquidityNote di rilascio
Updated liquidityNote di rilascio
Updated liquidityNote di rilascio
Updated liquidityNote di rilascio
Updated liquidityNote di rilascio
Updated liquidityNote di rilascio
Updated liquidityNote di rilascio
Updated liquidityNote di rilascio
Updated liquidityNote di rilascio
Updated liquidityNote di rilascio
Updated liquidityNote di rilascio
Updated liquidityNote di rilascio
Updated liquidityNote di rilascio
Updated liquidityNote di rilascio
Updated liquidityNote di rilascio
Updated liquidityNote di rilascio
Updated liquidityNote di rilascio
Updated liquidityNote di rilascio
Updated liquidityNote di rilascio
Updated liquidityNote di rilascio
Updated liquidityNote di rilascio
Updated liquidityNote di rilascio
Updated liquidityNote di rilascio
Updated liquidityNote di rilascio
Updated liquidityNote di rilascio
Updated liquidityNote di rilascio
Updated liquidityNote di rilascio
Updated liquidityNote di rilascio
Updated liquidityNote di rilascio
Updated liquidityNote di rilascio
Updated liquidityNote di rilascio
Updated liquidityNote di rilascio
Updated liquidityNote di rilascio
Updated liquidityNote di rilascio
Updated liquidityNote di rilascio
Updated liquidityNote di rilascio
Updated liquidityNote di rilascio
Updated liquidityNote di rilascio
Updated liquidityNote di rilascio
Updated liquidityNote di rilascio
Updated liquidityNote di rilascio
Updated liquidityNote di rilascio
Updated liquidityNote di rilascio
Updated liquidityNote di rilascio
Updated liquidityNote di rilascio
Updated liquidityNote di rilascio
Updated liquidityNote di rilascio
Updated liquidityNote di rilascio
- Added an overlayed view of the HEX/USDC 1% LP
Note di rilascio
Updated liquidityNote di rilascio
Updated liquidityNote di rilascio
Updated liquidityNote di rilascio
Updated liquidityNote di rilascio
Updated liquidityNote di rilascio
Updated liquidityNote di rilascio
Updated liquidityNote di rilascio
Updated liquidityNote di rilascio
Updated liquidityNote di rilascio
Updated liquidityNote di rilascio
Updated liquidityNote di rilascio
Updated liquidityNote di rilascio
Updated liquidityNote di rilascio
Updated liquidityNote di rilascio
Updated liquidityNote di rilascio
Updated liquidityNote di rilascio
Updated liquidityNote di rilascio
Updated liquidityNote di rilascio
Updated liquidityNote di rilascio
Updated liquidityNote di rilascio
Updated liquidityNote di rilascio
Updated liquidityNote di rilascio
Updated liquidityNote di rilascio
Updated liquidityNote di rilascio
Updated liquidityNote di rilascio
Updated liquidityNote di rilascio
Updated liquidityNote di rilascio
Updated liquidityNote di rilascio
Updated liquidityNote di rilascio
Updated liquidityNote di rilascio
Updated liquidityNote di rilascio
Updated liquidityNote di rilascio
Updated liquidityNote di rilascio
Updated liquidityNote di rilascio
Updated liquidityNote di rilascio
Updated liquidityNote di rilascio
Updated liquidityNote di rilascio
Updated liquidityNote di rilascio
Updated liquidityNote di rilascio
Updated liquidityNote di rilascio
Updated liquidityNote di rilascio
Updated liquidityNote di rilascio
Updated liquidityNote di rilascio
Updated liquidityNote di rilascio
Updated liquidityNote di rilascio
Updated liquidityNote di rilascio
Updated liquidityNote di rilascio
Updated liquidityNote di rilascio
Updated liquidityNote di rilascio
Updated liquidityNote di rilascio
Updated liquidityNote di rilascio
Updated liquidityNote di rilascio
Updated liquidityNote di rilascio
Updated liquidityNote di rilascio
Updated liquidityNote di rilascio
Updated liquidityNote di rilascio
Updated liquidityNote di rilascio
Updated liquidityNote di rilascio
Updated liquidityNote di rilascio
Updated liquidityNote di rilascio
Updated liquidityNote di rilascio
Updated liquidityNote di rilascio
Updated liquidityNote di rilascio
Updated liquidityNote di rilascio
Updated liquidityNote di rilascio
Updated liquidityNote di rilascio
Updated liquidityNote di rilascio
Updated liquidityNote di rilascio
Updated liquidityNote di rilascio
Updated liquidityNote di rilascio
Updated liquidityNote di rilascio
Updated liquidityNote di rilascio
Updated liquidityNote di rilascio
Updated liquidityNote di rilascio
Updated liquidityNote di rilascio
Updated liquidityNote di rilascio
Updated liquidityNote di rilascio
Updated liquidityNote di rilascio
Updated liquidityNote di rilascio
Updated liquidityNote di rilascio
Updated liquidityNote di rilascio
Updated liquidityNote di rilascio
Updated liquidityNote di rilascio
Updated liquidityNote di rilascio
Updated liquidityNote di rilascio
Updated liquidityNote di rilascio
Updated liquidityNote di rilascio
Updated liquidityNote di rilascio
Updated liquidityNote di rilascio
Updated liquidityNote di rilascio
Updated liquidityNote di rilascio
Updated liquidityNote di rilascio
Updated liquidityNote di rilascio
Updated liquidityNote di rilascio
Updated liquidityNote di rilascio
Updated liquidityNote di rilascio
Updated liquidityNote di rilascio
Updated liquidityNote di rilascio
Updated liquidityNote di rilascio
Updated liquidityNote di rilascio
Updated liquidityNote di rilascio
Updated liquidityNote di rilascio
Updated liquidityNote di rilascio
Updated liquidityNote di rilascio
Updated liquidityNote di rilascio
Updated liquidityNote di rilascio
Updated liquidityNote di rilascio
Updated liquidityNote di rilascio
Updated liquidityNote di rilascio
Updated liquidityNote di rilascio
Updated liquidityNote di rilascio
Updated liquidityNote di rilascio
Updated liquidityNote di rilascio
Updated liquidityNote di rilascio
Updated liquidityNote di rilascio
Updated liquidityNote di rilascio
Updated liquidityNote di rilascio
Updated liquidityNote di rilascio
Updated liquidityNote di rilascio
Updated liquidityNote di rilascio
Updated liquidityNote di rilascio
Updated liquidityNote di rilascio
Updated liquidityNote di rilascio
Updated liquidityNote di rilascio
Updated liquidityNote di rilascio
Updated liquidityNote di rilascio
Updated liquidityNote di rilascio
Updated liquidityNote di rilascio
Updated liquidityNote di rilascio
Updated liquidityNote di rilascio
Updated liquidityNote di rilascio
Updated liquidityNote di rilascio
This script will display a histogram of the Uniswap V3 HEX / USDC 3% liquidity pool.Similar to what you can see in the liquidity section of the Uniswap pool page but conveniently rendered alongside your chart.
It's meant to be used on any ethereum HEX / USDC chart only.
One of the main motivations for using this in your HEX / USDC chart is to get an idea of the current sentiment: If most of the volume is below the price it might be an indication of an upcoming move up, for instance.
I'll try to update the liquidity regularly.
Using the 4h, daily, or weekly time frames is highly recommended.
The options are straightforward:
- Histogram bars color. Default is blue
- Histogram background color. Default is black at 20% opacity
- Upper price limit of the diagram: Visible upper bound price limit for the histogram, based on the current price. I.E: 200%: If the price is 1, the histogram will show 3 as the upper bound
- Lower price limit of the diagram. Visible lower bound price limit for the histogram, based on the current price. I.E: 99%: If the price is 1, the histogram will show 0. 01 as the upper bound
- Width of the widest bar: Width (in bars) for the widest bar of the histogram. The more the higher resolution you'll get
Note di rilascio
This script will display a histogram of the Uniswap V3 HEX / USDC 3% liquidity pool.Similar to what you can see in the liquidity section of the Uniswap pool page but conveniently rendered alongside your chart.
It's meant to be used on a HEX / USDC chart only. The price should be expressed in USDC for it to work.
One of the main motivations for using this in your chart is to get an idea of the current sentiment: If most of the volume is below the price it might be an indication of an upcoming move up, for instance.
I'll try to update the liquidity regularly.
Using the 4h, daily, or weekly time frames is highly recommended.
The options are straightforward:
- Histogram bars color. Default is blue
- Histogram background color. Default is black at 20% opacity
- Upper price limit of the diagram: Visible upper bound price limit for the histogram, based on the current price. I.E: 200%: If the price is 1, the histogram will show 3 as the upper bound
- Lower price limit of the diagram. Visible lower bound price limit for the histogram, based on the current price. I.E: 99%: If the price is 1, the histogram will show 0. 01 as the upper bound
- Width of the widest bar: Width (in bars) for the widest bar of the histogram. The more the higher resolution you'll get
Note di rilascio
This indicator has been deprecated. Please replace it with a unified HEX LP tool:https://www.tradingview.com/script/Rv2X1Vxg-Emibap-s-HEX-Uniswap-v3-Liquidity-Pool/
Script open-source
Nello spirito di TradingView, l'autore di questo script lo ha reso open source, in modo che i trader possano esaminarne e verificarne la funzionalità. Complimenti all'autore! Sebbene sia possibile utilizzarlo gratuitamente, ricordiamo che la ripubblicazione del codice è soggetta al nostro Regolamento.
Declinazione di responsabilità
Le informazioni e le pubblicazioni non sono intese come, e non costituiscono, consulenza o raccomandazioni finanziarie, di investimento, di trading o di altro tipo fornite o approvate da TradingView. Per ulteriori informazioni, consultare i Termini di utilizzo.