OPEN-SOURCE SCRIPT
McClellan Summation Index [LazyBear]
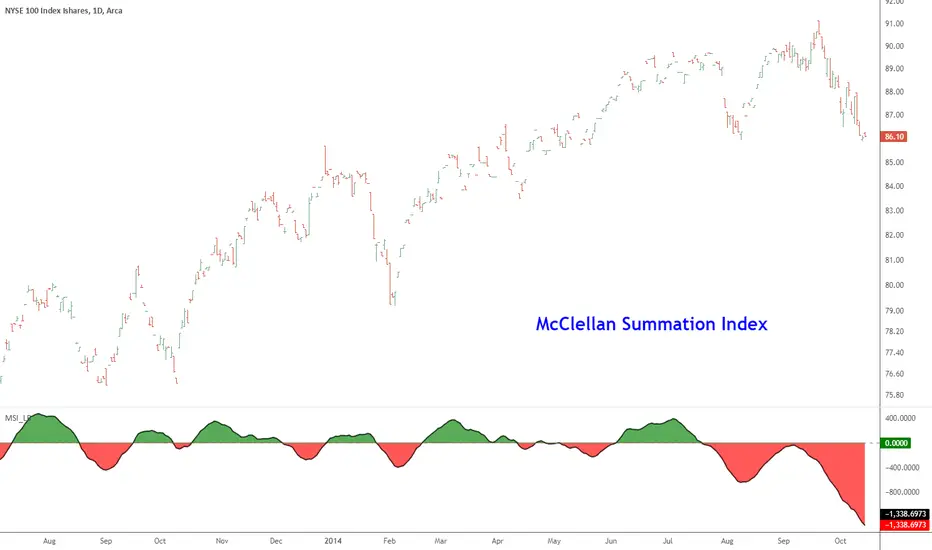
McClellan Summation Index is a breadth indicator derived from McClellan Oscillator (tradingview.com/v/8YstxIAf/).
The Summation Index is simply a running total of the McClellan Oscillator values. Even though it is called a Summation Index, the indicator is really an oscillator that fluctuates above/below zero. As such, signals can be derived from bullish/bearish divergences, directional movement and centerline crossovers. A moving average can also be applied to identify upturns and downturns.
Indicator uses the advancing/declining stocks from NYSE by default, but you can change them to any market in the options dialog.
More info:
- mcoscillator.com/learning_center/kb/mcclellan_oscillator/the_mcclellan_oscillator_summation_index/
- stockcharts.com/school/doku.php?id=chart_school:technical_indicators:mcclellan_summation
Complete list of my indicators:
docs.google.com/document/d/15AGCufJZ8CIUvwFJ9W-IKns88gkWOKBCvByMEvm5MLo/edit?usp=sharing
Script open-source
In pieno spirito TradingView, il creatore di questo script lo ha reso open-source, in modo che i trader possano esaminarlo e verificarne la funzionalità. Complimenti all'autore! Sebbene sia possibile utilizzarlo gratuitamente, ricorda che la ripubblicazione del codice è soggetta al nostro Regolamento.
List of my free indicators: bit.ly/1LQaPK8
List of my indicators at Appstore: blog.tradingview.com/?p=970
List of my indicators at Appstore: blog.tradingview.com/?p=970
Declinazione di responsabilità
Le informazioni ed i contenuti pubblicati non costituiscono in alcun modo una sollecitazione ad investire o ad operare nei mercati finanziari. Non sono inoltre fornite o supportate da TradingView. Maggiori dettagli nelle Condizioni d'uso.