OPEN-SOURCE SCRIPT
Aggiornato [blackcat] L1 Wave Oscillator
Level: 1
Background
GET wave theory indicator series contain a indicator called wave oscillator.
Function
This is a modified version of GET wave oscillator with enhanced moving averages which alleviate lag issue to some degree. The feature of it is that it includes overbought and oversold band with dynamic values for indications. Labels and alerts are added.
Key Signal
osc --> wave oscillator output
Remarks
This is a Level 1 free and open source indicator.
Feedbacks are appreciated.
Note di rilascio
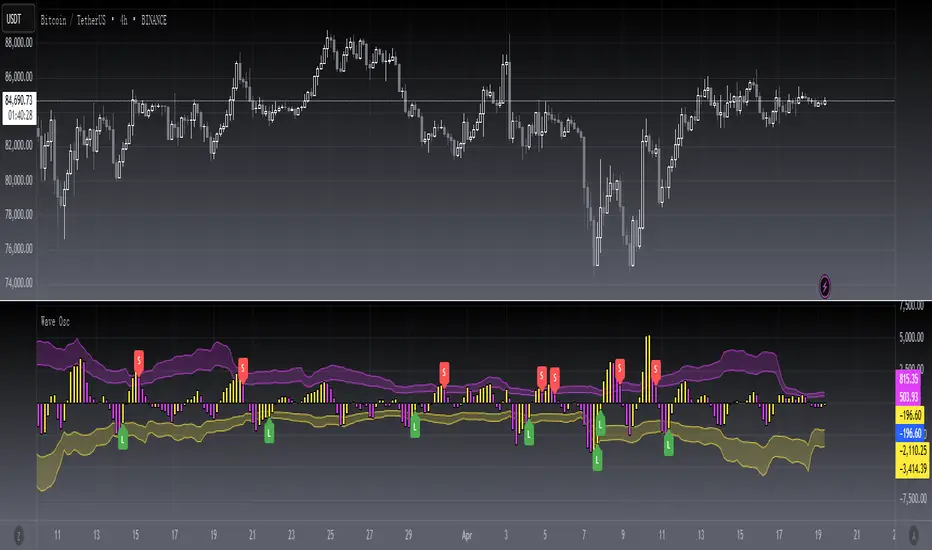
OVERVIEWThe [blackcat] L1 Wave Oscillator indicator is designed to help traders visualize market momentum through oscillatory movements. It leverages Hull Moving Averages (HMAs) and Volume Weighted Moving Averages (VWMAs) to generate signals for potential buying and selling opportunities. The oscillator plots candlesticks representing upward and downward price movements, along with overbought and oversold bands to indicate extreme conditions. This tool can be particularly useful for identifying trend reversals and confirming market trends 📈🔍.
FEATURES
Customizable Periods: Adjustable short and long periods for HMAs to fit various trading strategies.
Volume Weighted MAs: Incorporates volume data to enhance signal reliability.
Overbought/Oversold Bands: Visual indicators for extreme market conditions using fuchsia and yellow colors.
Candlestick Plotting: Dynamic plotting of wave oscillations with distinct colors for bullish and bearish moves.
Buy/Sell Signals: Clear labels and alerts for actionable trade entries based on defined conditions.
HOW TO USE
Input Settings:
Set the desired values for the short period and long period inputs according to your trading preferences.
Interpreting the Oscillator:
Observe the plotted candlesticks: green indicates bullish movement, while red signifies bearish movement.
Monitor the overbought band (fuchsia) and oversold band (yellow) for potential reversal points.
Generating Trade Signals:
Look for buy signals when the oscillator crosses above the oversold band and vice versa for sell signals.
Utilize the generated labels ("L" for Long/Buy, "S" for Short/Sell) and set alerts accordingly.
LIMITATIONS
The effectiveness of this indicator may vary depending on market conditions and asset types.
Always combine it with other technical analysis tools for more robust decision-making.
NOTES
Ensure that the selected periods align with your specific trading strategy and timeframe.
Regularly review and adjust settings to adapt to changing market dynamics.
Script open-source
Nello spirito di TradingView, l'autore di questo script lo ha reso open source, in modo che i trader possano esaminarne e verificarne la funzionalità. Complimenti all'autore! Sebbene sia possibile utilizzarlo gratuitamente, ricordiamo che la ripubblicazione del codice è soggetta al nostro Regolamento.
Avoid losing contact!Don't miss out! The first and most important thing to do is to join my Discord chat now! Click here to start your adventure: discord.com/invite/ZTGpQJq 防止失联,请立即行动,加入本猫聊天群: discord.com/invite/ZTGpQJq
Declinazione di responsabilità
Le informazioni e le pubblicazioni non sono intese come, e non costituiscono, consulenza o raccomandazioni finanziarie, di investimento, di trading o di altro tipo fornite o approvate da TradingView. Per ulteriori informazioni, consultare i Termini di utilizzo.