OPEN-SOURCE SCRIPT
Technical Strength Index (TSI)
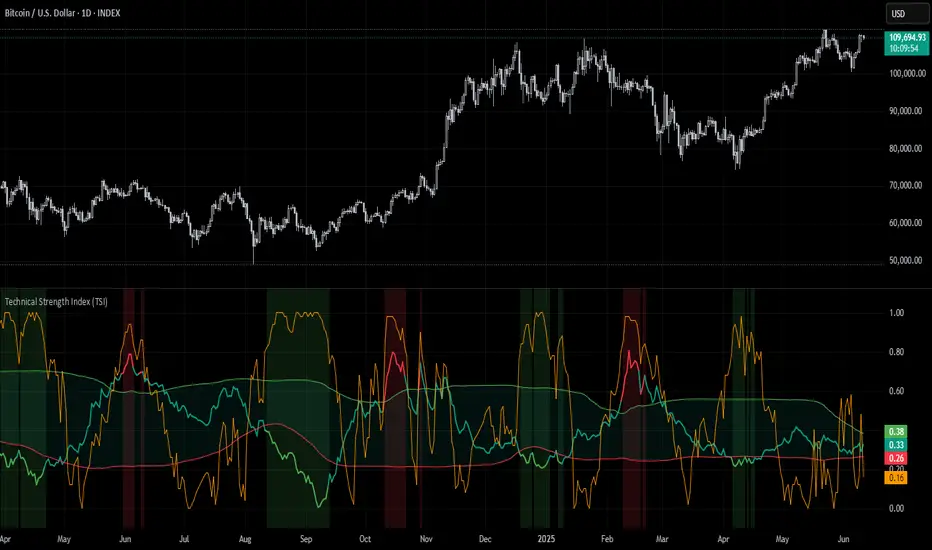
📘 TSI with Dynamic Bands – Technical Strength Index
The TSI with Dynamic Bands is a multi-factor indicator designed to measure the statistical strength and structure of a trend. It combines several quantitative metrics into a single, normalized score between 0 and 1, allowing traders to assess the technical quality of market moves and detect overbought/oversold conditions with adaptive precision.
🧠 Core Components
This indicator draws from the StatMetrics library, blending:
📈 Trend Persistence: via the Hurst exponent, indicating whether price action is mean-reverting or trending.
📉 Risk-Adjusted Volatility: via the inverted [Coefficient of Variation (CV)], rewarding smoother, less erratic price movement.
🚀 Momentum Strength: using a combination of directional momentum and Z-score–normalized returns.
These components are normalized and averaged into the TSI line.
🎯 Features
TSI Line: Composite score of trend quality (0 = weak/noise, 1 = strong/structured).
Dynamic Bands: Mean ± 1 standard deviation envelopes provide adaptive context.
Overbought/Oversold Detection: Based on a rolling quantile (e.g. 90th/10th percentile of TSI history).
Signal Strength Bar (optional): Measures how statistically extreme the current TSI value is, helping validate confidence in trade setups.
Dynamic Color Cues: Background and bar gradients help visually identify statistically significant zones.
📈 How to Use
Look for overbought (red background) or oversold (green background) conditions as potential reversal zones.
Confirm trend strength with the optional signal strength bar — stronger values suggest higher signal confidence.
Use the TSI line and context bands to filter out noisy ranges and focus on structured price moves.
⚙️ Inputs
Lookback Period: Controls the smoothing and window size for statistical calculations.
Overbought/Oversold Quantiles: Adjust the thresholds for signal zones.
Plot Signal Strength: Enable or disable the signal confidence bar.
Overlay Signal Strength: Show signal strength in the same panel (compact) or not (cleaner TSI-only view).
🛠 Example Use Cases
Mean reversion traders identifying reversal zones with statistical backing
Momentum/Trend traders confirming structure before entries
Quantitative dashboards or multi-asset screening tools
⚠️ Disclaimer
This script is for educational and informational purposes only. It does not constitute financial advice or a recommendation to buy or sell any financial instrument.
This AI is not a financial advisor; please consult your financial advisor for personalized advice.
Script open-source
Nello spirito di TradingView, l'autore di questo script lo ha reso open source, in modo che i trader possano esaminarne e verificarne la funzionalità. Complimenti all'autore! Sebbene sia possibile utilizzarlo gratuitamente, ricordiamo che la ripubblicazione del codice è soggetta al nostro Regolamento.
Declinazione di responsabilità
Le informazioni e le pubblicazioni non sono intese come, e non costituiscono, consulenza o raccomandazioni finanziarie, di investimento, di trading o di altro tipo fornite o approvate da TradingView. Per ulteriori informazioni, consultare i Termini di utilizzo.