CandelaCharts - Dip Index
The Dip Index (DIPX) is a market breadth oscillator designed to identify market dips by measuring the percentage of assets within a chosen index or asset class that are trading above a specified moving average (such as the 50, 100, 150, or 200-period).
By highlighting when fewer assets remain above their averages, DIPX helps traders detect potential dip opportunities and assess overall market strength or weakness.
While commonly applied to equities, the indicator is adaptable to various financial instruments, including exchange-traded funds (ETFs), commodities, cryptocurrencies, and even fixed-income securities.
- Assess the overall health of a market by measuring internal participation in price moves.
- Detect overbought or oversold conditions when momentum becomes concentrated or overly extended.
- Generate actionable signals when the index exits extreme levels, suggesting renewed momentum or potential exhaustion.
📦 Features
- Multiple Indices: Supports SP500, Nasdaq, DJI, Russel2000, and sector-specific S&P indices.
- Dynamic MA Selection: Choose from SMA, EMA, RMA, WMA, VWMA with configurable lengths.
- Visual Customization: Full control over colors, line styles, text size, and branding.
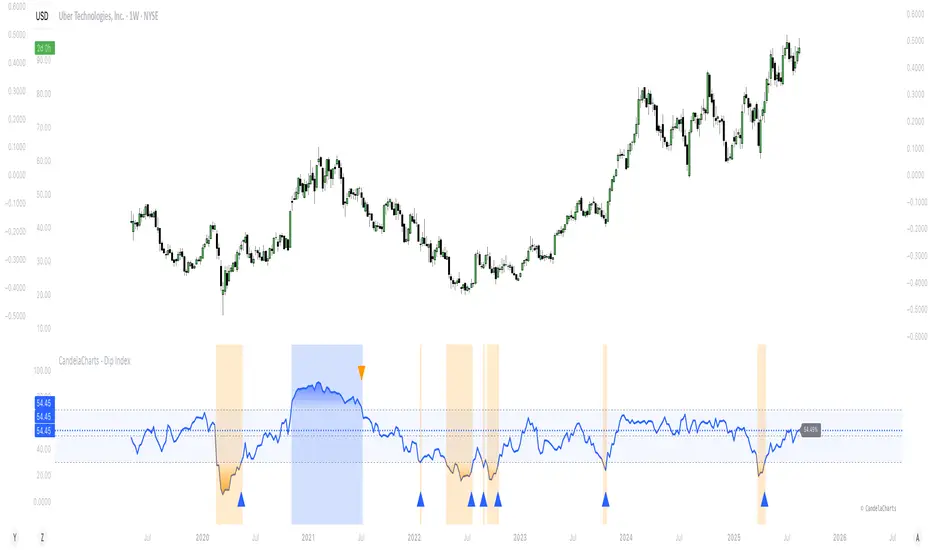
- Signal Markers: Triangle markers appear when exiting overbought/oversold zones.
- Gradient & Background Fill: Visual highlighting of extreme market conditions.
- Overlay Mode Option: Can display OB/OS background as chart overlay.
⚙️ Settings
- Market: Chooses the index or asset class to measure.
- MA: Enables moving average filter; options include type (SMA, EMA, etc.) and period length.
- Oversold: Defines the lower threshold (default: 20) with customizable color.
- Overbought: Defines the upper threshold (default: 80) with customizable color.
- DIPX Line: Sets the thickness and color of the Dip Index line.
- Mode: Selects display type (Line, Cross, Circle, Stepline, etc.).
- Signals: Toggles buy/sell signal markers with customizable colors.
- OB/OS Zones: Enables highlighting of Overbought/Oversold zones.
- OB/OS Overlay: Toggles overlay shading for Overbought/Oversold zones.
⚡️ Showcase
Overbought/Oversold
Modes
Overbought/Oversold Zones
Signals
Overlay
📒 Usage
How to use DIPX effectively in trading and analysis, including interpretation, signal usage, strategic applications, and best practices.
DIPX outputs values from 0% to 100%, reflecting how widely participation extends across the underlying assets in an index or basket.
1. Assessing Market Health
Use DIPX to evaluate whether price moves are supported by broad participation:
- In a bull trend, confirm strength by checking if DIPX stays above 50%.
- In a bear trend, watch for rebounds in DIPX to spot temporary relief rallies.
2. Detecting Divergences
Divergence occurs when the price trend and DIPX trend disagree — often a precursor to reversal.
- Bearish Divergence: Price makes higher highs; DIPX makes lower highs -> Momentum weakening - potential top
- Bullish Divergence: Price makes lower lows; DIPX makes higher lows -> Selling pressure fading - potential bottom
How to Spot It:
- Overlay DIPX on the same chart as the index price.
- Use trendlines or horizontal markers to compare swing points.
- Focus on weekly or daily timeframes for reliability.
3. Signal-Based Entries/Exits
When enabled (Signals = true), DIPX generates triangle markers when exiting extreme zones:
- Bullish Triangle (▲): DIPX crosses above Oversold Value (e.g., 20%, 30%) -> Green upward triangle
- Bearish Triangle (▼): DIPX crosses below Overbought Value (e.g., 80%, 70%) -> Red downward triangle
4. Timeframe Guidance
- 1m – 4h: ❌ Not Recommended - DIPX uses daily-aggregated data;
- Daily (D): ✅ Strongly Recommended - Matches data frequency; clearest signals
- Weekly (W): ✅ Acceptable - Ideal for macro analysis and long-term positioning
- Monthly (M): ⚠️ Limited Use - Too slow for active trading; useful for big-picture context
By integrating DIPX into your analysis, you gain a powerful lens into market internals — helping you distinguish between broad-based strength and narrow leadership, regardless of asset class.
🚨 Alerts
The indicator does not provide any alerts!
⚠️ Disclaimer
These tools are exclusively available on the TradingView platform.
Our charting tools are intended solely for informational and educational purposes and should not be regarded as financial, investment, or trading advice. They are not designed to predict market movements or offer specific recommendations. Users should be aware that past performance is not indicative of future results and should not rely on these tools for financial decisions. By using these charting tools, the purchaser agrees that the seller and creator hold no responsibility for any decisions made based on information provided by the tools. The purchaser assumes full responsibility and liability for any actions taken and their consequences, including potential financial losses or investment outcomes that may result from the use of these products.
By purchasing, the customer acknowledges and accepts that neither the seller nor the creator is liable for any undesired outcomes stemming from the development, sale, or use of these products. Additionally, the purchaser agrees to indemnify the seller from any liability. If invited through the Friends and Family Program, the purchaser understands that any provided discount code applies only to the initial purchase of Candela's subscription. The purchaser is responsible for canceling or requesting cancellation of their subscription if they choose not to continue at the full retail price. In the event the purchaser no longer wishes to use the products, they must unsubscribe from the membership service, if applicable.
We do not offer reimbursements, refunds, or chargebacks. Once these Terms are accepted at the time of purchase, no reimbursements, refunds, or chargebacks will be issued under any circumstances.
By continuing to use these charting tools, the user confirms their understanding and acceptance of these Terms as outlined in this disclaimer.
Script su invito
Solo gli utenti approvati dall'autore possono accedere a questo script. È necessario richiedere e ottenere l'autorizzazione per utilizzarlo. Tale autorizzazione viene solitamente concessa dopo il pagamento. Per ulteriori dettagli, seguire le istruzioni dell'autore riportate di seguito o contattare direttamente CandelaCharts.
TradingView NON consiglia di acquistare o utilizzare uno script a meno che non si abbia piena fiducia nel suo autore e se ne comprenda il funzionamento. È inoltre possibile trovare alternative gratuite e open source nei nostri script della community.
Istruzioni dell'autore
Join our community: discord.gg/etGSTepqbu
All content provided by CandelaCharts is for informational & educational purposes only.
Declinazione di responsabilità
Script su invito
Solo gli utenti approvati dall'autore possono accedere a questo script. È necessario richiedere e ottenere l'autorizzazione per utilizzarlo. Tale autorizzazione viene solitamente concessa dopo il pagamento. Per ulteriori dettagli, seguire le istruzioni dell'autore riportate di seguito o contattare direttamente CandelaCharts.
TradingView NON consiglia di acquistare o utilizzare uno script a meno che non si abbia piena fiducia nel suo autore e se ne comprenda il funzionamento. È inoltre possibile trovare alternative gratuite e open source nei nostri script della community.
Istruzioni dell'autore
Join our community: discord.gg/etGSTepqbu
All content provided by CandelaCharts is for informational & educational purposes only.