Sessions on Chart
Looking back on charts it can help to spot certain moves or patterns around certain Session open when high volumes enter the markets.
- Tokyo Session
- the background is colored for each session between highs and lows of timeframe chosen (D, W, M).
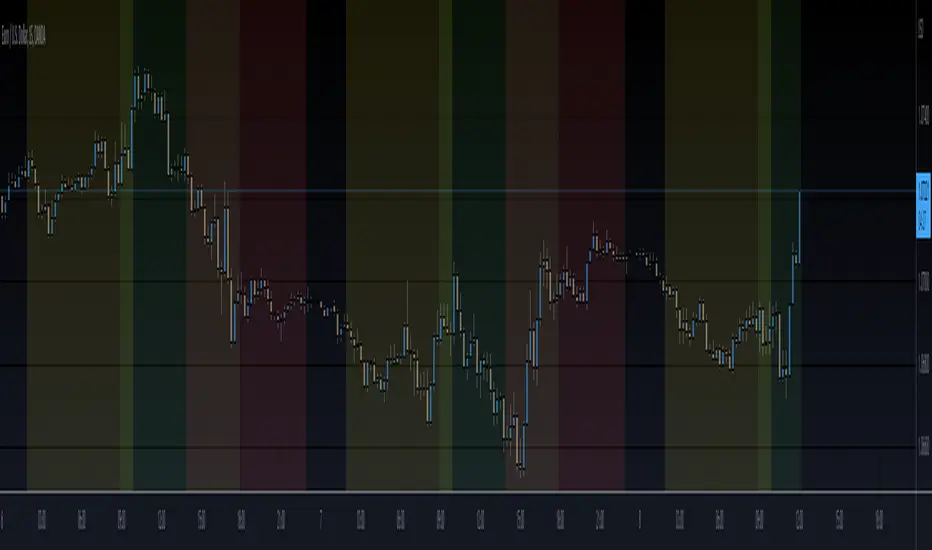
Examples of this indicator calculated with highs and lows for each session on daily, weekly and monthly basis, respectively:
https://www.tradingview.com/x/Spo0RHf1/
https://www.tradingview.com/x/cY1IHCdd/
https://www.tradingview.com/x/rcEMwBWN/
View only of the sessions with highs and lows calculated on daily timeframe:
https://www.tradingview.com/x/dzDCE3Hd/
Hope you enjoy the update!
- Tokyo Session
- the background is colored for each session between highs and lows of timeframe chosen (D, W, M).
- The new features with highs and lows can be activated in the settings.
- The new features with highs and lows can be activated in the settings.
- Manage the plotted sessions by ticking in the settings.
- Sydney session added as well.
- Manage the plotted sessions by ticking in the settings.
- Aussie session added as well.
- Solved the issue of Timezone Differences
Script open-source
In pieno spirito TradingView, il creatore di questo script lo ha reso open-source, in modo che i trader possano esaminarlo e verificarne la funzionalità. Complimenti all'autore! Sebbene sia possibile utilizzarlo gratuitamente, ricorda che la ripubblicazione del codice è soggetta al nostro Regolamento.
Per un accesso rapido a un grafico, aggiungi questo script ai tuoi preferiti: per saperne di più clicca qui.
Declinazione di responsabilità
Script open-source
In pieno spirito TradingView, il creatore di questo script lo ha reso open-source, in modo che i trader possano esaminarlo e verificarne la funzionalità. Complimenti all'autore! Sebbene sia possibile utilizzarlo gratuitamente, ricorda che la ripubblicazione del codice è soggetta al nostro Regolamento.
Per un accesso rapido a un grafico, aggiungi questo script ai tuoi preferiti: per saperne di più clicca qui.