OPEN-SOURCE SCRIPT
Action Trend Line
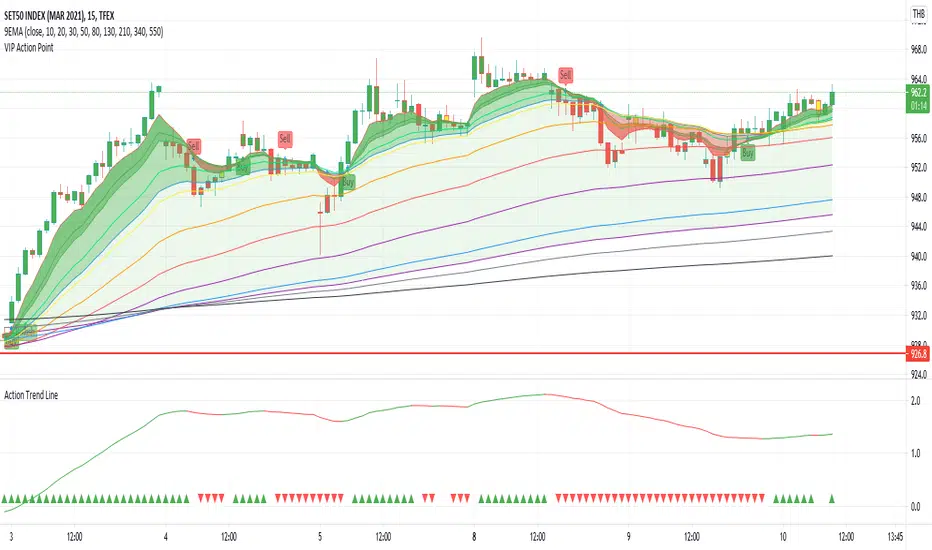
Action Trend Line is different of Moving Average between ema26 and ema260
My idea is, if ema26 drop to ema260 means downtrend
if ema26 increase or moving out of ema260 means uptrend
then writting a different line by 100 scale to be clear vision
at the bottom have plot sign up and down for each candle, it is status information
The chart show Action Trend Line, by 2 color and 2 sign at the bottom of chart.
If the line is growing up then color is green. you could know that is uptrend.
If the line is going down then color is red. you could know that is downtrend.
The triangle sign at the bottom of chart show trend folowing.
If previous and this line are uptrend, the triangle up and green color.
If previous and this line are downtrend, the triangle down and redcolor.
otherwise, the trend going to change it dosen't plot any sign, you cloud know warning the trend going to be change.
Must try and make you clearly understand.
Script open-source
Nello spirito di TradingView, l'autore di questo script lo ha reso open source, in modo che i trader possano esaminarne e verificarne la funzionalità. Complimenti all'autore! Sebbene sia possibile utilizzarlo gratuitamente, ricordiamo che la ripubblicazione del codice è soggetta al nostro Regolamento.
Declinazione di responsabilità
Le informazioni e le pubblicazioni non sono intese come, e non costituiscono, consulenza o raccomandazioni finanziarie, di investimento, di trading o di altro tipo fornite o approvate da TradingView. Per ulteriori informazioni, consultare i Termini di utilizzo.