OPEN-SOURCE SCRIPT
Aggiornato S&P Sector Advance/Decline Weighted -Tom1trader
Enjoy, enhance your trading (I hope), copy or adapt to your needs and keep smiling!
Thanks to @MartinShkreli. The sector variables and the "repaint" option (approx lines 20 through 32 of this script) are used directly from your script "Sectors"
RECOMMENDATION: Update the sector weightings -inputs are provided. They change as often as monthly and the
annual changes are certainly significant. When updating weighting percentages use the decimal value. I.E. 29% is .29
Good on any time frame. Especially SPY, SPX and ES scalpers and 0DTE options traders may like this a lot.
This gives good signals on S & P and related (ES, SPY) and indicates / plots differently than the AD line or ratio.
Each sector's entire % weight is added or subtracted depending of whether that sector advanced or declined.
Example: Information Tech weight at 29% so that % of 500 (145) is added if InfoTech is up a penny and subtracted if it is
down a penny. All sectors processed the same way so that for a given bar/candle the value will be between +500 (all
sectors up) and -500 (all sectors down). This weighted AD line of sectors is scaled to +/- 350 and plotted as a red/green line
along with aqua/fuchsia columns of its 5 period ema. The line is actual sector behavior and the columns seem to make a
good signal with column zero crosses standing out.
The columns aqua / fuchsia are a 5 period ema of the Sector AD line and give pretty good signals at
zero cross for SPX. I colored the AD red green line also to emphasize the times it opposes the ema
for example the histo/colums zero cross signal is NOT true when the AD line is showing all or most sectors
going the other way.
For readability, the AD line itself is scaled to 350. This lets the columns of the ema stand out better. The hlines at
350 and at 175 give an idea for the AD green red line how much of the sector's weight is up or down.
350 is all sectors up (advancing) and -350 is all sectors down (declining). The hlines at +/- 175 seem to outline
a more or less "neutral" zone. For example in an uptrend with most of the AD level positive and the columns positive;
a negative spike that does not pass the -175 line and returns positive does not seem to impact the price as much as
a deeper negative spike.
Note di rilascio
Thanks to @MartinShkreli. The sector function, variables & "repaint" (approx lines 28 through 43 of this script)are used directly from your script "Sectors"
RECOMMENDATION: Update the sector weightings -inputs are provided. They change as often as monthly and the
annual changes are certainly significant.
When updating weighting percentages use the decimal value. I.E. 29% is .29
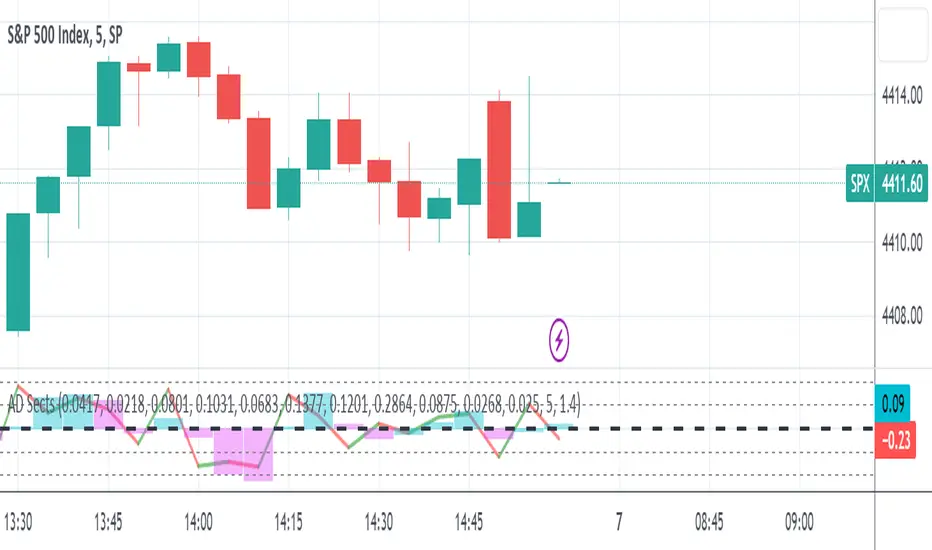
All sectors advanced is line at +1 and declined at -1
Line values between +/- 1 represent percentage of sector weight that advanced or declined
The weight (%[as decimal] S&P mkt cap) is added if advances or subtracted if declines
i.e infotech sector was 26% of S&P when I did this so .26 added/subtracted when advance/decline.
The columns aqua fuchsia are a 5 period Hull Moving Average [changed from EMA]
Zero Cross of this histo/columns give pretty good signals for S&P.
Above/below zero track pretty well as price rising/falling.
The space between plus 0.5 and minus 0.5 is more neutral such that
when histo is between them price is rising or falling more slowly
or price is ranging when histo straddles back and forth + and -.
I colored the AD line also to emphasize the times it opposes the histo.
--New version changes: [2-21-22]
- EMA to Hull Moving Average
- Scaling to +/- 1 simplifies code and inputs
- Choice of plot multiple for histo readability (1x-2x in 0.1 steps)
- Cleaned up and clarified description
Note di rilascio
Updated the sector weightings per Yahoo Finance, link in description. The original source of the weightings no longer posts them on their web site so changed to Yahoo's. Changed input dialogue on Consumer Staples and Discretionary to show that discretionary is also cyclical and stapes is also defensive. If you update with the inputs provided it is clear when yahoo says only cyclical it is the same as discretionary and same with defensive/staples.Script open-source
Nello spirito di TradingView, l'autore di questo script lo ha reso open source, in modo che i trader possano esaminarne e verificarne la funzionalità. Complimenti all'autore! Sebbene sia possibile utilizzarlo gratuitamente, ricordiamo che la ripubblicazione del codice è soggetta al nostro Regolamento.
Declinazione di responsabilità
Le informazioni e le pubblicazioni non sono intese come, e non costituiscono, consulenza o raccomandazioni finanziarie, di investimento, di trading o di altro tipo fornite o approvate da TradingView. Per ulteriori informazioni, consultare i Termini di utilizzo.
Script open-source
Nello spirito di TradingView, l'autore di questo script lo ha reso open source, in modo che i trader possano esaminarne e verificarne la funzionalità. Complimenti all'autore! Sebbene sia possibile utilizzarlo gratuitamente, ricordiamo che la ripubblicazione del codice è soggetta al nostro Regolamento.
Declinazione di responsabilità
Le informazioni e le pubblicazioni non sono intese come, e non costituiscono, consulenza o raccomandazioni finanziarie, di investimento, di trading o di altro tipo fornite o approvate da TradingView. Per ulteriori informazioni, consultare i Termini di utilizzo.