OPEN-SOURCE SCRIPT
RSI Curl Signals 70 / 60 / 40
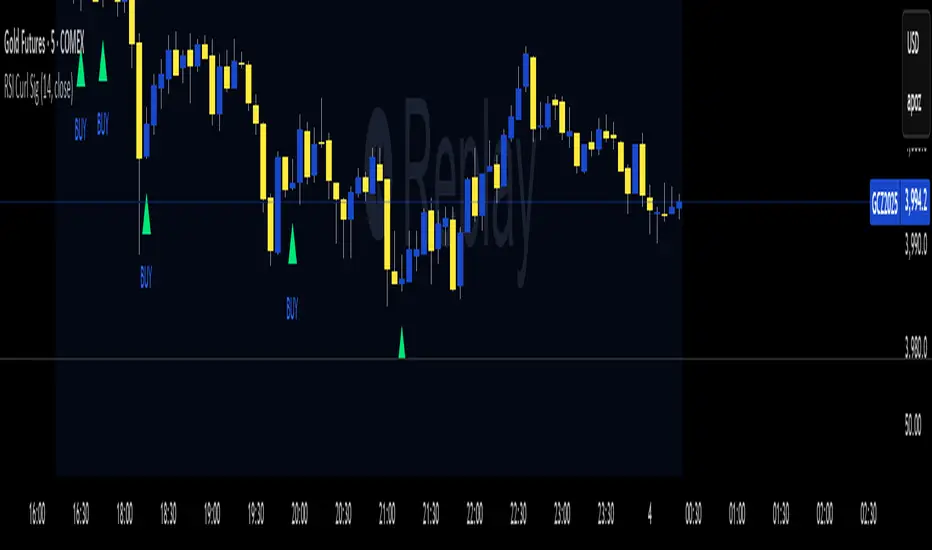
This Indicator Identifies the turning points on the RSI and plots a buy and sell signal on the chart It plots on crossing up above the 41 Level on the RSI and plots a sell curling below the 60 level use a standard RSI on chart if needed with alerts set at RSI curling up above value 40 Level and use an alert for curling below Level 60 use support and resistance for confirmation
Works with any timeframe Ans any asset
Works with any timeframe Ans any asset
Script open-source
In pieno spirito TradingView, il creatore di questo script lo ha reso open-source, in modo che i trader possano esaminarlo e verificarne la funzionalità. Complimenti all'autore! Sebbene sia possibile utilizzarlo gratuitamente, ricorda che la ripubblicazione del codice è soggetta al nostro Regolamento.
Declinazione di responsabilità
Le informazioni ed i contenuti pubblicati non costituiscono in alcun modo una sollecitazione ad investire o ad operare nei mercati finanziari. Non sono inoltre fornite o supportate da TradingView. Maggiori dettagli nelle Condizioni d'uso.