OPEN-SOURCE SCRIPT
Aggiornato Realized Volatility (StdDev of Returns, %)

📌 Realized Volatility (StdDev of Returns, %)
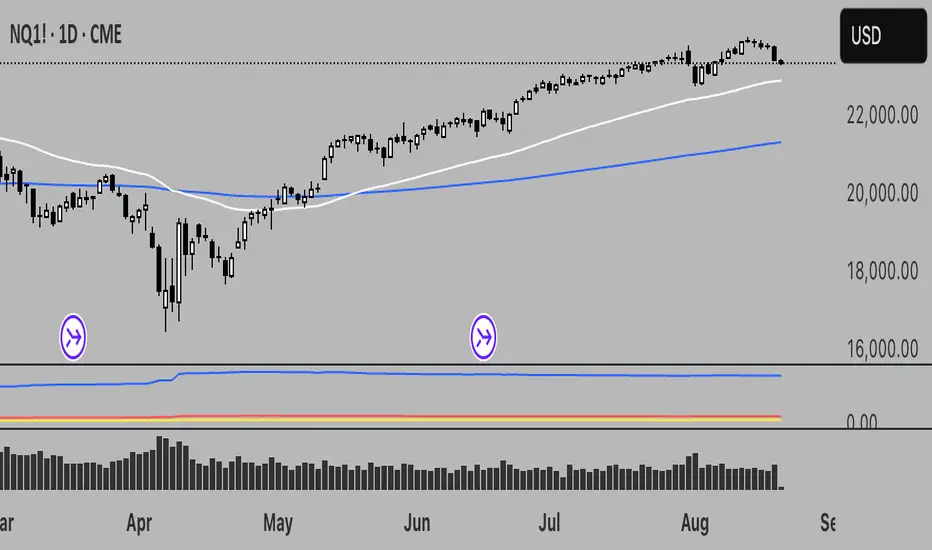
This indicator measures realized volatility directly from price returns, instead of the common but misleading approach of calculating standard deviation around a moving average.
🔹 How it works:
Computes close-to-close log returns (the most common way volatility is measured in finance).
Calculates the standard deviation of these returns over a chosen lookback period (default = 200 bars).
Converts results into percentages for easier interpretation.
Provides three key volatility measures:
Daily Realized Vol (%) – raw standard deviation of returns.
Annualized Vol (%) – scaled by √250 trading days (market convention).
Horizon Vol (%) – volatility over a custom horizon (default = 5 days, i.e. weekly).
🔹 Why use this indicator?
Shows true realized volatility from historical returns.
More accurate than measuring deviation around a moving average.
Useful for traders analyzing risk, position sizing, and comparing realized vs implied volatility.
⚠️ Note:
It is best used on the Daily Chart!
By default, this uses log returns (which are additive and standard in quant finance).
If you prefer, you can easily switch to simple % returns in the code.
Volatility estimates depend on your chosen lookback length and may vary across timeframes.
Note di rilascio
Realized Volatility (StdDev of Returns, %)This indicator measures realized volatility directly from price returns, instead of the common but misleading approach of calculating standard deviation around a moving average.
🔹 How it works:
Computes close-to-close log returns (the most common way volatility is measured in finance).
Calculates the standard deviation of these returns over a chosen lookback period (default = 200 bars).
Converts results into percentages for easier interpretation.
Provides three key volatility measures:
Daily Realized Vol (%) – raw standard deviation of returns.
Annualized Vol (%) – scaled by √252 trading days (market convention).
Horizon Vol (%) – volatility over a custom horizon (default = 5 days, i.e. weekly).
🔹 Why use this indicator?
Shows true realized volatility from historical returns.
More accurate than measuring deviation around a moving average.
Useful for traders analyzing risk, position sizing, and comparing realized vs implied volatility.
⚠️ Note:
By default, this uses log returns, which are additive and standard in quant finance.
If you prefer, you can easily switch to simple % returns in the code.
Volatility estimates depend on your chosen lookback length and may vary across timeframes.
Script open-source
Nello spirito di TradingView, l'autore di questo script lo ha reso open source, in modo che i trader possano esaminarne e verificarne la funzionalità. Complimenti all'autore! Sebbene sia possibile utilizzarlo gratuitamente, ricordiamo che la ripubblicazione del codice è soggetta al nostro Regolamento.
Declinazione di responsabilità
Le informazioni e le pubblicazioni non sono intese come, e non costituiscono, consulenza o raccomandazioni finanziarie, di investimento, di trading o di altro tipo fornite o approvate da TradingView. Per ulteriori informazioni, consultare i Termini di utilizzo.