OPEN-SOURCE SCRIPT
MACD on RSI
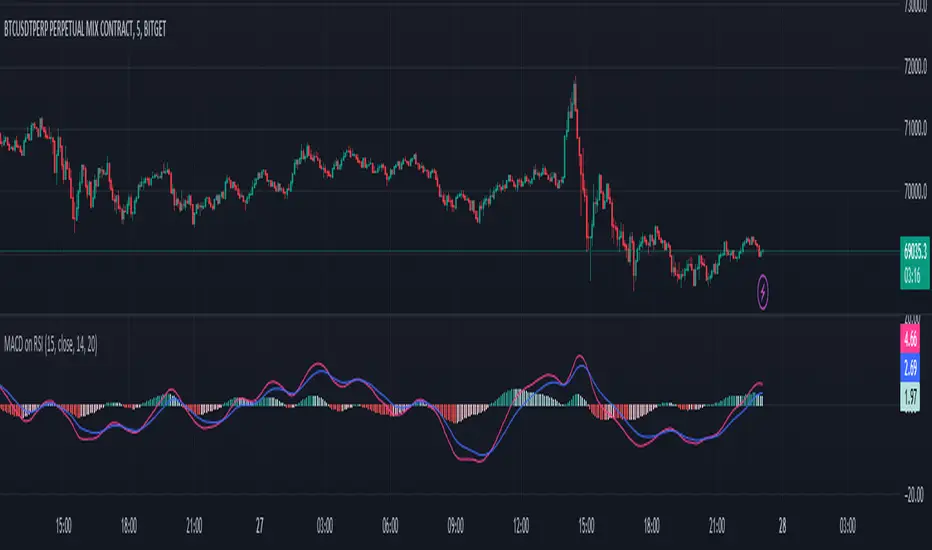
The MACD on RSI indicator combines elements of the Moving Average Convergence Divergence (MACD) and the Relative Strength Index (RSI). It calculates the RSI on a specified source with a customizable length, then applies two exponential moving averages (EMAs) to the RSI values. The difference between these EMAs forms the MACD line, visually representing the momentum of the RSI.
Script open-source
Nello spirito di TradingView, l'autore di questo script lo ha reso open source, in modo che i trader possano esaminarne e verificarne la funzionalità. Complimenti all'autore! Sebbene sia possibile utilizzarlo gratuitamente, ricordiamo che la ripubblicazione del codice è soggetta al nostro Regolamento.
Declinazione di responsabilità
Le informazioni e le pubblicazioni non sono intese come, e non costituiscono, consulenza o raccomandazioni finanziarie, di investimento, di trading o di altro tipo fornite o approvate da TradingView. Per ulteriori informazioni, consultare i Termini di utilizzo.