OPEN-SOURCE SCRIPT
AnyTimeAndPrice

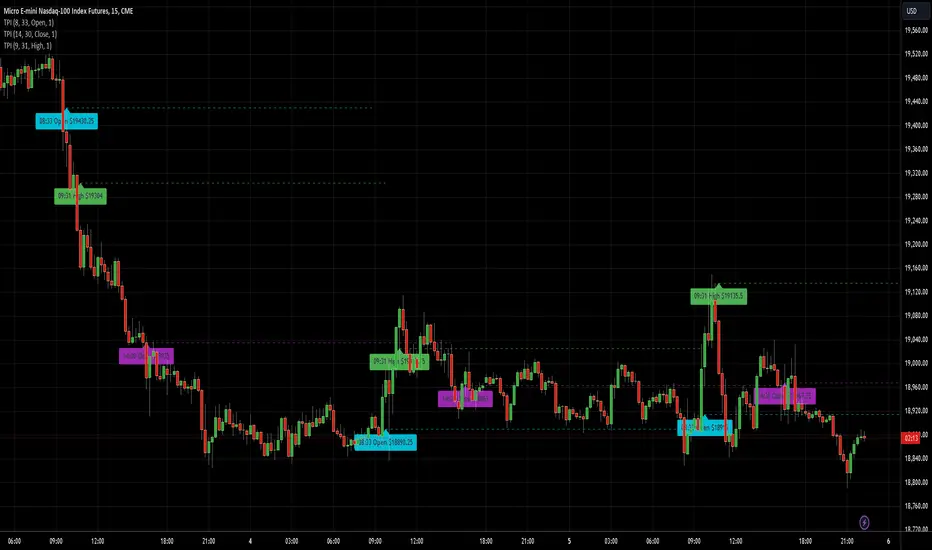
This indicator allows users to input a specific start time and display the price of a lower timeframe on a higher timeframe chart. It offers customization options for:
- Display name
- Label color
- Line extension
By adding multiple instances of the AnyTimeframeTimeAndPrice indicator, each customized for different times and prices, you can create a powerful and flexible tool for analyzing market data. Here's a potential setup:
1. Instance 1:
- Time: 08:23
- Price: Open
- Display Name: "8:23 Open"
- Label Color: Green
2. Instance 2:
- Time: 12:47
- Price: High
- Display Name: "12:47 High"
- Label Color: Red
3. Instance 3:
- Time: 15:19
- Price: Low
- Display Name: "3:19 Low"
- Label Color: Blue
4. Instance 4:
- Time: 16:53
- Price: Close
- Display Name: "4:53 Close"
- Label Color: Yellow
By having multiple instances, you can:
- Track different times and prices on the same chart
- Customize the display names, label colors, and line extensions for each instance
- Easily compare and analyze the relationships between different times and prices
This setup can be particularly useful for:
- Identifying key levels and support/resistance areas
- Analyzing market trends and patterns
- Making more informed trading decisions
Inputs:
1. AnyStartHour: Integer input for the start hour (default: 09, range: 0-23)
2. AnyStartMinute: Integer input for the start minute (default: 30, range: 0-59)
3. Sourcename: String input for the display name (default: "Open", options: "Open", "Close", "High", "Low")
4. Src_col: Color input for the label color (default: aqua)
5. linetimeExtMulti: Integer input for the line time extension (default: 1, range: 1-5)
Calculations:
1. AnyinputStartTime: Timestamp for the input start time
2. inputhour and inputminute: Hour and minute components of the input start time
3. formattedAnyTime: Formatted string for the input start time (HH:mm)
4. currenttime: Current timestamp
5. currenthour and currentminute: Hour and minute components of the current time
6. formattedTime: Formatted string for the current time (HH:mm)
7. onTime and okTime: Boolean flags for checking if the current time matches the input start time or is within the session
8. firstbartime: Timestamp for the first bar of the session
9. dailyminutesfromSource: Calculation for the daily minutes from the source
10. anyminSrcArray: Request security lower timeframe array for the source
11. ltf (lower timeframe): Integer variable for tracking the lower timeframe
12. Sourcevalue: Float variable for storing the source value
13. linetimeExt: Integer variable for line extension (calculated from linetimeExtMulti)
Logic:
1. Check if the current time matches the input start time or is within the session
2. If true, plot a line and label with the source value and formatted time
3. If not, check if the current time is within the daily session and plot a line and label accordingly
Notes:
- The script uses request.security_lower_tf to request data from a lower timeframe
- The script uses line.new and label.new to plot lines and labels on the chart
- The script uses str.format_time to format timestamps as strings (HH:mm)
- The script uses xloc.bar_time to position lines and labels at the bar time
This script allows users to input a specific start time and display the price of a lower timeframe on a higher timeframe chart, with options for customizing the display name, label color, and line extension.
Script open-source
Nello spirito di TradingView, l'autore di questo script lo ha reso open source, in modo che i trader possano esaminarne e verificarne la funzionalità. Complimenti all'autore! Sebbene sia possibile utilizzarlo gratuitamente, ricordiamo che la ripubblicazione del codice è soggetta al nostro Regolamento.
Declinazione di responsabilità
Le informazioni e le pubblicazioni non sono intese come, e non costituiscono, consulenza o raccomandazioni finanziarie, di investimento, di trading o di altro tipo fornite o approvate da TradingView. Per ulteriori informazioni, consultare i Termini di utilizzo.