OPEN-SOURCE SCRIPT
Market Flow Volatility Oscillator (AiBitcoinTrend)
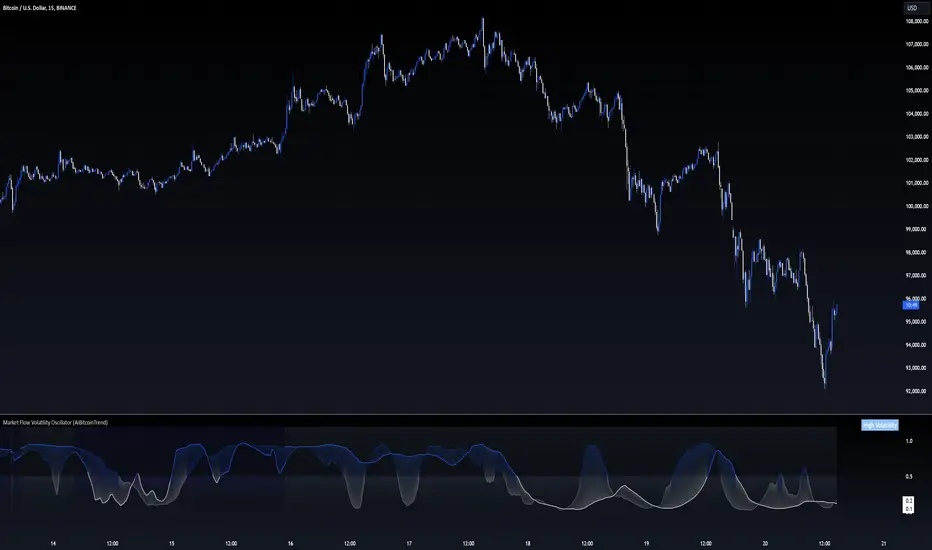
The Market Flow Volatility Oscillator (AiBitcoinTrend) is a cutting-edge technical analysis tool designed to evaluate and classify market volatility regimes. By leveraging Gaussian filtering and clustering techniques, this indicator provides traders with clear insights into periods of high and low volatility, helping them adapt their strategies to evolving market conditions. Built for precision and clarity, it combines advanced mathematical models with intuitive visual feedback to identify trends and volatility shifts effectively.

👽 How the Indicator Works
👾 Volatility Classification with Gaussian Filtering
The indicator detects volatility levels by applying Gaussian filters to the price series. Gaussian filters smooth out noise while preserving significant price movements. Traders can adjust the smoothing levels using sigma parameters, enabling greater flexibility:
👾 Clustering Algorithm for Regime Detection
The core of this indicator is its clustering model, which classifies market conditions into two distinct regimes:
The clustering process works as follows:
👾 Oscillator Generation with Slope R-Values
The indicator computes Gaussian filter slopes to generate oscillators that visualize trends:
The slope is measured using the R-value of the linear regression fit, scaled and adjusted for easier interpretation.
👽 Applications
👾 Trend Trading
When the oscillator rises above 0.5, it signals potential bullish momentum, while dips below 0.5 suggest bearish sentiment.

👾 Pullback Detection
When the oscillator peaks, especially in overbought or oversold zones, provide early warnings of potential reversals.

👽 Indicator Settings
👾 Oscillator Settings
Sigma Low/High: Controls the smoothness of the oscillators.
👾 Window Size and Refit Interval
Window Size: Defines the rolling period for cluster and volatility calculations.
Disclaimer: This information is for entertainment purposes only and does not constitute financial advice. Please consult with a qualified financial advisor before making any investment decisions.
👽 How the Indicator Works
👾 Volatility Classification with Gaussian Filtering
The indicator detects volatility levels by applying Gaussian filters to the price series. Gaussian filters smooth out noise while preserving significant price movements. Traders can adjust the smoothing levels using sigma parameters, enabling greater flexibility:
- Low Sigma: Emphasizes short-term volatility.
- High Sigma: Captures broader trends with reduced sensitivity to small fluctuations.
👾 Clustering Algorithm for Regime Detection
The core of this indicator is its clustering model, which classifies market conditions into two distinct regimes:
- Low Volatility Regime: Calm periods with reduced market activity.
- High Volatility Regime: Intense periods with heightened price movements.
The clustering process works as follows:
- A rolling window of data is analyzed to calculate the standard deviation of price returns.
- Two cluster centers are initialized using the 25th and 75th percentiles of the data distribution.
- Each price volatility value is assigned to the nearest cluster based on its distance to the centers.
- The cluster centers are refined iteratively, providing an accurate and adaptive classification.
👾 Oscillator Generation with Slope R-Values
The indicator computes Gaussian filter slopes to generate oscillators that visualize trends:
- Oscillator Low: Captures low-frequency market behavior.
- Oscillator High: Tracks high-frequency, faster-changing trends.
The slope is measured using the R-value of the linear regression fit, scaled and adjusted for easier interpretation.
👽 Applications
👾 Trend Trading
When the oscillator rises above 0.5, it signals potential bullish momentum, while dips below 0.5 suggest bearish sentiment.
👾 Pullback Detection
When the oscillator peaks, especially in overbought or oversold zones, provide early warnings of potential reversals.
👽 Indicator Settings
👾 Oscillator Settings
Sigma Low/High: Controls the smoothness of the oscillators.
- Smaller Values: React faster to price changes but introduce more noise.
- Larger Values: Provide smoother signals with longer-term insights.
👾 Window Size and Refit Interval
Window Size: Defines the rolling period for cluster and volatility calculations.
- Shorter windows: adapt faster to market changes.
- Longer windows: produce stable, reliable classifications.
Disclaimer: This information is for entertainment purposes only and does not constitute financial advice. Please consult with a qualified financial advisor before making any investment decisions.
Script open-source
Nello spirito di TradingView, l'autore di questo script lo ha reso open source, in modo che i trader possano esaminarne e verificarne la funzionalità. Complimenti all'autore! Sebbene sia possibile utilizzarlo gratuitamente, ricordiamo che la ripubblicazione del codice è soggetta al nostro Regolamento.
👾 Adam at AI Bitcoin Trend
👽 We are the Quants!
👇 Be part of the fastest-growing quant trading community! 👇
discord.gg/7weCgzN5a7
🌕 Famous on Threads!
🪐 simpleaitrading.com/
👽 We are the Quants!
👇 Be part of the fastest-growing quant trading community! 👇
discord.gg/7weCgzN5a7
🌕 Famous on Threads!
🪐 simpleaitrading.com/
Declinazione di responsabilità
Le informazioni e le pubblicazioni non sono intese come, e non costituiscono, consulenza o raccomandazioni finanziarie, di investimento, di trading o di altro tipo fornite o approvate da TradingView. Per ulteriori informazioni, consultare i Termini di utilizzo.