OPEN-SOURCE SCRIPT
Fed Net Liquidity Indicator (24-Oct-2022 update)
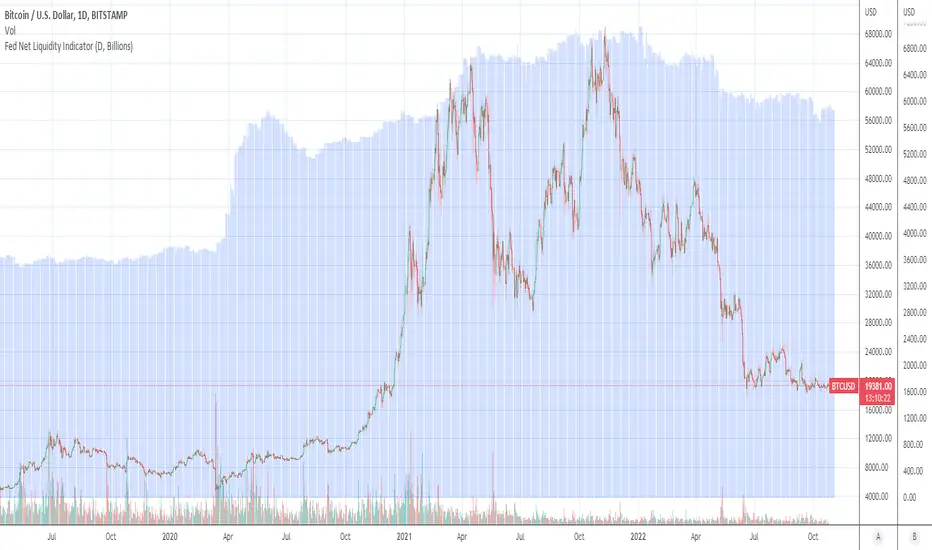
This indicator is an implementation of the USD Liquidity Index originally proposed by Arthur Hayes based on the initial implementation of jlb05013, kudos to him!
I have incorporated subsequent additions (Standing Repo Facility and Central Bank Liquidity Swaps lines) and dealt with some recent changes in reporting units from TradingView.
This is a macro indicator that aims at tracking how much USD liquidity is available to chase financial assets:
- When the FED is expanding liquidity, financial asset prices tend to increase
- When the FED is contracting liquidity, financial asset prices tend to decrease
Here is the current calculation:
Net Liquidity =
(+) The Fed’s Balance Sheet (FRED:WALCL)
(-) NY Fed Total Amount of Accepted Reverse Repo Bids (FRED:RRPONTTLD)
(-) US Treasury General Account Balance Held at NY Fed (FRED:WTREGEN)
(+) NY Fed - Standing Repo Facility (FRED:RPONTSYD)
(+) NY Fed - Central Bank Liquidity Swaps (FRED:SWPT)
Script open-source
Nello spirito di TradingView, l'autore di questo script lo ha reso open source, in modo che i trader possano esaminarne e verificarne la funzionalità. Complimenti all'autore! Sebbene sia possibile utilizzarlo gratuitamente, ricordiamo che la ripubblicazione del codice è soggetta al nostro Regolamento.
Declinazione di responsabilità
Le informazioni e le pubblicazioni non sono intese come, e non costituiscono, consulenza o raccomandazioni finanziarie, di investimento, di trading o di altro tipo fornite o approvate da TradingView. Per ulteriori informazioni, consultare i Termini di utilizzo.