OPEN-SOURCE SCRIPT
Price Position Percentile (PPP)
Price Position Percentile (PPP)
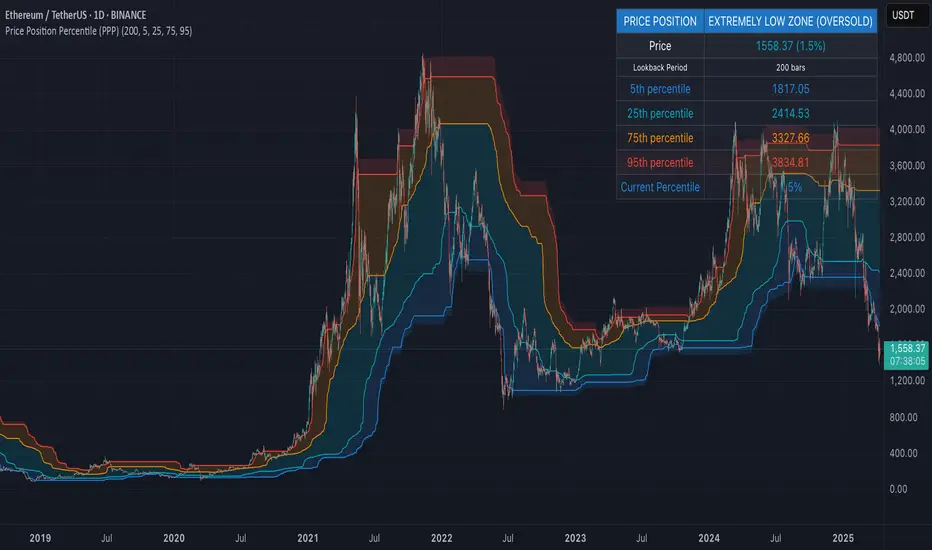
A statistical analysis tool that dynamically measures where current price stands within its historical distribution. Unlike traditional oscillators, PPP adapts to market conditions by calculating percentile ranks, creating a self-adjusting framework for identifying extremes.
How It Works
This indicator analyzes the last 200 price bars (customizable) and calculates the percentile rank of the current price within this distribution. For example, if the current price is at the 80th percentile, it means the price is higher than 80% of all prices in the lookback period.
The indicator creates five dynamic zones based on percentile thresholds:
- Extremely Low Zone (<5%): Prices in the lowest 5% of the distribution, indicating potential oversold conditions.
- Low Zone (5-25%): Accumulation zone where prices are historically low but not extreme.
- Neutral Zone (25-75%): Fair value zone representing the middle 50% of the price distribution.
- High Zone (75-95%): Distribution zone where prices are historically high but not extreme.
- Extremely High Zone (>95%): Prices in the highest 5% of the distribution, suggesting potential bubble conditions.
Mathematical Foundation
Unlike fixed-threshold indicators, PPP uses a non-parametric approach:
// Core percentile calculation
percentile = (count_of_prices_below_current / total_prices) * 100
// Threshold calculation using built-in function
p_extremely_low = ta.percentile_linear_interpolation(source, lookback, 5)
p_low = ta.percentile_linear_interpolation(source, lookback, 25)
p_neutral_high = ta.percentile_linear_interpolation(source, lookback, 75)
p_extremely_high = ta.percentile_linear_interpolation(source, lookback, 95)
Key Features
- Dynamic Adaptation: All zones adjust automatically as price distribution changes
- Statistical Robustness: Works on any timeframe and any market, including highly volatile cryptocurrencies
- Visual Clarity: Color-coded zones provide immediate visual context
- Non-parametric Analysis: Makes no assumptions about price distribution shape
- Historical Context: Shows how zones evolved over time, revealing market regime changes
Practical Applications
PPP provides objective statistical context for price action, helping traders make more informed decisions based on historical price distribution rather than arbitrary levels.
Value Investment: Identify statistically significant low prices for potential entry points
Risk Management: Recognize when prices reach historical extremes for profit taking
Cycle Analysis: Observe how percentile zones expand and contract during different market phases
Market Regime Detection: Identify transitions between accumulation, markup, distribution, and markdown phases
Usage Guidelines
This indicator is particularly effective when:
- Used across multiple timeframes for confirmation
- Combined with volume analysis for validation of extremes
- Applied in conjunction with trend identification tools
- Monitored for divergences between price action and percentile ranking
Script open-source
Nello spirito di TradingView, l'autore di questo script lo ha reso open source, in modo che i trader possano esaminarne e verificarne la funzionalità. Complimenti all'autore! Sebbene sia possibile utilizzarlo gratuitamente, ricordiamo che la ripubblicazione del codice è soggetta al nostro Regolamento.
Declinazione di responsabilità
Le informazioni e le pubblicazioni non sono intese come, e non costituiscono, consulenza o raccomandazioni finanziarie, di investimento, di trading o di altro tipo fornite o approvate da TradingView. Per ulteriori informazioni, consultare i Termini di utilizzo.