OPEN-SOURCE SCRIPT
Aggiornato Return (Percent Change)
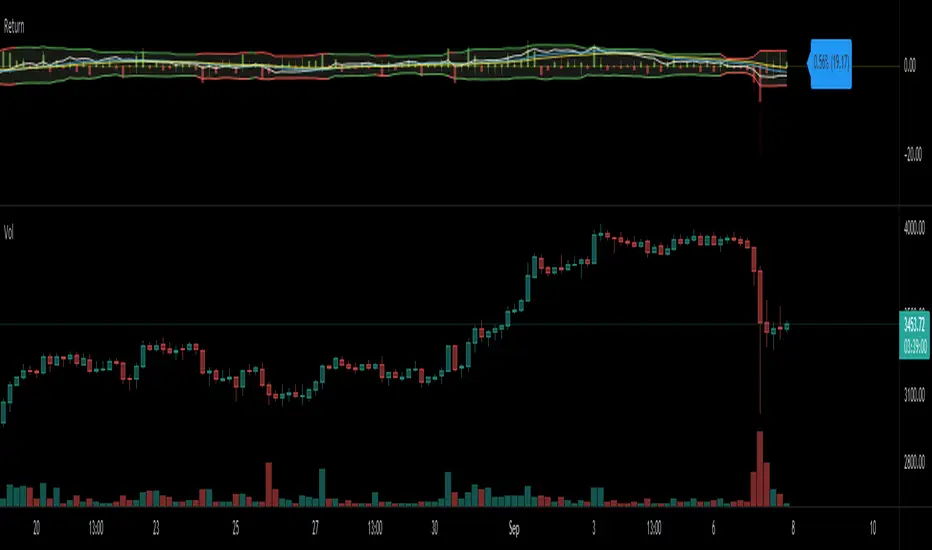
This Script displays Regular or Log Returns as either a line or histogram and labels the current bar.
If something other than price is selected as the source, the result is percent change with a positive or negative slope.
If a moving average of price is used as the source, the result is analogous to a strength index
Other options include a look-back period adjustment (the default is 1),
smoothing results by converting to an EMA, and
Bollinger Bands with Length and Standard Deviation inputs.
Note di rilascio
Name Shortened to "Return"Note di rilascio
precision increased to two decimal placesNote di rilascio
// This Script displays Regular or Log Returns as either a line or histogram and labels the current bar. // Additionally, an "ArcTan" method is available which allows the slope of a line that crosses zero to be displayed.
// If a moving average of price is used as the source, the result is analogous to a strength index
// Other options include smoothing by converting to an EMA of returns,
// Bollinger Bands with SMA for the Length, and Standard Deviation for the Width.
// When the BB Basis is positive the bands appear green, and when negative they are red.
// if you set the BB basis to one, the color of the BB histogram will indicate the slope only.
Note di rilascio
Two Decimal Places for Absolute Change LabelNote di rilascio
corrected log input type spellingNote di rilascio
...Note di rilascio
Option to display absolute values was added.Bollinger Bands can be toggled on/off.
Note di rilascio
Script has been updated to allow Return and Basis to be expressed as several different types of moving average. From the Pinescript Reference:sma: The sma function returns the moving average, that is the sum of last y values of x, divided by y.
ema: The ema function returns the exponentially weighted moving average. In ema weighting factors decrease exponentially. It calculates by using a formula: EMA = alpha * x + (1 - alpha) * EMA[1], where alpha = 2 / (y + 1)
wma: The wma function returns weighted moving average of x for y bars back. In wma weighting factors decrease in arithmetical progression.
rma: Moving average used in RSI. It is the exponentially weighted moving average with alpha = 1 / length.
swma: Symmetrically weighted moving average with fixed length: 4. Weights: [1/6, 2/6, 2/6, 1/6].
vwma: The vwma function returns volume-weighted moving average of x for y bars back. It is the same as: sma(x * volume, y) / sma(volume, y)
Bands may be displayed as:
std dev: Standard Deviation (typical multiple value=2)
atr: Average True Range (typical multiple value = 1) RMA of true range. True range is max(high - low, abs(high - close[1]), abs(low - close[1]))
Here's an example show Bi-Weekly Log Returns of the entire history of bitcoin:
Here's an example of Daily Reg Returns in Absolute Price and the indicator being used to show the 30SMA Slope:
Note di rilascio
Comments and Example updatedCorrected example of Daily Reg Returns in Absolute Price and the indicator being used to show the 30SMA Slope:
Note di rilascio
Added functionality to magnify basis line (display only)Note di rilascio
corrected idea imageNote di rilascio
formattingNote di rilascio
corrected versioningNote di rilascio
formattingNote di rilascio
Script has been updated to include wicks, so you can now see candles normalized to zero.Two EMA's of the basis also have been added as an option, as well as the ability to magnify the plots (display only).
Script open-source
Nello spirito di TradingView, l'autore di questo script lo ha reso open source, in modo che i trader possano esaminarne e verificarne la funzionalità. Complimenti all'autore! Sebbene sia possibile utilizzarlo gratuitamente, ricordiamo che la ripubblicazione del codice è soggetta al nostro Regolamento.
Declinazione di responsabilità
Le informazioni e le pubblicazioni non sono intese come, e non costituiscono, consulenza o raccomandazioni finanziarie, di investimento, di trading o di altro tipo fornite o approvate da TradingView. Per ulteriori informazioni, consultare i Termini di utilizzo.