OPEN-SOURCE SCRIPT
Aggiornato Recessions & crises shading (custom dates & stats)
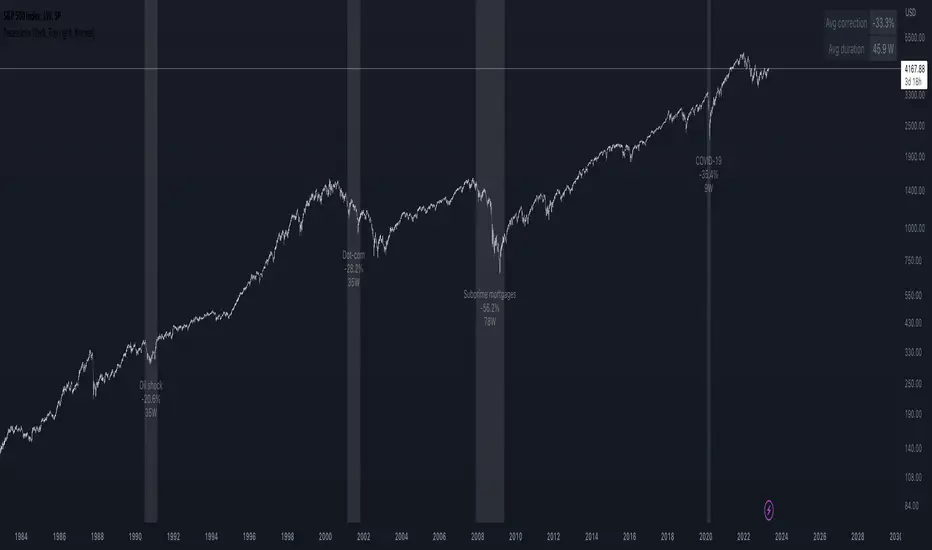
Shades your chart background to flag events such as crises or recessions, in similar fashion to what you see on FRED charts. The advantage of this indicator over others is that you can quickly input custom event dates as text in the menu to analyse their impact for your specific symbol. The script automatically labels, calculates and displays the peak to through percentage corrections on your current chart.
By default the indicator is configured to show the last 6 US recessions. If you have custom events which will benefit others, just paste the input string in the comments below so one can simply copy/paste in their indicator.
Example event input (No spaces allowed except for the label name. Enter dates as YYYY-MM-DD.)
2020-02-01,2020-03-31,COVID-19
2007-12-01,2009-05-31,Subprime mortgages
2001-03-01,2001-10-30,Dot-com bubble
1990-07-01,1991-03-01,Oil shock
1981-07-01,1982-11-01,US unemployment
1980-01-01,1980-07-01,Volker
1973-11-01,1975-03-01,OPEC
Note di rilascio
Removed section of code that was used for debugging when testingScript open-source
Nello spirito di TradingView, l'autore di questo script lo ha reso open source, in modo che i trader possano esaminarne e verificarne la funzionalità. Complimenti all'autore! Sebbene sia possibile utilizzarlo gratuitamente, ricordiamo che la ripubblicazione del codice è soggetta al nostro Regolamento.
Declinazione di responsabilità
Le informazioni e le pubblicazioni non sono intese come, e non costituiscono, consulenza o raccomandazioni finanziarie, di investimento, di trading o di altro tipo fornite o approvate da TradingView. Per ulteriori informazioni, consultare i Termini di utilizzo.
Script open-source
Nello spirito di TradingView, l'autore di questo script lo ha reso open source, in modo che i trader possano esaminarne e verificarne la funzionalità. Complimenti all'autore! Sebbene sia possibile utilizzarlo gratuitamente, ricordiamo che la ripubblicazione del codice è soggetta al nostro Regolamento.
Declinazione di responsabilità
Le informazioni e le pubblicazioni non sono intese come, e non costituiscono, consulenza o raccomandazioni finanziarie, di investimento, di trading o di altro tipo fornite o approvate da TradingView. Per ulteriori informazioni, consultare i Termini di utilizzo.