OPEN-SOURCE SCRIPT
Trend Dominance Multi Timeframe [Misu]
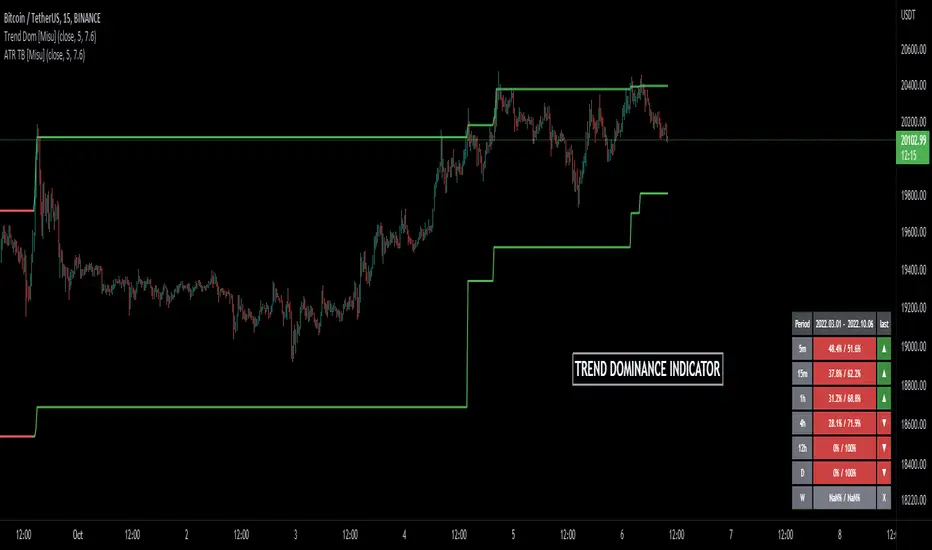
█ This indicator shows the repartition of bullish and bearish trends over a certain period in multiple timeframes. It's also showing the trending direction at the time.
█ Usages:
Trend dominance is expressed with two percentages: left is downtrend and right is uptrend. Cell colors turn green if dominance is up and red if it is down.

Knowing the trend dominance allows you to have a better overview of the market conditions.
You can use it to your advantage to favor long or short trades, reversal or breakout strategies, etc.
█ Features:
> Table colors
> Instant Trend Multitimeframe
> Trend Dominance Multitimeframe
█ Parameters:
> Length: Length is used to calculate ATR.
> Atr Multiplier: A factor used to balance the impact of the ATR on the Trend Bands calculation.
> UI Settings
█ Usages:
Trend dominance is expressed with two percentages: left is downtrend and right is uptrend. Cell colors turn green if dominance is up and red if it is down.
Knowing the trend dominance allows you to have a better overview of the market conditions.
You can use it to your advantage to favor long or short trades, reversal or breakout strategies, etc.
█ Features:
> Table colors
> Instant Trend Multitimeframe
> Trend Dominance Multitimeframe
█ Parameters:
> Length: Length is used to calculate ATR.
> Atr Multiplier: A factor used to balance the impact of the ATR on the Trend Bands calculation.
> UI Settings
Note di rilascio
Change chart.Script open-source
In pieno spirito TradingView, il creatore di questo script lo ha reso open-source, in modo che i trader possano esaminarlo e verificarne la funzionalità. Complimenti all'autore! Sebbene sia possibile utilizzarlo gratuitamente, ricorda che la ripubblicazione del codice è soggetta al nostro Regolamento.
Declinazione di responsabilità
Le informazioni ed i contenuti pubblicati non costituiscono in alcun modo una sollecitazione ad investire o ad operare nei mercati finanziari. Non sono inoltre fornite o supportate da TradingView. Maggiori dettagli nelle Condizioni d'uso.
Script open-source
In pieno spirito TradingView, il creatore di questo script lo ha reso open-source, in modo che i trader possano esaminarlo e verificarne la funzionalità. Complimenti all'autore! Sebbene sia possibile utilizzarlo gratuitamente, ricorda che la ripubblicazione del codice è soggetta al nostro Regolamento.
Declinazione di responsabilità
Le informazioni ed i contenuti pubblicati non costituiscono in alcun modo una sollecitazione ad investire o ad operare nei mercati finanziari. Non sono inoltre fornite o supportate da TradingView. Maggiori dettagli nelle Condizioni d'uso.