NIBIRU MATRIX
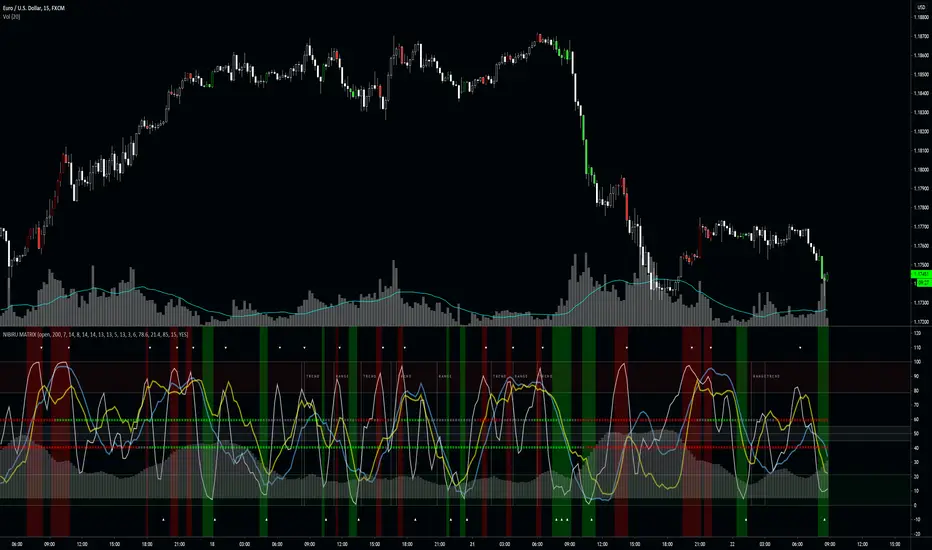
The Nibiru Matrix provides trade entry hints and information about the current market behavior (trending or ranging). If the market is trending, it also shows the trend strength and direction. It is a secondary indicator meaning it trade should be made on the support or resistance using Nibiru Matrix as a confluence indicator.
What it plots?
- Slow, fast and stochastic oscillators
- Bar coloring to warn about possible setups
- Trending/ranging market indication
- Current volatility
- 2 methods of trend confirmation based on 2 different algorithms
Indicator components:
Trend/range setup - provides information about current possible trade strategy. Following a RANGE indicator, Voodoo Matrix suggests that the safest way to trade will be between the local support and resistance shown by Voodoo Support and Resistance, and following a TREND indicator, it is likely that a trending strategy or taking profit on larger ranges is more profitable.
Fast trend indicator - providing color based information on direction of the short-term trend. This is the most reactive trend indication shown by Voodoo Matrix. This can even be used for counter-main-trend scalping.
- Green - uptrend
- Red - downtrend
- Gray - indecision
Slow trend indicator - providing color based information on direction of the long-term trend. It is based on the behavior of a longer period EMAs.
- Green - uptrend
- Red - downtrend
- Gray - indecision
Volatility histogram - information on current price strength. Best used in confluence with the short term trend indicator.
Fast oscillator - oscillator based on stochastic RSI, modified to provide better information on timing and price movement. It's fast moving which helps time the shorter-term moves.
Slow oscillator - oscillator based on stochastic RSI, modified to provide better information on timing and price movement. It's slow moving and provides useful information about the price direction and strength of the move.
Stochastic oscillator - simple stochastic oscillator. Best used with both Fast and Slow Oscillators to get best timing and price movement strength and direction.
Overbought zone - area of the chart where the modified stochastic oscillator suggests the market is currently overbought.
Oversold zone - area of the chart where the modified stochastic oscillator suggests the market is currently oversold.
Neutral zone - area of the chart where the modified stochastic oscillator suggests the market is currently neutral.
Timing confirmation hints - signaling confirmation of fast oscillator forming a buy/sell setup.
Fast oscillator buy/sell color hints – bar coloring to bring a focus and attention to possible buy/sell signal forming on the fast oscillator.
Use the link below or PM me to gain access to the indicator.
- visual overview of the indicator
- replaced one oscillator with 3 different ones: Slow, Fast and Stochastic
- added new inputs for better tweaking options
- Changes in indicators colors
- Added Scalp mode - visual help to time entries/exits
- Added buy/sell zone
- Added background coloring when fast oscillator enters Buy/Sell zone
- Removed crossover hints
- Added timing confirmation hints
- Minor indicator calculation tweaks
Script su invito
Solo gli utenti approvati dall'autore possono accedere a questo script. È necessario richiedere e ottenere l'autorizzazione per utilizzarlo. Tale autorizzazione viene solitamente concessa dopo il pagamento. Per ulteriori dettagli, seguire le istruzioni dell'autore riportate di seguito o contattare direttamente CJackiedaBear.
TradingView NON consiglia di acquistare o utilizzare uno script a meno che non si abbia piena fiducia nel suo autore e se ne comprenda il funzionamento. È inoltre possibile trovare alternative gratuite e open source nei nostri script della community.
Istruzioni dell'autore
Declinazione di responsabilità
Script su invito
Solo gli utenti approvati dall'autore possono accedere a questo script. È necessario richiedere e ottenere l'autorizzazione per utilizzarlo. Tale autorizzazione viene solitamente concessa dopo il pagamento. Per ulteriori dettagli, seguire le istruzioni dell'autore riportate di seguito o contattare direttamente CJackiedaBear.
TradingView NON consiglia di acquistare o utilizzare uno script a meno che non si abbia piena fiducia nel suo autore e se ne comprenda il funzionamento. È inoltre possibile trovare alternative gratuite e open source nei nostri script della community.