OPEN-SOURCE SCRIPT
Aggiornato Nyquist Moving Average (NMA) MACD [Loxx]
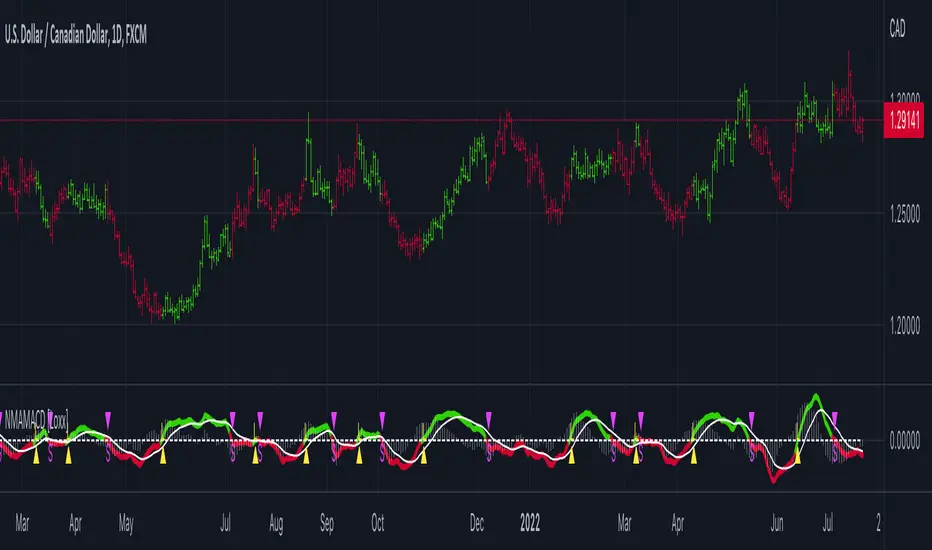
Nyquist Moving Average (NMA) MACD [Loxx] is a MACD indicator using Nyquist Moving Average for its calculation.
What is the Nyquist Moving Average?
A moving average outlined originally developed by Dr . Manfred G. Dürschner in his paper "Gleitende Durchschnitte 3.0".
In signal processing theory, the application of a MA to itself can be seen as a Sampling procedure. The sampled signal is the MA (referred to as MA.) and the sampling signal is the MA as well (referred to as MA). If additional periodic cycles which are not included in the price series are to be avoided sampling must obey the Nyquist Criterion.
It can be concluded that the Moving Averages 3.0 on the basis of the Nyquist Criterion bring about a significant improvement compared with the Moving Averages 2.0 and 1.0. Additionally, the efficiency of the Moving Averages 3.0 can be proven in the result of a trading system with NWMA as basis.
What is the MACD?
Moving average convergence divergence (MACD) is a trend-following momentum indicator that shows the relationship between two moving averages of a security’s price. The MACD is calculated by subtracting the 26-period exponential moving average (EMA) from the 12-period EMA.
The result of that calculation is the MACD line. A nine-day EMA of the MACD called the "signal line," is then plotted on top of the MACD line, which can function as a trigger for buy and sell signals. Traders may buy the security when the MACD crosses above its signal line and sell—or short—the security when the MACD crosses below the signal line. Moving average convergence divergence (MACD) indicators can be interpreted in several ways, but the more common methods are crossovers, divergences, and rapid rises/falls.
Included
- Bar coloring
- 2 types of signal output options
- Alerts
- Loxx's Expanded Source Types
Note di rilascio
Removed unused inputs.Script open-source
Nello spirito di TradingView, l'autore di questo script lo ha reso open source, in modo che i trader possano esaminarne e verificarne la funzionalità. Complimenti all'autore! Sebbene sia possibile utilizzarlo gratuitamente, ricordiamo che la ripubblicazione del codice è soggetta al nostro Regolamento.
Public Telegram Group, t.me/algxtrading_public
VIP Membership Info: patreon.com/algxtrading/membership
VIP Membership Info: patreon.com/algxtrading/membership
Declinazione di responsabilità
Le informazioni e le pubblicazioni non sono intese come, e non costituiscono, consulenza o raccomandazioni finanziarie, di investimento, di trading o di altro tipo fornite o approvate da TradingView. Per ulteriori informazioni, consultare i Termini di utilizzo.
Script open-source
Nello spirito di TradingView, l'autore di questo script lo ha reso open source, in modo che i trader possano esaminarne e verificarne la funzionalità. Complimenti all'autore! Sebbene sia possibile utilizzarlo gratuitamente, ricordiamo che la ripubblicazione del codice è soggetta al nostro Regolamento.
Public Telegram Group, t.me/algxtrading_public
VIP Membership Info: patreon.com/algxtrading/membership
VIP Membership Info: patreon.com/algxtrading/membership
Declinazione di responsabilità
Le informazioni e le pubblicazioni non sono intese come, e non costituiscono, consulenza o raccomandazioni finanziarie, di investimento, di trading o di altro tipo fornite o approvate da TradingView. Per ulteriori informazioni, consultare i Termini di utilizzo.