OPEN-SOURCE SCRIPT
WT_BTC_Dow Jones_2019[wozdux]
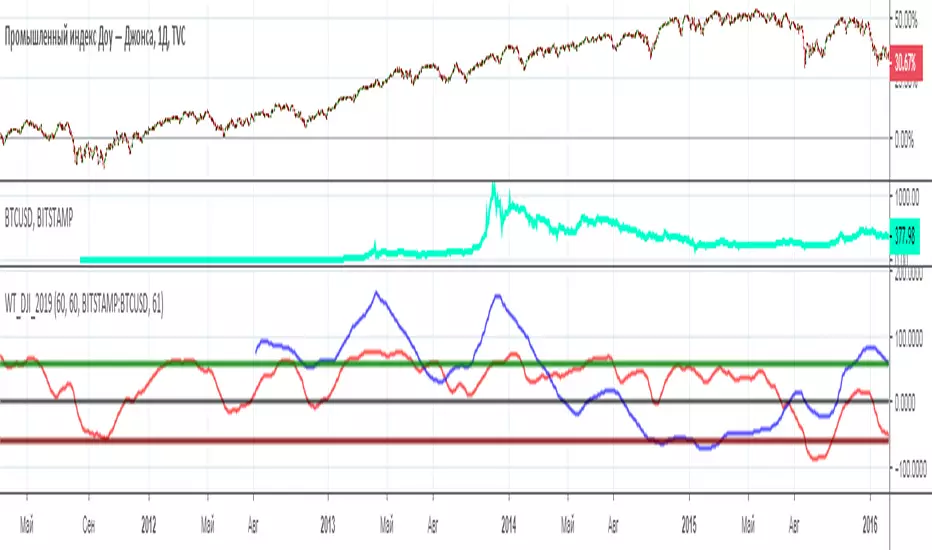
Comparison of two trading instruments using the indicator. Visual comparison often does not provide complete information. The scale and amplitude of the fluctuations of the two trading pairs are very different. Therefore, it is better to compare indicators from these pairs. I have used for this purpose, the speed indicator of price movement wt. The red line is the wt indicator from the trading instrument that is in the main window. The blue line is an indicator from the pair, which is written in the indicator settings. In addition, the calculation periods for each pair can be taken as the same or different. Often, trading pairs do not fluctuate synchronously, so it is necessary to select the periods of calculation of the wt indicator individually. In this example, Dow Jones and bitcoin were used.
-----------------------
Сравнение двух торговых инструментов с помощью индикатора. Визуальное сравнение часто не дает полной информации. Масштаб и амплитуда колебаний двух торговых пар бывают сильно различаются. Поэтому сравнивать лучше индикаторы от данных пар. Я использовала для этой цели индикатор скорости движения цены wt. Красная линия это индикатор wt от того торгового инструмента, который находится в главном окне. Синяя линия это индикатор от пары, которая прописывается в настройках индикатора. Кроме того, периоды вычислений для каждой пары можно брать как одинаковые, так и разные. Часто торговые пары колеблются не синхронно, поэтому стоит подбирать периоды вычислений индикатора WT индивидуально. В данном примере использовался Доу Джонс и биткоин.
Script open-source
Nello spirito di TradingView, l'autore di questo script lo ha reso open source, in modo che i trader possano esaminarne e verificarne la funzionalità. Complimenti all'autore! Sebbene sia possibile utilizzarlo gratuitamente, ricordiamo che la ripubblicazione del codice è soggetta al nostro Regolamento.
Declinazione di responsabilità
Le informazioni e le pubblicazioni non sono intese come, e non costituiscono, consulenza o raccomandazioni finanziarie, di investimento, di trading o di altro tipo fornite o approvate da TradingView. Per ulteriori informazioni, consultare i Termini di utilizzo.