OPEN-SOURCE SCRIPT
Aggiornato 1A Monthly P&L Table - Using Library
1A Monthly P&L Table: Track Your Performance Month-by-Month
Overview:
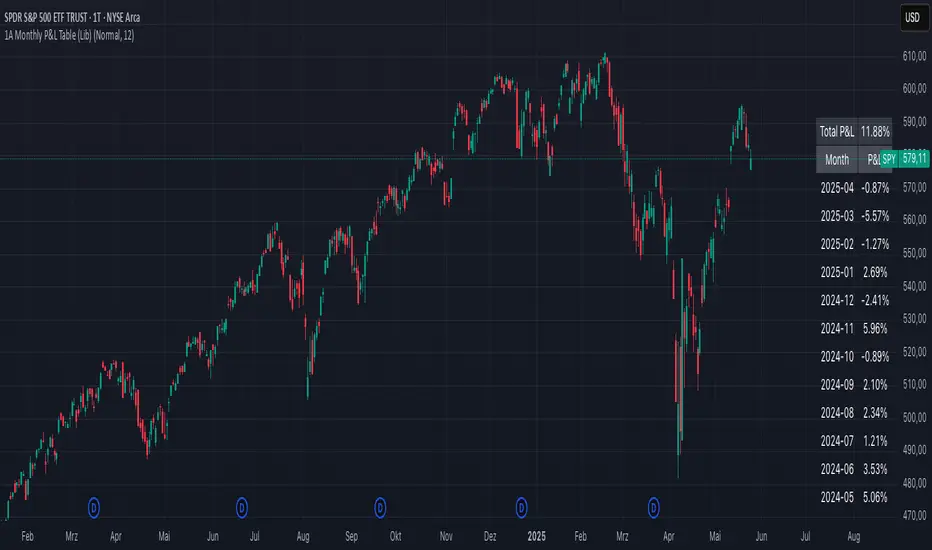
The 1A Monthly P&L Table is a straightforward yet powerful indicator designed to give you an immediate overview of your asset's (or strategy's) percentage performance on a monthly basis. Displayed conveniently in the bottom-right corner of your chart, this tool helps you quickly assess historical gains and losses, making it easier to analyze trends in performance over time.
Key Features:
How It Works:
The indicator calculates the percentage change from the close of the previous month to the close of the current month. For the very first month displayed, it calculates the P&L from the opening price of the chart's first bar to the close of that month. This data is then neatly organized into a table, updated on the last bar of the day or session.
Ideal For:
Settings:
Overview:
The 1A Monthly P&L Table is a straightforward yet powerful indicator designed to give you an immediate overview of your asset's (or strategy's) percentage performance on a monthly basis. Displayed conveniently in the bottom-right corner of your chart, this tool helps you quickly assess historical gains and losses, making it easier to analyze trends in performance over time.
Key Features:
- [] Monthly Performance at a Glance: Clearly see the percentage change for each past month.
[] Cumulative P&L: A running total of the displayed monthly P&L is provided, giving you a quick sum of performance over the selected period.
[] Customizable Display:[] Months to Display: Choose how many past months you want to see in the table (from 1 to 60 months).
[] Text Size: Adjust the text size (Tiny, Small, Normal, Large, Huge) to fit your viewing preferences.
[] Text Color: Customize the color of the text for better visibility against your chart background. - Intraday & Daily Compatibility: The table is optimized to display on daily and intraday timeframes, ensuring it's relevant for various trading styles. (Note: For very long-term analysis on weekly/monthly charts, you might consider other tools, as this focuses on granular monthly P&L.)
How It Works:
The indicator calculates the percentage change from the close of the previous month to the close of the current month. For the very first month displayed, it calculates the P&L from the opening price of the chart's first bar to the close of that month. This data is then neatly organized into a table, updated on the last bar of the day or session.
Ideal For:
- [] Traders and investors who want a quick, visual summary of monthly performance.
[] Analyzing seasonal trends or consistent periods of profitability/drawdown. - Supplementing backtesting results with a clear month-by-month breakdown.
Settings:
- [] Text Color: Changes the color of all text within the table.
[] Text Size: Controls the font size of the table content. - Months to Display: Determines the number of recent months included in the table.
Note di rilascio
1A Monthly P&L Table: Track Security Performance Month-by-MonthOverview:
The 1A Monthly P&L Table is a straightforward yet powerful indicator / table designed to give you an immediate overview of the chart securities percentage performance on a monthly basis. Displayed conveniently in the bottom-right corner of your chart, this tool helps you quickly assess historical gains and losses, making it easier to analyze trends in performance over time.
Key Features:
- Monthly Performance at a Glance: Clearly see the percentage change for each past month.
- Cumulative P&L: A running total of the displayed monthly P&L is provided, giving you a quick sum of performance over the selected period.
[] Customizable Display:Months to Display: Choose how many past months you want to see in the table (from 1 to 36 months).
Text Size: Adjust the text size (Tiny, Small, Normal, Large, Huge) to fit your viewing preferences.
[] Text Color: Customize the color of the text for better visibility against your chart background. - Intraday & Daily Compatibility: The table is optimized to display on daily and intraday timeframes, ensuring it's relevant for various trading styles. (Note: For very long-term analysis on weekly/monthly charts, you might consider other tools, as this focuses on granular monthly P&L.)
How It Works:
The indicator calculates the percentage change from the close of the previous month to the close of the current month. For the very first month displayed, it calculates the P&L from the opening price of the chart's first bar to the close of that month. This data is then neatly organized into a table, updated on the last bar of the day or session.
Ideal For:
- Traders and investors who want a quick, visual summary of monthly performance.
- Analyzing seasonal trends or consistent periods of profitability.
Settings:
- Text Color: Changes the color of all text within the table.
- Text Size: Controls the font size of the table content.
- Months to Display: Determines the number of recent months included in the table.
Script open-source
Nello spirito di TradingView, l'autore di questo script lo ha reso open source, in modo che i trader possano esaminarne e verificarne la funzionalità. Complimenti all'autore! Sebbene sia possibile utilizzarlo gratuitamente, ricordiamo che la ripubblicazione del codice è soggetta al nostro Regolamento.
Declinazione di responsabilità
Le informazioni e le pubblicazioni non sono intese come, e non costituiscono, consulenza o raccomandazioni finanziarie, di investimento, di trading o di altro tipo fornite o approvate da TradingView. Per ulteriori informazioni, consultare i Termini di utilizzo.