OPEN-SOURCE SCRIPT
Aggiornato Trend Impulse Filter

Introduction
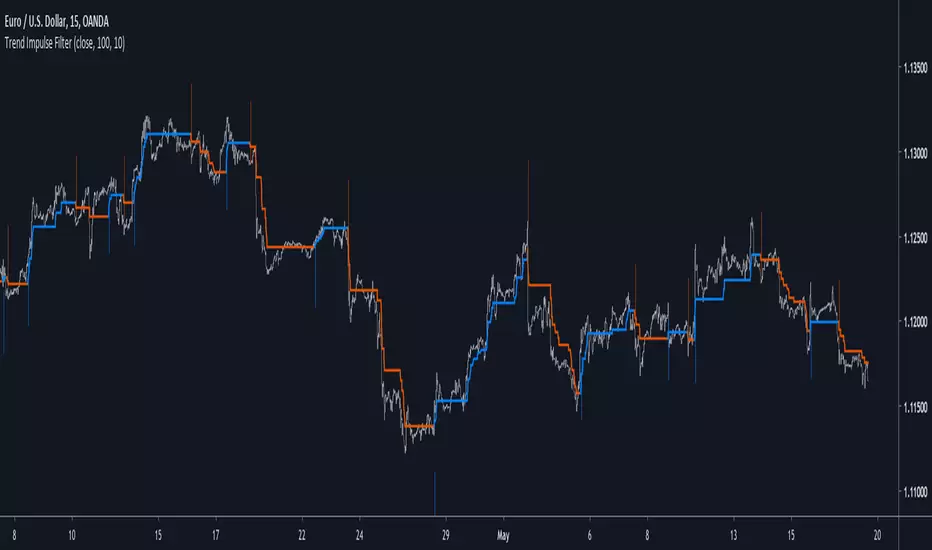
There is a lot of indicators similar to this one, however i think this one don't share the same calculation method and this is why i share it. This indicator aim to forecast price direction using an exponential filter architecture using highest and lowest information for the estimation of a smoothing variable. This filter is similar to the average Max-Min filter.
The Indicator
In the code a is equal to 1 when the price is greater or lower than any past price over length period, else a is equal to 0. The center parameter control the filtering degree of the output, when center is equal to 1 and a = 1 the indicator return the highest or lowest depending on market current trend, when center is superior to 1 the output will be smoother, however the reactivity of the indicator will still depend on the length parameter.
A color option show you the trend of the market, however the generated signals are the same that can be generated from a Donchian channel.

When highest is greater than previous highest the indicator direction will move upward, else if lowest is lower than previous lowest the indicator direction will move downward. Therefore the indicator can give information on the Donchian channels direction and provide a nice filter.
Conclusions
Adapting to highest and lowest can make an indicator adapt to the essence of trend trading, the indicator i showed can be used as source for others indicator or in MA crossover strategies. If you have a strategy using Donchian channels you may be interested in using this indicator and se how it fit in your strategy. Hope you like it.
Thanks for reading !
There is a lot of indicators similar to this one, however i think this one don't share the same calculation method and this is why i share it. This indicator aim to forecast price direction using an exponential filter architecture using highest and lowest information for the estimation of a smoothing variable. This filter is similar to the average Max-Min filter.
The Indicator
In the code a is equal to 1 when the price is greater or lower than any past price over length period, else a is equal to 0. The center parameter control the filtering degree of the output, when center is equal to 1 and a = 1 the indicator return the highest or lowest depending on market current trend, when center is superior to 1 the output will be smoother, however the reactivity of the indicator will still depend on the length parameter.
A color option show you the trend of the market, however the generated signals are the same that can be generated from a Donchian channel.
When highest is greater than previous highest the indicator direction will move upward, else if lowest is lower than previous lowest the indicator direction will move downward. Therefore the indicator can give information on the Donchian channels direction and provide a nice filter.
Conclusions
Adapting to highest and lowest can make an indicator adapt to the essence of trend trading, the indicator i showed can be used as source for others indicator or in MA crossover strategies. If you have a strategy using Donchian channels you may be interested in using this indicator and se how it fit in your strategy. Hope you like it.
Thanks for reading !
Note di rilascio
Added color change by defaultModified linewidth
Note di rilascio
Added options to plot arrows based on indicator signalsScript open-source
Nello spirito di TradingView, l'autore di questo script lo ha reso open source, in modo che i trader possano esaminarne e verificarne la funzionalità. Complimenti all'autore! Sebbene sia possibile utilizzarlo gratuitamente, ricordiamo che la ripubblicazione del codice è soggetta al nostro Regolamento.
Check out the indicators we are making at luxalgo: tradingview.com/u/LuxAlgo/
"My heart is so loud that I can't hear the fireworks"
"My heart is so loud that I can't hear the fireworks"
Declinazione di responsabilità
Le informazioni e le pubblicazioni non sono intese come, e non costituiscono, consulenza o raccomandazioni finanziarie, di investimento, di trading o di altro tipo fornite o approvate da TradingView. Per ulteriori informazioni, consultare i Termini di utilizzo.
Script open-source
Nello spirito di TradingView, l'autore di questo script lo ha reso open source, in modo che i trader possano esaminarne e verificarne la funzionalità. Complimenti all'autore! Sebbene sia possibile utilizzarlo gratuitamente, ricordiamo che la ripubblicazione del codice è soggetta al nostro Regolamento.
Check out the indicators we are making at luxalgo: tradingview.com/u/LuxAlgo/
"My heart is so loud that I can't hear the fireworks"
"My heart is so loud that I can't hear the fireworks"
Declinazione di responsabilità
Le informazioni e le pubblicazioni non sono intese come, e non costituiscono, consulenza o raccomandazioni finanziarie, di investimento, di trading o di altro tipo fornite o approvate da TradingView. Per ulteriori informazioni, consultare i Termini di utilizzo.