OPEN-SOURCE SCRIPT
GC RSI Columns V2016

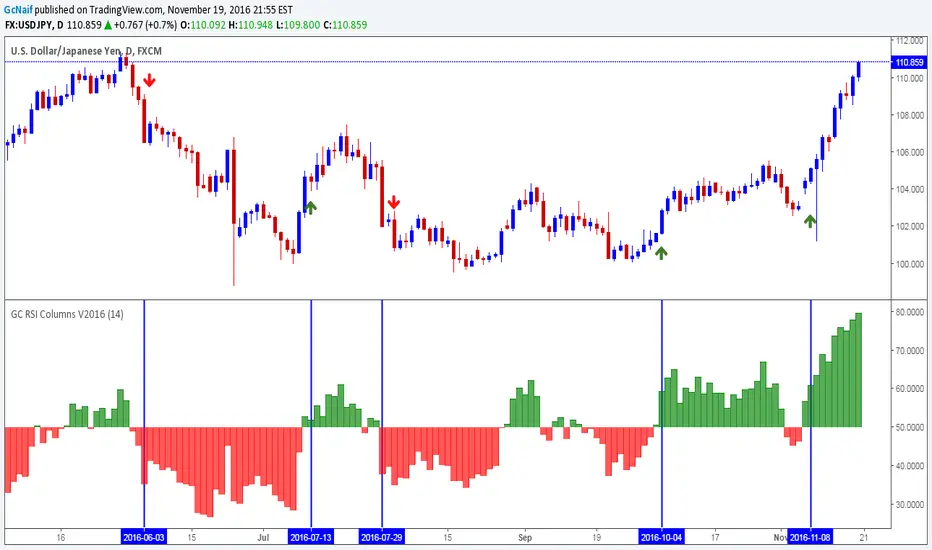
This is a basic RSI indicator but in column format.I had been using this for a while and it gives a nice visual representation of trend change by changing color of the column.
Base line is 50 level. Anything above 50 is buy opportunity and below 50 is sell opportunity . Try it on higher time frames and see the results.
Example on chart above.
Note: i published it on demand. many folks were asking me for this ,since it(column rsi) was not available in public indicators
Base line is 50 level. Anything above 50 is buy opportunity and below 50 is sell opportunity . Try it on higher time frames and see the results.
Example on chart above.
Note: i published it on demand. many folks were asking me for this ,since it(column rsi) was not available in public indicators
Script open-source
Nello spirito di TradingView, l'autore di questo script lo ha reso open source, in modo che i trader possano esaminarne e verificarne la funzionalità. Complimenti all'autore! Sebbene sia possibile utilizzarlo gratuitamente, ricordiamo che la ripubblicazione del codice è soggetta al nostro Regolamento.
I am a Chart Slave.Thank you TradingView and @nmike.
Declinazione di responsabilità
Le informazioni e le pubblicazioni non sono intese come, e non costituiscono, consulenza o raccomandazioni finanziarie, di investimento, di trading o di altro tipo fornite o approvate da TradingView. Per ulteriori informazioni, consultare i Termini di utilizzo.