OPEN-SOURCE SCRIPT
Aggiornato Multi Oscillators Price Levels

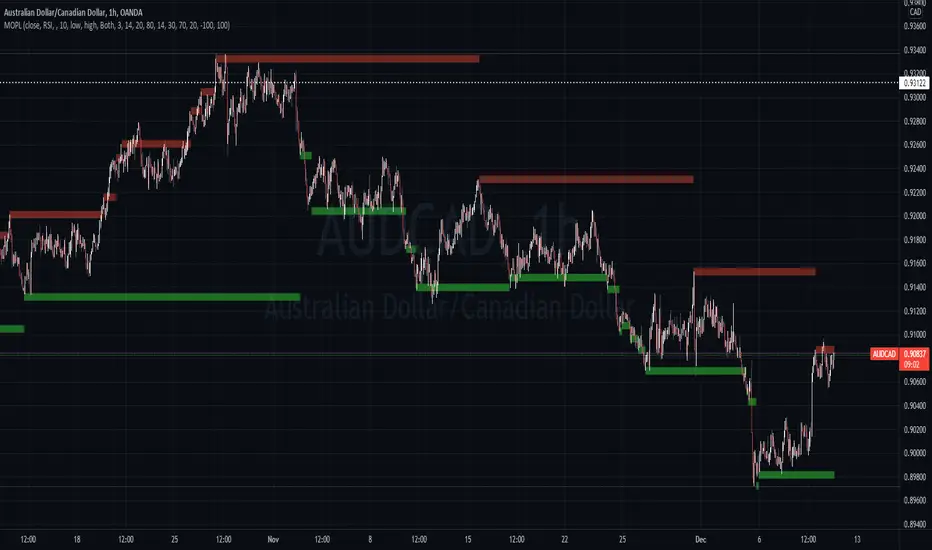
This script draws price levels corresponding to the highest price reached in overbought situations, and the lowest price reached in oversold situations, depending on the oscillator and the timeframe the user has configured.
These levels correspond, most of time, to good supports and resistances prices.
Price levels drawings can be based on the following indicators:
You can customize this indicator with the following options:
Here are a few examples of different configurations:


This script will probably be modified in the future, don't hesitate to suggest any improvement.
These levels correspond, most of time, to good supports and resistances prices.
Price levels drawings can be based on the following indicators:
- Stochastic RSI (default)
- Stochastic CCI
- RSI
- CCI
You can customize this indicator with the following options:
- Source: The candle source to use in indicators calculation
- Source Indicator: The indicator on which you cant to base your levels
- Timeframe: The timeframe on which you want to apply the selected indicator, and calculate levels
- Show supports/resistances: enable/disable price levels, depending on there status (overbought - resistances) / (oversold - supports)
- Lines width: width of price levels. (set to 10 by default in order to draw "zones")
- Supports/Resistances source: Select the candle data you cant to use to draw supports and resistances levels
- Extend levels: Select the line extension for price levels
- Levels color: Select the desired color for price levels
- And of course , all parameters corresponding to the supported indicators (Stoch, RSI, CCI)
Here are a few examples of different configurations:
This script will probably be modified in the future, don't hesitate to suggest any improvement.
Note di rilascio
Updates:- Supports and resistances are now represented in different colors
- Default timeframe is now the current one
- Support and resistances are not extended anymore in order to avoid chart overloading
- Default parameters are now RSI(14) based on the candles closing price
Note di rilascio
Levels extension added, but set to None by defaultScript open-source
Nello spirito di TradingView, l'autore di questo script lo ha reso open source, in modo che i trader possano esaminarne e verificarne la funzionalità. Complimenti all'autore! Sebbene sia possibile utilizzarlo gratuitamente, ricordiamo che la ripubblicazione del codice è soggetta al nostro Regolamento.
Declinazione di responsabilità
Le informazioni e le pubblicazioni non sono intese come, e non costituiscono, consulenza o raccomandazioni finanziarie, di investimento, di trading o di altro tipo fornite o approvate da TradingView. Per ulteriori informazioni, consultare i Termini di utilizzo.
Script open-source
Nello spirito di TradingView, l'autore di questo script lo ha reso open source, in modo che i trader possano esaminarne e verificarne la funzionalità. Complimenti all'autore! Sebbene sia possibile utilizzarlo gratuitamente, ricordiamo che la ripubblicazione del codice è soggetta al nostro Regolamento.
Declinazione di responsabilità
Le informazioni e le pubblicazioni non sono intese come, e non costituiscono, consulenza o raccomandazioni finanziarie, di investimento, di trading o di altro tipo fornite o approvate da TradingView. Per ulteriori informazioni, consultare i Termini di utilizzo.