PROTECTED SOURCE SCRIPT
MA Fractal Signal (Dual Zones 50-100-200)
📈 MA Fractal Signal (Dual Zones 50-100-200)
This indicator is a comprehensive trend-following tool designed to identify high-probability pullback entries. It combines a classic triple moving average setup (50, 100, 200) with fractal signals, but adds a unique twist: it only generates signals when a pullback fractal forms within one of two dynamic "pullback zones" created between the moving averages.
The core strategy is to:
Identify the Trend: Using the alignment of the 50, 100, and 200 MAs.
Wait for a Pullback: Identified by a fractal (pivot low or pivot high).
Confirm Entry Location: The fractal must form inside a key "support/resistance" zone (between MA 50/100 or MA 100/200).
Filter for Quality: The signal is then filtered for trend strength (ADX), momentum (RSI), and trend structure (MA separation) to reduce false signals.
⚙️ How It Works: Core Components
Triple Moving Averages:
Plots three MAs (defaulting to 50, 100, 200).
You can select the MA type (SMA, EMA, WMA, SMMA, HMA) and source.
Their alignment determines the trend direction.
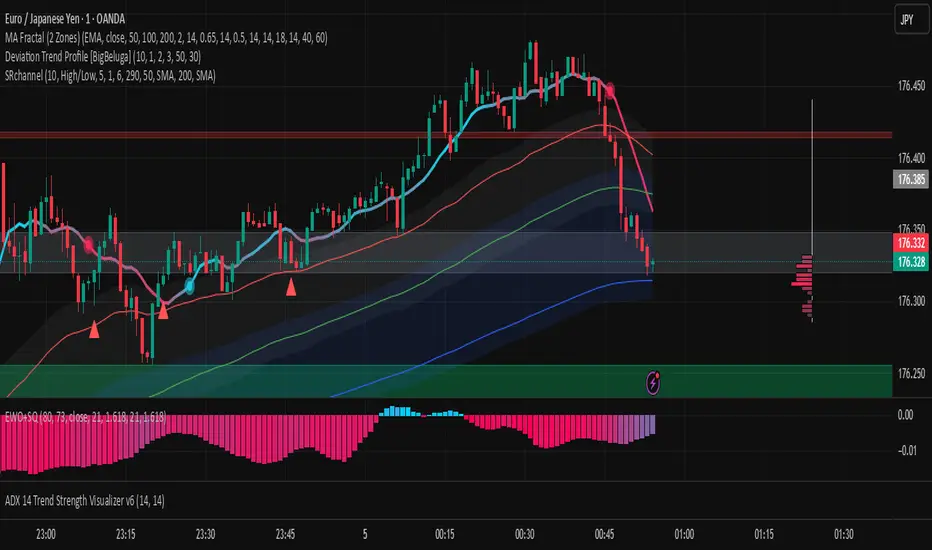
Dual Pullback Zones: The script creates two distinct shaded zones on the chart:
Zone 1 (Gray): The area between the 50 MA and 100 MA.
Zone 2 (Blue): The area between the 100 MA and 200 MA.
ATR Buffer: You can (and should) enable an ATR-based buffer. This makes the zones "thicker" by adding/subtracting a small ATR multiple from the MAs, allowing the script to catch pullbacks that almost touch the MAs but reverse just before.
Fractal Signals:
Uses standard ta.pivotlow (for buys) and ta.pivothigh (for sells) to identify local turning points.
The fractal period (bars to the left and right) is adjustable.
🚦 Signal Logic: Rules for Entry
The indicator will plot a shape and send an alert when all the following conditions are met at the time the fractal was formed:
🚀 Buy Signal (Red Up-Triangle)
Uptrend: MA 50 is above MA 100, AND MA 100 is above MA 200.
Pullback Signal: A Low Fractal (pivotlow) is confirmed.
Location: The low of the fractal candle is inside Zone 1 (between 50/100) OR Zone 2 (between 100/200).
Filters (if enabled):
ADX: Trend strength is above the adxThreshold.
RSI: RSI is above the rsiBuyLevel (e.g., > 40), indicating the pullback isn't deeply oversold.
MA Distance: The MAs are sufficiently "spread out" (measured by ATR), confirming a stable trend.
📉 Sell Signal (Green Down-Triangle)
Downtrend: MA 50 is below MA 100, AND MA 100 is below MA 200.
Pullback Signal: A High Fractal (pivothigh) is confirmed.
Location: The high of the fractal candle is inside Zone 1 (between 50/100) OR Zone 2 (between 100/200).
Filters (if enabled):
ADX: Trend strength is above the adxThreshold.
RSI: RSI is below the rsiSellLevel (e.g., < 60), indicating the pullback isn't deeply overbought.
MA Distance: The MAs are sufficiently "spread out."
🔧 Settings & Inputs
MA Settings: Choose the MA Type, Source, and Lengths for all three MAs.
Zone Buffer: Toggle the ATR buffer on/off and set its ATR Length and Multiplier. A smaller multiplier (e.g., 0.25) keeps the zone tight to the MAs.
Fractal Period: Set the number of bars to the left/right to identify a fractal.
ATR Distance Filter: Toggle the filter and set the ATR Length and Min. Multiplier required for the MAs to be considered "spread out."
ADX Filter: Toggle the filter and set the DI Length, ADX Smoothing, and Min. Trend Strength threshold.
RSI Filter: Toggle the filter and set the RSI Length and the Buy/Sell Levels.
This indicator is a comprehensive trend-following tool designed to identify high-probability pullback entries. It combines a classic triple moving average setup (50, 100, 200) with fractal signals, but adds a unique twist: it only generates signals when a pullback fractal forms within one of two dynamic "pullback zones" created between the moving averages.
The core strategy is to:
Identify the Trend: Using the alignment of the 50, 100, and 200 MAs.
Wait for a Pullback: Identified by a fractal (pivot low or pivot high).
Confirm Entry Location: The fractal must form inside a key "support/resistance" zone (between MA 50/100 or MA 100/200).
Filter for Quality: The signal is then filtered for trend strength (ADX), momentum (RSI), and trend structure (MA separation) to reduce false signals.
⚙️ How It Works: Core Components
Triple Moving Averages:
Plots three MAs (defaulting to 50, 100, 200).
You can select the MA type (SMA, EMA, WMA, SMMA, HMA) and source.
Their alignment determines the trend direction.
Dual Pullback Zones: The script creates two distinct shaded zones on the chart:
Zone 1 (Gray): The area between the 50 MA and 100 MA.
Zone 2 (Blue): The area between the 100 MA and 200 MA.
ATR Buffer: You can (and should) enable an ATR-based buffer. This makes the zones "thicker" by adding/subtracting a small ATR multiple from the MAs, allowing the script to catch pullbacks that almost touch the MAs but reverse just before.
Fractal Signals:
Uses standard ta.pivotlow (for buys) and ta.pivothigh (for sells) to identify local turning points.
The fractal period (bars to the left and right) is adjustable.
🚦 Signal Logic: Rules for Entry
The indicator will plot a shape and send an alert when all the following conditions are met at the time the fractal was formed:
🚀 Buy Signal (Red Up-Triangle)
Uptrend: MA 50 is above MA 100, AND MA 100 is above MA 200.
Pullback Signal: A Low Fractal (pivotlow) is confirmed.
Location: The low of the fractal candle is inside Zone 1 (between 50/100) OR Zone 2 (between 100/200).
Filters (if enabled):
ADX: Trend strength is above the adxThreshold.
RSI: RSI is above the rsiBuyLevel (e.g., > 40), indicating the pullback isn't deeply oversold.
MA Distance: The MAs are sufficiently "spread out" (measured by ATR), confirming a stable trend.
📉 Sell Signal (Green Down-Triangle)
Downtrend: MA 50 is below MA 100, AND MA 100 is below MA 200.
Pullback Signal: A High Fractal (pivothigh) is confirmed.
Location: The high of the fractal candle is inside Zone 1 (between 50/100) OR Zone 2 (between 100/200).
Filters (if enabled):
ADX: Trend strength is above the adxThreshold.
RSI: RSI is below the rsiSellLevel (e.g., < 60), indicating the pullback isn't deeply overbought.
MA Distance: The MAs are sufficiently "spread out."
🔧 Settings & Inputs
MA Settings: Choose the MA Type, Source, and Lengths for all three MAs.
Zone Buffer: Toggle the ATR buffer on/off and set its ATR Length and Multiplier. A smaller multiplier (e.g., 0.25) keeps the zone tight to the MAs.
Fractal Period: Set the number of bars to the left/right to identify a fractal.
ATR Distance Filter: Toggle the filter and set the ATR Length and Min. Multiplier required for the MAs to be considered "spread out."
ADX Filter: Toggle the filter and set the DI Length, ADX Smoothing, and Min. Trend Strength threshold.
RSI Filter: Toggle the filter and set the RSI Length and the Buy/Sell Levels.
Script protetto
Questo script è pubblicato come codice protetto. Tuttavia, è possibile utilizzarlo liberamente e senza alcuna limitazione – per saperne di più clicca qui.
Declinazione di responsabilità
Le informazioni ed i contenuti pubblicati non costituiscono in alcun modo una sollecitazione ad investire o ad operare nei mercati finanziari. Non sono inoltre fornite o supportate da TradingView. Maggiori dettagli nelle Condizioni d'uso.