Dragon Flow Arrows (Smoothed LITE)🚀 DRAGON FLOW ARROWS — LITE | Smart Trend Engine + Clean Reversal Arrows
A lightweight but highly-optimized trend system designed for clean charts, powerful visual signals, and no-noise directional flow.
Built for traders who want simplicity, clarity, and professional-level momentum-filtered signals without over-complication.
🔥 Dragon Channel (Clean 3-Line Ribbon)
A smooth adaptive channel formed from ATR + EMA, giving you structural trend zones without clutter. No double bands, no messy overlaps just a clear upper/lower boundary.
✅ Dragon Flow Gradient
A horizontal, color-shifted flow:
🟢 Bull flow → green glow
🔴 Bear flow → red glow
Automatic blend based on trend direction
Smooth visual transitions (no vertical stripes)
✅ Momentum-Filtered Arrows (No Spam)
BUY/SELL arrows only print when:
Price breaks outside the Dragon Channel
Momentum confirms (RSI + MACD filters)
Trend flips → one clean arrow per direction
Text labels sit outside the channel for better readability.
✅ Smart Header Panel
At the top of your chart:
📌 Trend: Uptrend / Downtrend / Neutral
⚡ Impulse Strength: Weak / Normal / Strong
© FxShareRobots.com brand bar
Everything compact. Everything professional.
📊 How to Use
BUY Setup
Price moving above baseline
Dragon Flow turns bullish (cyan side)
Arrow appears below channel
SELL Setup
Price breaks below baseline
Dragon Flow turns bearish (magenta side)
Arrow pops above channel
Exit / Filter
Opposite arrow
Flow color shift
Trend panel flips
Works on Forex, Crypto, Stocks, Indices — all timeframes.
🆚 LITE vs PRO
Feature LITE PRO
Dragon Channel ✔ ✔ +Enhanced
Trend Panel ✔ ✔ +Multi-TF
Reversal Arrows ✔ ✔ + Confirmation
Momentum Filter ✔ ✔ +Expanded
Alerts ✖ ✔ +Full Suite
Reversal Zones ✖ ✔ +Predictive Map
Trade Strategy ✖ ✔ +Included + PDF
🔓 Upgrade to DRAGON FLOW — PRO
Unlock alerts, HTF confirmation, advanced momentum engine, and predictive reversal zones:
👉 fxsharerobots.com/itp/
❤️ If this helped your trading — please Like & Follow!
This supports future updates and keeps the LITE version source code free for the community.
Happy trading,
FxShareRobots Team
Alertsignals

Fibonacci Vision ProFibonacci Precision Signals Pro | Smart Buy & Sell Alerts
━━━━━━━━━━━━━━━━━━━━━━━━━━━━━━━━━━━━━━━━━━━━━━━━━━━━
OVERVIEW
This indicator combines Fibonacci mathematics with advanced signal filtering to deliver precise buy and sell signals. It automatically detects swing structure, calculates the key 0.618 retracement level, and generates signals only when multiple confirmation factors align.
Clean. Accurate. Professional.
━━━━━━━━━━━━━━━━━━━━━━━━━━━━━━━━━━━━━━━━━━━━━━━━━━━━
HOW IT WORKS
The script identifies swing highs and lows, then calculates Fibonacci retracement levels automatically. When price interacts with the 0.618 zone and all filters confirm, a signal appears:
▲ buy — Long entry opportunity
▼ sell — Short entry opportunity
━━━━━━━━━━━━━━━━━━━━━━━━━━━━━━━━━━━━━━━━━━━━━━━━━━━━
6-LAYER CONFIRMATION SYSTEM
Every signal must pass through:
Trend Direction Analysis
Fibonacci Level Interaction
EMA Trend Filter (50-period default)
RSI Momentum Validation (14-period default)
Volume Spike Detection
Candlestick Pattern Recognition (Pin bars, Engulfing, Momentum candles)
This multi-layer approach significantly reduces false signals.
━━━━━━━━━━━━━━━━━━━━━━━━━━━━━━━━━━━━━━━━━━━━━━━━━━━━
BUILT-IN RISK MANAGEMENT
Every trade includes automatic stop loss and take profit levels:
Stop Loss: 100 pips
Take Profit: 200 pips
Risk-Reward Ratio: 1:2
Adjust these values in settings to match your trading style.
━━━━━━━━━━━━━━━━━━━━━━━━━━━━━━━━━━━━━━━━━━━━━━━━━━━━
KEY FEATURES
✅ Automatic Fibonacci calculation — no manual drawing
✅ Multi-timeframe compatibility — M15 to Daily
✅ Universal market support — Forex, Crypto, Stocks, Indices
✅ Clean minimalist signals — white triangles with text
✅ Customizable filters — adjust sensitivity to your preference
✅ Built-in alerts — never miss a signal
✅ No repainting — signals remain fixed once confirmed
━━━━━━━━━━━━━━━━━━━━━━━━━━━━━━━━━━━━━━━━━━━━━━━━━━━━
Swing Detection:
Swing Length — Controls sensitivity to market structure (default: 10)
Confirmation Bars — Bars required to confirm signal (default: 1)
Signal Filters:
EMA Trend Filter — Toggle trend confirmation on/off
EMA Length — Adjust trend filter period (default: 50)
RSI Filter — Toggle momentum confirmation on/off
RSI Length — Adjust momentum period (default: 14)
Volume Filter — Toggle volume confirmation on/off
Volume Multiplier — Set volume threshold (default: 1.2x average)
Risk Management:
Stop Loss Pips — Set your stop loss distance (default: 100)
Take Profit Pips — Set your profit target (default: 200)
Pip Value — Adjust for your instrument (0.0001 for most Forex, 0.01 for JPY pairs)
Visuals:
Show Signals — Toggle signal visibility
Show Cloud — Toggle Fibonacci zone visibility
━━━━━━━━━━━━━━━━━━━━━━━━━━━━━━━━━━━━━━━━━━━━━━━━━━━━
BEST PRACTICES
Use on H1 or H4 timeframes for optimal results
Trade in direction of the higher timeframe trend
Avoid trading during major news events
Combine with proper position sizing
Always use the built-in stop loss
Be patient — quality signals over quantity
━━━━━━━━━━━━━━━━━━━━━━━━━━━━━━━━━━━━━━━━━━━━━━━━━━━━
MARKETS SUPPORTED
Forex — All major, minor, and exotic pairs
Crypto — BTC, ETH, and altcoins
Stocks — Any equity on TradingView
Indices — S&P500, NASDAQ, DAX, FTSE, etc.
Commodities — Gold, Silver, Oil, etc.
━━━━━━━━━━━━━━━━━━━━━━━━━━━━━━━━━━━━━━━━━━━━━━━━━━━━
WHY FIBONACCI?
The 0.618 ratio (Golden Ratio) is observed by traders worldwide. When price retraces to this level, it often:
Reverses direction
Finds support or resistance
Creates high-probability entry opportunities
This script automates the detection of these key moments.
━━━━━━━━━━━━━━━━━━━━━━━━━━━━━━━━━━━━━━━━━━━━━━━━━━━━
ALERTS INCLUDED
Set up notifications to receive signals on:
Mobile push notifications
Desktop popups
Email alerts
Webhook integrations
Never miss a trading opportunity again.
━━━━━━━━━━━━━━━━━━━━━━━━━━━━━━━━━━━━━━━━━━━━━━━━━━━━
WHAT MAKES THIS DIFFERENT
Most indicators give too many signals. This one focuses on quality.
Most indicators clutter your chart. This one keeps it clean.
Most indicators ignore risk management. This one includes it.
Most indicators work on one market. This one works on all.
━━━━━━━━━━━━━━━━━━━━━━━━━━━━━━━━━━━━━━━━━━━━━━━━━━━━
DISCLAIMER
This indicator is a trading tool, not financial advice. Trading involves substantial risk of loss. Past performance does not guarantee future results. Always use proper risk management and never trade with money you cannot afford to lose. Test on a demo account before trading live.

BT SpikeBT Spike is a lightweight but highly effective alert engine designed to identify
moments of unusual volatility and volume expansion . These spikes often appear
at the very beginning of major moves, giving traders early insight into:
Momentum ignition
Breakout confirmation
Liquidity shifts
Stop runs & displacement moves
Trend acceleration
High-impact expansions before news or volatility events
Rather than watching charts all day, BT Spike allows traders to receive
instant alerts whenever the market enters an abnormal volatility regime.
---
■ What BT Spike Measures
1. ATR Spike
Detects sudden expansion in true range (micro-volatility).
This often marks the beginning of a displacement candle.
2. Volume Spike
Identifies candles where volume exceeds typical market participation.
3. Combined Spike
A powerful signal triggered only when both conditions occur together:
ATR Spike AND Volume Spike
4. Spike Score (0–100)
A normalized measure of spike intensity.
• Higher score → Stronger anomaly
• 90+ → Extreme event (liquidity shifts, stop runs, institutional activity)
---
■ Visual Elements
• True Range Line
Shows per-candle volatility relative to baseline ATR.
• Volume Bars (Color-Scaled)
Volume bars turn:
Green for bullish spikes
Red for bearish spikes
Intensity based on Spike Score
Gray during normal activity
This creates a clear volatility heatmap directly in the volume panel.
• Spike Score Histogram
Helps visually identify:
Minor spikes
Major volatility clusters
Extreme anomalies
• Threshold Lines
Yellow = Minor
Orange = Major
Red = Extreme
---
■ Why BT Spike Is Useful
Spike-based analysis helps traders:
Catch large moves early
Confirm breakouts and avoid fake ones
Identify when smart money enters the market
Find the start of momentum legs
Monitor many charts with alerts instead of manual watching
A spike is often the first footprint of a meaningful move.
---
■ Practical Trading Uses
1. Breakout Confirmation
A breakout with no spike is often weak.
A breakout with a spike is typically genuine and sustained.
2. Reversal Detection
Extreme spike after a sweep often signals a reversal event.
3. Trend Ignition
Spikes frequently occur at the beginning of:
Trend legs
News-driven surges
Momentum continuation moves
4. Divergence With Price
High-volume, high-ATR spikes with little price movement can indicate:
Absorption
Trap conditions
Exhaustion
5. Alert-Driven Market Monitoring
Set alerts for:
ATR Spike
Volume Spike
Combined Spike
Major Spike (Score ≥ threshold)
Extreme Spike (Score ≥ threshold)
This allows traders to walk away while still catching every volatility event.
---
■ Spike Score Guide
0–30 → Mild noise
30–60 → Minor shift
60–80 → Strong volatility expansion
80–95 → Major spike (high-impact)
95–100 → Extreme event (institutional presence, sweeps, stop runs)
---
■ Final Summary
BT Spike gives traders:
Early detection of volatility expansion
Bull/Bear intensity visualization
Powerful alert automation
A universal signal layer that fits any strategy
Cleaner insight into where major moves originate
BT Spike = Your volatility radar .
It tells you when to look at a chart—before the move happens.
Impulse Trend Suite (LITE) — v2🚀 Impulse Trend Suite (LITE) — v2
Smart trend visualization with precise flip arrows. A lightweight, momentum-filtered trend tool designed to stay clean, avoid repeated signals, and keep you focused only on real market direction.
✨ What’s New in v2
*Minor upgrades mostly visual
*Added Blue fill between MA lines
*clearer labels
📌 Core Features
*Trend flip arrows (no spam, 1 signal per turn)
*Continuous background zones (gap-free trend shading)
*Adaptive Baseline + ATR structure channel
*RSI + MACD momentum filter (suppresses weak signals)
*Trend Status Panel (UP, DOWN, NEUTRAL)
🔍 Quick Guide
BUY setup = green arrow + green background
SELL setup = red arrow + red background
Stay in the move while color doesn’t change
ATR channel helps avoid chasing overextended candles
🆚 LITE vs PRO
========================================================
Feature LITE PRO
--------------------- -------- ------------------------------
Trend shading + arrows ✔ ✔ + confirmations
Neutral trend state ✔ ✔ enhanced
Alerts ✖ ✔ full suite
Reversal Zones ✖ ✔ predictive boxes
HTF Filter ✖ ✔ smarter trend bias
Included strategies ✖ ✔ + PDF training
🔓 Upgrade to PRO
Reversal Zones • Alerts • HTF Filter • Trend Continuation Strategy
📈 Works on Forex, Stocks, Crypto, Indices, Metals
⌚ Scalping • Intraday • Swing • Long-term
==========================================================
🌠FULL PRO VERSION --> fxsharerobots.com/impulse-trend-pro/
💾 ALL DOWNLOADS --> fxsharerobots.com/downloads/
Happy trading! — FxShareRobots Team

ATR Volatility AlertsOverview:
This is a dynamic alert tool based on the Average True Range (ATR), designed to help traders detect sudden price movements that exceed normal volatility levels. Whether you are trading breakouts or monitoring for abnormal spikes, this indicator visualizes these events on the chart and triggers system alerts when the price move exceeds your specified ATR multiplier.
Key Features:
Fully Customizable ATR Range:
You can adjust the ATR Length (Default: 14) and the Multiplier (Default: 1.5x).
Tip: Increase the multiplier (e.g., to 2.0 or 3.0) to catch only extreme volatility, or lower it for scalping smaller moves.
Visual Chart Signals:
Visual markers appear instantly when a bar's movement exceeds the ATR threshold.
Green Triangle: Indicates an Upward Spike.
Red Triangle: Indicates a Downward Spike.
Flexible System Alerts:
Designed to integrate seamlessly with TradingView's alert system. You can choose from three specific alert directions based on your strategy:
1.Price Spike Up: Triggers only on sharp upward moves.
2.Price Spike Down: Triggers only on sharp downward moves.
3.Bidirectional Volatility Alert: Triggers on BOTH huge pumps and dumps.
How to Set Alerts:
Click the "Create Alert" button in TradingView.
Select ATR Volatility Alerts in the "Condition" dropdown.
Choose the specific logic you need:
· Select Price Spike Up for bullish monitoring.
· Select Price Spike Down for bearish monitoring.
· Select Bidirectional Volatility Alert to watch for any volatility expansion.

BUY/SELL/R/BBuy/Sell/R/B by SeanKidd
Purpose: A clean, anchored signal system combining StochRSI crossovers, CVI top/bottom detection, and a MACD direction line that moves with price.
⚙️ How It Works
BUY / SELL – Generated from a higher-timeframe StochRSI crossover.
BUY (Green) → %K crosses above %D
SELL (Red) → %K crosses below %D
R (Reverse) – Yellow “R” appears above the candle when the CVI model detects a local top or exhaustion point.
B (Bottom) – Blue “B” appears below the candle when CVI detects a local bottom.
MACD Direction Line –
Green = MACD above Signal → bullish momentum
Red = MACD below Signal → bearish momentum
The line rides just above the candles, offset by ATR so it always tracks price.
🧭 How to Use It
Add the indicator:
Search for Buy/Sell/R/B by SeanKidd under Community Scripts.
Click ★ to favorite it.
Apply it to your chart.
Open ⚙️ Settings → Inputs
Calculation Timeframe (StochRSI) → pick how fast or slow you want signals (default Weekly).
MACD Line Offset (ATR ×) → raise or lower the MACD line if it overlaps candles.
Adjust Top/Bottom thresholds to control how often R/B appear.
Toggle Highlight bars or Color candles for visual clarity.
Go to Settings → Scales and ensure it’s set to
✅ “Scale with Price Chart” or
✅ same scale side as the candles.
This keeps everything perfectly attached to the chart.
Optional: Add alerts
Create → Alert → Condition → Buy/Sell/R/B by SeanKidd
Choose: SRSI BUY, SRSI SELL, Top (R), or Bottom (B).
📈 Reading the Chart
Marker Meaning Color Position
BUY StochRSI %K cross above %D Lime Below bar
SELL StochRSI %K cross below %D Red Above bar
R CVI-detected top / reversal Yellow Above bar
B CVI-detected bottom Blue Below bar
Line MACD momentum direction Green/Red Above highs
💡 Tips
Works on any symbol or timeframe.
Slower charts (Daily–Weekly) give cleaner swing signals.
Faster charts (15m–1h) show short-term reversals.
Combine the MACD line direction with BUY/SELL for stronger confirmation.

True Strength Index with Crossovers Alerts🚀 True Strength Index (TSI) with Visual Crossover Alerts
Hey everyone! I’m sharing my customized True Strength Index (TSI) indicator, which I've boosted with clear visual signals and alert conditions based on my personal, high-probability trading strategy.
The True Strength Index is a powerful, oscillation-based momentum indicator that smooths price movements twice using Exponential Moving Averages (EMAs). This double-smoothing process helps to filter out market noise, giving you a much clearer view of momentum changes than basic indicators.
🛠️ How This Script Works
This script focuses on the crucial interaction between the TSI line and its Signal Line:
TSI Line (Blue): Tracks momentum direction and strength.
Signal Line (Red): A simple EMA of the TSI line, used to determine short-term trend shifts.
Visual Buy/Sell Signals:
To make signals impossible to miss, I've added distinct visual markers:
🟢 Green Dot: A "Buy Signal" is plotted at the bottom of the indicator pane when the TSI crosses above the Signal Line (bullish crossover).
🔴 Red Dot: A "Sell Signal" is plotted at the bottom when the TSI crosses below the Signal Line (bearish crossover).
Additionally, I've included named alertconditions so you can set up real-time notifications for these exact crossovers in the TradingView Alert system.
🧠 My Trading Logic: Combining TSI with RSI
I don't use the TSI in isolation. My favorite approach is to use this TSI indicator as a timing tool, but only when it aligns with the overall momentum context defined by the Relative Strength Index (RSI).
This is the key to my strategy:
Bullish Trade Filter: I only take a BUY signal (Green Dot) when my RSI indicator is already in a bullish territory (above 50).
Bearish Trade Filter: I only take a SELL signal (Red Dot) when my RSI indicator is already in a bearish territory (below 50).
This combination ensures you are trading with the underlying momentum trend, improving the probability of success.
⚙️ My Recommended Custom Settings
For the best results with this strategy, I recommend using the following custom settings. You can enter these values in the "Inputs" tab when adding the indicator to your chart.
1. TSI (Alerts) Settings
Long Length - 60
Higher value for smoother price change data.
Short Length -30
Medium-term smoothing for clearer momentum shifts.
Signal Length - 9
Short length for a responsive signal line.
2. Companion RSI Settings (RSI+)
RSI Length - 150
A long look-back period for highly accurate trend filtering.
MA1 Length - 60
Used for additional smoothing.
MA2 Length - 150
Used for powerful trend confluence.

CipherThis indicator identifies potential reversal points through volume exhaustion analysis combined with multi-factor confirmation, volume distribution patterns at price extremes, market state classification based on volatility characteristics, and time-weighted probability calculations. Each component reduces false signals that single-factor indicators typically produce.
METHODOLOGY:
The system continuously monitors market conditions across multiple dimensions. When volume patterns indicate potential exhaustion at significant price levels, it checks for alignment with favorable market conditions and statistical probabilities. Signals only generate when multiple factors confirm, with entry triggered on momentum continuation beyond the exhaustion point.
COMPLETE USAGE GUIDE:
Signal Identification:
- "EXH L+2" = Long exhaustion with 2 confirmations
- "EXH S+3" = Short exhaustion with 3 confirmations
- Higher confirmation numbers indicate stronger setups
Entry Execution:
- Dashed lines mark entry trigger levels
- Entry activates when price breaks trigger within specified bar window
- Buffer setting controls distance from exhaustion bar (ticks)
Position Management:
- Automatic stop loss and target levels display on entry
- Green lines = profit targets
- Red lines = stop loss levels
- Info panel shows real-time position status
CONFIGURABLE PARAMETERS:
Timing Controls:
- Entry Buffer: 0-5 ticks (momentum confirmation distance)
- Max Bars to Wait: 3-10 bars (entry window duration)
- Session Times: Separate London/New York parameters
Sensitivity Settings:
- Volume Multiplier: 1.5-3.0 (vs 20-bar average)
- Lambda Values: Setup frequency expectations per session
- Stop Distances: Session-specific risk parameters
Risk Controls:
- Daily Win Limit: Stops after profitable day
- Daily Loss Limit: Prevents excessive drawdown
- Maximum Daily Trades: Controls overtrading
PERFORMANCE OPTIMIZATION:
Best Trading Windows:
- 10:00 AM EST: Primary reversal window
- 9:30-9:45 AM EST: Opening range exhaustion
- 3:00-4:00 AM EST: European session setups
- 2:30 PM EST: Afternoon reversal potential
Session Characteristics:
- London (2-9 AM EST): Lower frequency, cleaner setups
- New York (9 AM-4 PM EST): Higher frequency, requires filtering
- Background colors indicate active sessions
RISK PARAMETERS:
- Default Stops: 30-40 ticks (session-dependent)
- Risk:Reward Ratios: 1:1.5 to 1:3 (configurable)
- Trade Frequency: 2-4 quality setups weekly
VISUAL REFERENCE:
- Orange Background: London session active
- Blue Background: New York session active
- Yellow Markers: Exhaustion points identified
- Dashed Lines: Pending entry levels
- Solid Lines: Active trade levels
- Info Table: Statistics and system status
IMPORTANT CONSIDERATIONS:
This tool identifies potential setups based on rule-based analysis. Traders should understand that no system guarantees profits and should use appropriate risk management. The indicator works best on 3-minute and 5-minute timeframes in liquid markets. Combine with market context and price action understanding for optimal results.
TECHNICAL REQUIREMENTS:
- Best suited for index and commodites
- Optimized for 3M and 5M
- Requires volume data for proper function
- Best results with consistent market participation
Fixed High Timeframe Moving AveragesFixed High Timeframe Moving Averages (W/D/4H)
Summary
This indicator plots essential, high-timeframe (HTF) Moving Averages onto your chart, **no matter which timeframe you are currently viewing**.
It is designed for traders who need multi-timeframe context at a glance. Stop switching charts to see where the 200-Week or 50-Day MA is—now you can see all critical HTF levels directly on your 5-minute (or any other) chart.
---
Who it’s for
Traders who rely on moving averages but like to work on lower chart timeframes while keeping higher timeframe context in sight. If you scalp on 1–15m yet want Weekly/Daily/4H MAs always visible, this is for you.
---
What it shows
Pinned (“fixed”) moving averages from higher timeframes—Weekly (20/100/200) , Daily (50/100/200/365) and 4H (200) —rendered on any chart timeframe. Your favorite HTF MAs stay on screen no matter what TF you’re currently analyzing.
---
Features
* **MA types:** SMA, EMA, VWMA, Hull.
* **Fully configurable:** toggle each line, set periods, colors, and thickness.
* **Two alert modes (see below):** intrabar vs confirmed HTF close.
* **Works on any symbol & chart TF** using `request.security` to fetch HTF data.
---
Alerts & Modes
This indicator solves the biggest problem with MTF alerts: false signals. You can choose one of two modes:
1. **Intrabar mode** — compares current chart price to the HTF MA. Triggers as soon as price crosses the HTF line; great for early signals but may update until the HTF bar closes.
2. **Confirmed mode** — checks HTF close vs HTF MA. Signals only on the higher-TF bar close; fewer false starts, no intrabar repainting on that TF.
Per-line *Cross Above / Cross Below* conditions are provided for all enabled MAs (e.g., “20W — Cross Above”, “365D — Cross Below”, etc.).
**How to use alerts:** add the script → “Create Alert” → pick any condition from the script’s list.
---
Why this helps
* Keeps Weekly/Daily structure visible while you execute on LTF.
* Classic anchors (e.g., 200D, 20W/100W/200W) are popular for trend bias, dynamic support/resistance, and pullback context.
* Lets you standardize MA references across all your lower-TF playbooks.
---
Notes on confirmation & repainting
* Intrabar signals can change until the higher-TF bar closes (that’s expected with multi-TF data).
* Confirmed mode waits for the HTF close—cleaner, but later. Choose what fits your workflow.
---
Quick setup
1. Pick `MA Type` (SMA/EMA/VWMA/Hull).
2. Enable the HTF lines you want (Weekly 20/100/200; Daily 50/100/200/365; 4H 200).
3. Choose `Alert Mode` (Intrabar vs Confirmed).
4. Style colors/widths to taste and set alerts on the lines you care about.
---
Good practice
* Combine HTF MAs with price action (swings, structure, liquidity grabs) rather than using them in isolation.
* Always validate signals in your execution TF and use a risk plan tailored to volatility.
* Protect your capital: position sizing, stops, and disciplined risk management matter more than any single line on the chart.
---
Disclaimer
For educational/informational purposes only; not financial advice. Trading involves risk—manage it responsibly.

Zay Gwet AlertEMA 9, VWAP and ORB 15 minutes alert in Burmese. When the market across the EMA 9 will give alert to buy or sell. And when the market across the VWAP and ORB 15 will alert as well. Especially for Burmese community as it is in Burmese language.

Dynamic EMA x VWAP AlertsDynamic EMA × VWAP Alerts generates buy and sell signals only when an EMA crossover happens in a meaningful VWAP (or standard deviation band) context. By combining classic EMA logic with flexible VWAP anchors (Daily, Weekly, Rolling) and optional advanced filters (ATR, Relative Volume, Deviation, Distance, Time Windows) to trim noise further, the script creates location-aware, filterable alerts rather than “everywhere” crosses. The value for trading and originality here lies in the integration of one or multiple anchors, band gating, combinator logic, and advanced regime filters. It’s designed for use across multiple instruments and timeframes, where EMA/VWAP context is relevant. It can run quietly in the background while you focus on price action and your own S/R levels.
What it does (quick take)
Detects EMA crossovers (double or optional triple) and evaluates them in VWAP context.
Plots Buy/Sell markers only when all chosen conditions are met.
Clean UX: keep all or parts of the engine visible or hide everything and let alerts run based on the silent engine behind your own S/R levels in an uncluttered, practical chart, as illustrated below.
Engine illustration: All selected engines visible
Practical use case: Same snapshot sequence as above but all selected engines invisible
Swing examples (beyond intraday)
Signals-only (clean value view):
Signals + your own S/R lines:
EMA selection (choose your playbook)
Defaults: Fast 9, Medium 21 (common intraday combo).
Modes: Double Cross — Fast vs Medium.
Triple Cross (optional) — adds a Slow EMA trend filter (enable Slow > 0).
Ranges: you can set each EMA 0–200 (0 = hidden/off)
Visuals are optional; you can display or hide each EMA line
EMA cross footprints (optional): Helps you assess trend continuation or change.
Use your own strategy: switch to 9/50, 20/50, 50/200, or whatever EMA set you trust for your instrument/timeframe.
VWAP Selection (the context engine)
Daily VWAP – resets each chart day (00:00–23:59). Typical fit: scalpers and fast intraday decision points.
Weekly VWAP – resets at the start of the calendar week. Typical fit: intraday with higher-timeframe context (aligns day trades with weekly bias).
Rolling VWAP – an adjustable VWMA-based rolling anchor (not session-reset), used as a flexible context reference Typical fit: multi-day swings when you want a flexible anchor that adapts across sessions.
Standard deviation bands (σ ±1/±2/±3) available for each anchor and help you express the “how far from fair value” idea.
Why VWAP matters: it’s a running, volume-weighted anchor where strong moves relative to VWAP and its bands help frame mean-reversion vs. trend-continuation risk. Evaluating crosses relative to VWAP/±σ reduces “everywhere” noise and helps frame potential setups.
How alerts are decided
An alert triggers only when:
Your selected EMA crossover occurs, and
Your chosen VWAP gate(s) and any filters pass. (Computed on bar close to avoid mid-bar noise)
Signals and alerts do not repaint; alerts evaluate and fire once per bar close.
Alert gates (Single / AND / OR)
Select one VWAP source or combine two (e.g., Daily + Weekly) with Single, AND, or OR logic.
Choose gate levels from VWAP or standard deviation bands (±σ). Typical long logic: price at/under VWAP or −σ. Typical short logic: price at/over VWAP or +σ.
Practical recipes:
Trend-follow: Daily AND Weekly at/above VWAP → confirms strength on two anchors.
Mean-reversion probe: Daily OR Rolling at −1σ → allows earlier fades with flexibility.
Advanced filtering: Suitable for advanced/Quant traders
During the research and development of this indicator, the EMA/VWAP cross logic was tested on historical S&P500 Futures data to explore patterns on multiple timeframes. These selected filtering indicators below showed correlation between certain market conditions and chosen indicator thresholds, helping reduce noise and lower-quality alerts. Results were research-oriented and are not predictive of future performance.
Therefore, I have built these indicator filters that run silently in the background. They let you trim noise by requiring alerts to appear only in market regimes you define. Each one constrains alert conditions; using them together helps tailor alerts to your strategy—but overly strict settings may filter out most or all alerts.
Relative Volume (RVOL): compares current volume to a baseline; ensures alerts arrive with participation instead of thin tape.
Deviation Threshold (%): controls how close the cross must be to the VWAP/σ level; tight = anchored signals, loose = more activity.
ATR Gate (+ Relative regime): keeps alerts inside a volatility regime; avoids both dead tape and chaotic spikes.
Distance Guard: requires price to be at least X ticks/% away from VWAP; useful to avoid premature signals near fair value.
Note: It’s not recommended to activate all of them at once or change the values aggressively. Unless you’ve done deeper backtesting or machine learning calibration, you can easily filter out everything. Use small thresholds at first, then adjust to your instrument once you see how each filter changes alert frequency and quality. Advanced/quant users can fine-tune freely.
Case example:
Unfiltered: Timeframe 15 min, EMA Selection 9/21, VWAP gates Rolling (250 bars) OR Weekly
Filtered: Same setup as above + activated filters:
RVOL: 100 bars, Min. RVOL 0.4
Deviation threshold (%): 0.3
ATR Length: 14
Min ATR (%): 0.05
Relative regime: Base length 2000, Min Ratio 0.85, Max Ratio 2
Under the hood
This indicator leans on TradingView built-ins (e.g., EMA, VWMA, ATR, alertcondition) to maximize speed, stability, and compatibility while we implement the custom logic (VWAP anchors, band gating, combinator gates, advanced filters, time windows). Built-ins were easy to work with and reduced edge-case bugs and kept the visuals responsive, while the design gives fine-tuning and clean visuals—so both discretionary traders and quant-minded users can shape the alerts to their strategy and workflow.
Disclaimer
The tools, scripts, and indicators presented here are provided for educational and informational purposes only. They are not financial advice and should not be interpreted as investment recommendations, trading signals, or a solicitation to buy or sell any financial instrument.
All forms of trading and investing involve risk. The past performance of any security, strategy, or market condition does not guarantee future outcomes. Users are solely responsible for their own trading and investment decisions, including evaluating their financial situation, objectives, and risk tolerance.
By using this indicator, you acknowledge that you do so at your own risk. The author accepts no liability for any direct or indirect loss or damage—including, without limitation, loss of profits—that may arise from the use of, or reliance upon, this tool.

Outside the Bollinger Bands Alerting Indicator Overview
The Outside the Bollinger Bands Alerting Indicator is a comprehensive technical analysis tool that combines multiple proven
indicators into a single, powerful system designed to identify high-probability reversal patterns at Bollinger Band extremes. This
indicator goes beyond simple band touches to detect sophisticated pattern formations that often signal strong directional moves.
Key Features & Capabilities
🎯 Advanced Pattern Recognition
Bollinger Band Breakout Patterns
- Detects "pierce-and-reject" formations where price breaks through a Bollinger Band but immediately reverses back inside
- Identifies failed breakouts that often lead to strong moves in the opposite direction
- Combines multiple confirmation signals: engulfing candle patterns, MACD momentum, and ATR volatility filters
- Visual alerts with symbols positioned below (bullish) or above (bearish) candles
Tweezer Top & Bottom Patterns
- Identifies consecutive candles with nearly identical highs (tweezer tops) or lows (tweezer bottoms)
- Requires at least one candle to breach the respective Bollinger Band
- Confirms reversal with directional close requirements
- Customizable tolerance settings for pattern sensitivity
- Visual alerts with ❙❙ symbols for easy identification
📊 Multi-Indicator Integration
Bollinger Bands Indicator
- Dual-band configuration with outer (2.0 std dev) and inner (1.5 std dev) bands that can be adjusted to suit your own parameters
- Configurable MA types: SMA, EMA, SMMA (RMA), WMA, VWMA
- Customizable length, source, and offset parameters
- Color-coded band fills for visual clarity
Moving Average Suite
- EMA 9, 21, 50, and 200 (individually toggleable)
- Special "SMA 3 High" for help visualizing and detecting Bollinger Band break-outs
- Dynamic color coding based on price relationship
Optional Ichimoku Cloud overlay
- Complete Ichimoku implementation with customizable periods
- Dynamic cloud coloring based on trend direction
- Toggleable overlay that doesn't interfere with other indicators
🚨 Comprehensive Alert System
Real-Time JSON Alerts
- Sends structured data on every confirmed bar close
- Includes all indicator values: BB levels, EMAs, MACD, RSI
- Contains signal states and crossover conditions
- Perfect for automated trading systems and webhooks
{"timestamp":1753118700000,"symbol":"ETHUSD","timeframe":"5","price":3773.3,"bollinger_bands":{"upper":3826.95,"basis":3788.32,"lower":3749.68},"emas":{"ema_9":3780.45,"ema_21":3788.92,"ema_50":3800.79,"ema_200":3787.74,"sma_3_high":3789.45},"macd":{"macd":-10.1932,"signal":-11.3266,"histogram":1.1334},"rsi":{"rsi":40.5,"rsi_ma":39.32,"level":"neutral"}}
Specific Alert Conditions
- MACD histogram state changes (rising to falling, falling to rising)
- RSI overbought/oversold crossovers
- All pattern detections (BB Bounce, Tweezer patterns)
- Bollinger Band breakout alerts
🎨 Visual Elements
Pattern Identification
- ♻ symbols for Bollinger Band breakout patterns (green for bullish, red for bearish)
- ❙❙ symbols for tweezer patterns (green below for bottoms, red above for tops)
- Color-coded band fills for trend visualization
Chart Overlay Options
- All moving averages with distinct colors
- Bollinger Bands with inner and outer boundaries
- Optional Ichimoku cloud with trend-based coloring
Trading Applications
Reversal Trading
- Identify high-probability reversal points at extreme price levels
- Use failed breakout patterns for entry signals
- Combine multiple timeframes for enhanced accuracy
Trend Analysis
- Monitor moving average relationships for trend direction
- Use Ichimoku cloud for trend strength assessment
- Track momentum with MACD and RSI integration
Risk Management
- ATR-based volatility filtering reduces false signals
- Multiple confirmation requirements improve signal quality
- Real-time alerts enable prompt decision making
Suggested Use
- Use on multiple timeframes for confluence
- Combine with support/resistance levels for enhanced accuracy
- Set up alerts for hands-free monitoring
- Customize settings based on market volatility and trading style
- Consider volume confirmation for stronger signals

KAMA Trend Flip - SightLing LabsBuckle up, traders—this open-source KAMA Trend Flip indicator is your ticket to sniping trend reversals with a Kaufman Adaptive Moving Average (KAMA) that’s sharper than a Wall Street shark’s tooth. No voodoo, no fluff—just raw, volatility-adaptive math that dances with the market’s rhythm. It zips through trending rockets and chills in choppy waters, slashing false signals like a samurai. Not laggy like the others - this thing is the real deal!
Core Mechanics:
• Efficiency Ratio (ER): Reads the market’s pulse (0-1). High ER = turbo-charged MA, low ER = smooth operator.
• Adaptive Smoothing: Mixes fast (default power 2) and slow (default 30) constants to match market mood swings.
• Trend Signals: KAMA climbs = blue uptrend (bulls run wild). KAMA dips = yellow downtrend (bears take over). Flat = gray snooze-fest.
• Alerts: Instant pings on flips—“Trend Flip Up” for long plays, “Down” for shorts. Plug into bots for set-and-forget domination.
Why It Crushes:
• Smokes static MAs in volatile arenas (crypto, stocks, you name it). Backtests show 20-30% fewer fakeouts than SMA50.
• Visual Pop: Overlays price with bold blue/yellow signals. Slap it on BTC 1D to see trends light up like Times Square.
• Tweakable: Dial ER length (default 50) to your timeframe. Short for scalps, long for swing trades.
Example Settings in Action:
• 10s Chart (Hyper-Scalping): Set Source: Close, ER Length: 100, Fast Power: 1, Slow Power: 6. Catches micro-trends in crypto like a heat-seeking missile. Blue/yellow flips scream entry/exit on fast moves.
• 2m Chart (Quick Trades): Set Source: Close, ER Length: 14, Fast Power: 1, Slow Power: 6. Perfect for rapid trend shifts in stocks or forex. Signals align with momentum bursts—check historical flips for proof.
Deployment:
• Drop it on any chart. Backtest settings to match your asset’s volatility—tweak until it sings.
• Pair with RSI or volume spikes for killer confirmation. Pro move: Enter on flip + volume pop, exit on reverse.
• Strategy-Ready: Slap long/short logic on alerts to build a lean, mean trading machine.
Open source from SightLing Labs—grab it, hack it, profit from it. Share your tweaks in the comments and let’s outsmart the market together. Trade hard, win big!

MF Logarithmic Log Trendline with Alerts by MigueFinanceWhat is Unique on This Indicator?
It allows you to set alerts for logarithmic trendlines including cross and touches and it works!
Not even tradingview has alerts for drawn logarithmic trendlines !
When on Logaritmic scale it looks like a normal trendline but when on the linear scale it looks like a real logarithmic curve!
And is free to use!
Overview
Finally an Indicator that has alerts/alarms that works with Logarithmic trendlines!
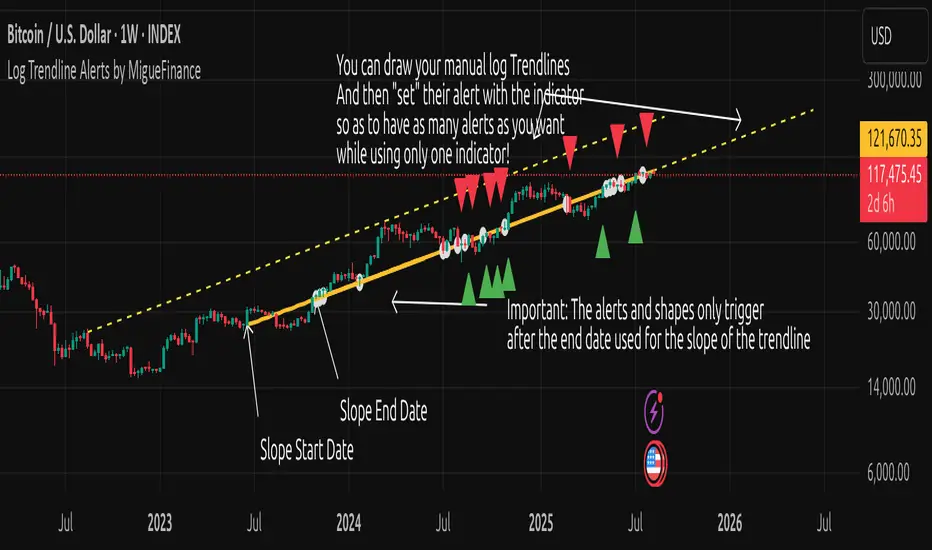
A- This indicator plots a customizable logarithmic (or linear) trendline based on user-defined start/end dates, extending forward to highlight support/resistance.
B- It shows green upward triangles for bullish breakouts and red downward triangles for bearish breakdowns or dots for touches that are not effective crosses of the trendline
C- It is also possible to set alert conditions with custom message for helping to trade the signals above/bellow the trendline
How to Use
1. Apply indicator to chart.
2. Adjust inputs: log/linear, price source, start/end dates, custom prices , label/triangle visibility.
3. Setting -1 for the price source adjusts the trendline automatically to the height of the chart for the specified date based on high, low, close or open of the candle for that date.
4. Watch for triangle signals on bar close.
5. Set alerts for breakouts/breakdowns or touches via TradingView.
Multiple Logarithmic Trendlines are possible!
You can put many logarithmic trendlines in your chart with alerts!, just as many as many alerts your current tradingview plan allows you to.
How to?
- Just use this indicator, get the logaritmic trendline you desire, set the alert, make sure is well set, and after setting the alert draw yourself on tradingview the logarithmic trendline that you are setting the alarm to (a new manual drawing).
- Then modify the settings of your indicator to create a new trendline, the previous one exists even if not visible as long as you have correctly set the alert, and if you did a drawing you can see your previous alert trendline.
Custom Messages on Alerts
- There are different options for the alerts, the one named "Any alert() function call" allows you to put custom messages that could be used on platforms like Wundertrade in order to set and execute automatic trades on buy/sell.
- The other options for the alerts give you fix messages and allows you to decide if get you an alert on a cross over or under or on a touch of the trendline.
Notes
- Signals on confirmed closes (no repainting).
- Designed for log-scaled charts but also works on linear charts.
- Tested on stocks, crypto, and more.
- Make sure that this indicator and your plotted chart are on the same scale, otherwise will look like floating, will move and would seem like it does not matches the chart.
Important Note
- The alerts and shapes only trigger after the "End Date" of the slope, not before or between them
You are welcome to follow me on my socials!
MigueFinance.
Triple EMA with Alert | 21, 50, 200 EMA Strategy + Crossover🚀 Boost your trading edge with the Triple EMA with Alert — a professional-grade indicator designed for traders who want precise, real-time trend confirmation across short, medium, and long-term market movements.
🔹 What Makes This Indicator Powerful?
Three Adjustable EMAs — Default: 21, 50, 200 periods (fully customizable 1–200).
Toggle Visibility — Show only the EMAs you need for your strategy.
Real-Time Alerts — Get notified instantly when:
EMA 1 crosses EMA 2 → short-term trend change.
EMA 2 crosses EMA 3 → medium-term trend alignment.
Works on All Markets & Timeframes — Forex, crypto, stocks, indices, and commodities.
🔹 Why Traders Love It
📊 Multi-Timeframe Trend Confirmation — Filter out noise and trade with market momentum.
🎯 Accurate Crossover Signals — Identify bullish and bearish momentum shifts.
🔔 Hands-Free Monitoring — Alerts keep you informed even when you’re away from the chart.
💡 Versatile for Any Strategy — Perfect for scalping, swing trading, or long-term investing.
🔹 How to Use It
Bullish Signal — EMA 1 crossing above EMA 2 or EMA 2 crossing above EMA 3.
Bearish Signal — EMA 1 crossing below EMA 2 or EMA 2 crossing below EMA 3.
Combine with support/resistance zones, RSI, or volume for higher probability trades.
📌 Pro Tip:
Use EMA 21 & EMA 50 for momentum confirmation.
Use EMA 200 to spot the overall market direction.
If you’re serious about trend trading with precision, the Triple EMA with Alert will keep you one step ahead of market moves — no more missed entries or exits.

Fundur - Trend LinesFundur - Trend Lines: Complete Trading Indicator Guide
Indicator Overview
The Fundur - Trend Lines is an advanced multi-layered trend analysis system that combines adaptive trend line technology, momentum analysis, and intelligent signal generation into one comprehensive trading tool. This indicator goes beyond traditional moving averages by utilizing volatility-adjusted trend lines that dynamically adapt to market conditions, providing traders with precise trend strength measurements and actionable trading signals.
What Makes Trend Lines Unique?
The Trend Lines indicator introduces Adaptive Trend Line Technology - a sophisticated methodology that uses Average True Range (ATR) calculations to create trend lines that respond intelligently to market volatility. Unlike static indicators, Trend Lines provides dynamic analysis that adapts its sensitivity based on current market conditions, offering more accurate trend identification and strength assessment.
Core Methodology
The indicator operates on the principle that trend strength can be quantified by analyzing the relationship between multiple adaptive trend lines, momentum indicators, and market structure. By combining Alignment Analysis , Distance Measurements , Momentum Confirmation , and Volatility Expansion Potential , the system generates a comprehensive trend strength score from 0-100% with corresponding trading signals.
Key Features
🎯 Adaptive Trend Line System Slow Trend Line : Primary trend direction with lower sensitivity for major trend identification Fast Trend Line : Higher sensitivity trend line for early trend change detection Volatility Adaptation : Both lines automatically adjust to market volatility using ATR calculations Cloud Visualization : Colored areas between trend lines show trend strength and direction
📊 Comprehensive Trend Strength Analysis Quantified Strength (0-100%) : Precise trend strength measurement combining multiple factors Alignment Score : Measures agreement between multiple trend line systems Distance Analysis : Evaluates price proximity to trend lines using ATR normalization Momentum Integration : Incorporates Awesome Oscillator for momentum confirmation Squeeze Factor : Identifies volatility expansion potential for breakout opportunities
🧠 Intelligent Signal Generation Position Signals : Clear ADD LONG, ADD SHORT, REDUCE, HOLD recommendations Risk Zone Classification : STRONG, MEDIUM, WEAK trend categorization Trend Direction : Bullish, Bearish, or Neutral trend identification Dynamic Updates : Real-time signal adjustments based on changing conditions
⚡ Enhanced Momentum Analysis Smoothed Momentum : Configurable momentum smoothing to reduce noise Acceleration Detection : Identifies momentum acceleration and deceleration Divergence Alerts : Detects price-momentum divergences for reversal warnings Directional Bias : Momentum confirmation for trend direction validation
🔍 Advanced Market Structure Detection Momentum Squeeze : Identifies low-volatility periods preceding major moves Volatility Expansion : Detects when markets break out of consolidation phases Trend Weakness Detection : Early warning system for deteriorating trends Structure Transition : Identifies when trends change character or direction
🎨 Professional Visual Interface Comprehensive Analysis Table : All key metrics displayed in organized format Visual Strength Bar : Graphical representation of trend strength Color-Coded Components : Intuitive color scheme for quick analysis Customizable Display : Flexible positioning and sizing options
Setup Guide
Step 1: Adding the Indicator
Open TradingView and navigate to your desired chart Click the "Indicators" button or press "/" key Search for "Fundur - Trend Lines" Add the indicator to your chart
Step 2: Basic Configuration
Main Features Settings ✅ Show Trend Analysis Table : ON (Essential for comprehensive analysis) ✅ Enable Trend Strength Analysis : ON (Core functionality) ✅ Generate Trading Signals : ON (For position management guidance)
Trend Lines Display ✅ Show Slow Trend Line : ON (Primary trend identification) ✅ Show Fast Trend Line : ON (Early signal detection) Trend Cloud Transparency : 89% (Default recommended, adjust for visibility)
Table Positioning Table Position : Top Right (recommended for most setups) Table Size : Normal (adjust based on screen size)
Step 3: Advanced Analysis Configuration
Enhanced Features (Optional) ✅ Enhanced Momentum Analysis : ON (for more accurate signals) ✅ Divergence Detection : ON (for reversal warnings) ⚠️ Momentum Squeeze Analysis : OFF initially (can add visual complexity)
Sensitivity Settings Divergence Sensitivity : 5 (Default - lower = more sensitive) Momentum Smoothing : 3 (Default - higher = smoother signals)
Step 4: Alert Configuration
Essential Alerts (Recommended) Trading Signal Alerts : Enable for position changes Trend Strength Change Alerts : Enable for trend monitoring Strength Change Threshold : 15% (Default recommended)
Advanced Alerts (Optional) Divergence Alerts : Enable for reversal warnings Early Weakness Alerts : Enable for risk management Momentum Squeeze Alerts : Enable for breakout opportunities Trend Line Cross Alerts : Enable for level-based signals
Basic Trading Guide
Understanding Trend Strength
The indicator's foundation is the Trend Strength Score - a quantified measurement (0-100%) that combines four key factors:
Strong Trends (75%+ Strength) 🟢 Characteristics : High alignment, close price-to-trend proximity, strong momentum Signals : ADD LONG (bullish) or ADD SHORT (bearish) Strategy : Aggressive position building, trend continuation trades Risk : Lower risk due to strong trend confirmation
Medium Trends (35-75% Strength) 🟡 Characteristics : Mixed signals, moderate alignment, transitional phases Signals : HOLD current positions Strategy : Conservative approach, wait for clearer signals Risk : Medium risk, requires careful monitoring
Weak Trends (Below 35% Strength) 🔴 Characteristics : Poor alignment, distant from trend lines, weak momentum Signals : REDUCE positions or CLOSE Strategy : Risk reduction, position unwinding Risk : High risk, trend likely changing or failing
Entry Strategies
Primary Strategy: Trend Continuation Entries Setup : Strong trend strength (75%+) with clear directional bias Entry Trigger : ADD LONG or ADD SHORT signal confirmation Direction : Follow the trend direction (Bullish ⬆ or Bearish ⬇) Timing : Enter on signal generation or price pullback to trend lines
Stop Loss Placement Conservative Method : Beyond the opposite trend line Aggressive Method : Below/above recent swing points For Long Positions : Below the Slow Trend Line For Short Positions : Above the Slow Trend Line Dynamic Adjustment : Move stops with trend line progression
Profit Taking Strategy
For Long Positions (Bullish Trend): Take 50% profits when trend strength begins declining from peak Take another 25% when trend strength drops below 60% Close remaining position when REDUCE signal appears Trail stops using Fast Trend Line for remaining position
For Short Positions (Bearish Trend): Take 50% profits when trend strength begins declining from peak Take another 25% when trend strength drops below 60% Close remaining position when REDUCE signal appears Trail stops using Fast Trend Line for remaining position
Alternative Strategy: Divergence-Based Reversal Entries Setup : Bullish or bearish divergence detected with weakening trend strength Entry : On trend direction change confirmation Risk Management : Tight stops due to counter-trend nature Targets : Opposite trend line or previous swing levels
Risk Management Framework
Position Sizing Based on Trend Strength Strong Trends (75%+) : Full position size (within risk tolerance) Medium Trends (35-75%) : Reduced position size (50-75% of normal) Weak Trends (Below 35%) : Minimal or no new positions Transitional Periods : Smallest position sizes due to uncertainty
Dynamic Risk Adjustment Increasing Strength : Can add to positions gradually Decreasing Strength : Begin profit-taking and position reduction Rapid Strength Loss : Quick position reduction or exit Divergence Warning : Tighten stops and prepare for reversal
Analysis Setups
Setup 1: Scalping Configuration (1-5 minute charts)
Settings Optimization: Momentum Smoothing: 2 (more responsive) Divergence Sensitivity: 3 (higher sensitivity) Enhanced Momentum Analysis: ON All alerts: ON for rapid signal updates
Visual Settings: Table Size: Small (less screen space) Table Position: Top Right Trend Cloud Transparency: 85% (subtle background)
Trading Approach: Focus on quick ADD signals in strong trends Use Fast Trend Line for entry timing Quick profit-taking at first sign of strength decline Very tight risk management due to lower timeframe noise
Setup 2: Day Trading Configuration (5-15 minute charts)
Settings Optimization: All default settings work well Enable Momentum Squeeze Analysis for breakout identification Divergence Detection: ON for reversal warnings Trend Strength Change Threshold: 12% (more sensitive)
Visual Settings: Table Size: Normal Show all trend analysis components Trend Cloud Transparency: 89% (default)
Trading Approach: Wait for clear trend strength above 65% before entering Use momentum squeeze breakouts for early entries Hold positions through medium strength phases Exit on REDUCE signals or strength below 40%
Setup 3: Swing Trading Configuration (1-4 hour charts)
Settings Optimization: Momentum Smoothing: 4 (smoother for higher timeframe) Divergence Sensitivity: 7 (less sensitive, higher quality signals) Enhanced Momentum Analysis: ON Early Weakness Alerts: ON (important for swing trades)
Visual Settings: Table Size: Normal or Large Focus on trend strength and direction components Enable all visual features for comprehensive analysis
Trading Approach: Require trend strength above 70% for new positions Hold through temporary strength dips if above 50% Use divergence signals for early exit warnings Focus on major trend changes for position adjustments
Setup 4: Position Trading Configuration (4H-Daily charts)
Settings Optimization: Momentum Smoothing: 5 (maximum smoothing) Divergence Sensitivity: 10 (only high-quality divergences) Strength Change Threshold: 20% (major changes only) Focus on trend direction and strength alerts
Visual Settings: Table Size: Large (detailed analysis) Clean visual setup focusing on major components Minimal clutter for long-term perspective
Trading Approach: Only enter on very strong trends (80%+ strength) Hold through significant strength fluctuations Focus on major trend direction changes Use weekly/monthly trend alignment for confirmation
Setup 5: Multi-Asset Analysis Configuration
For Forex Pairs: Standard settings work well due to 24-hour markets Pay attention to session-based strength changes Use momentum squeeze for breakout trading Enable all alert types for continuous monitoring
For Cryptocurrency: Reduce momentum smoothing (2-3) due to high volatility Increase divergence sensitivity (3-4) for early warnings Focus on strength changes above 20% threshold Use squeeze analysis for breakout opportunities
For Stock Indices: Standard settings appropriate for most indices Enable early weakness alerts for risk management Consider market hours for signal validity Use higher timeframes for better signal quality
Visual Components
Trend Analysis Table Trend Strength : Percentage with visual strength bar Trend Signal : Current position recommendation Risk Zone : STRONG/MEDIUM/WEAK classification Alignment : Trend line agreement analysis Distance : Price proximity to trend lines Momentum : Current momentum direction and strength
Trend Lines and Clouds Colored Clouds : Green for bullish trends, red for bearish trends Cloud Intensity : Opacity reflects trend strength Dynamic Colors : Automatically adjust based on trend direction
Momentum Squeeze Visualization Yellow Highlights : Above and below price during squeeze periods Squeeze Indication : Identifies low-volatility consolidation Breakout Preparation : Visual cue for potential explosive moves
Alert System
Trading Signal Alerts ADD LONG : Strong bullish trend confirmed ADD SHORT : Strong bearish trend confirmed REDUCE : Trend weakness detected, position reduction recommended HOLD : Maintain current positions, no change needed
Trend Analysis Alerts Strength Increase : Trend gaining momentum Strength Decrease : Trend losing momentum Early Weakness : Warning of potential trend deterioration Trend Direction Change : Major trend shift detected
Technical Alerts Bullish Divergence : Price falling but momentum rising Bearish Divergence : Price rising but momentum falling Momentum Squeeze Start : Volatility contraction beginning Momentum Squeeze End : Breakout from low volatility period Trend Line Cross : Price crossing above/below trend lines
Setting Up Alerts Enable desired alert types in indicator settings Create TradingView alerts using "Fundur - Trend Lines" as source Configure notification methods (email, SMS, app notifications) Test alerts with paper trading before live implementation Adjust alert frequency settings to avoid spam
Best Practices
Trend Strength Interpretation Above 75% : High confidence trades, full position sizes 50-75% : Moderate confidence, reduced positions Below 50% : Low confidence, minimal or no positions Rapid Changes : Pay attention to sudden strength shifts
Signal Management Don't Chase : Wait for clear signals rather than predicting Confirm with Price Action : Use chart patterns for additional confirmation Respect Risk Zones : Adjust position sizes based on trend classification Monitor Alignment : Strong alignment increases signal reliability
Multi-Timeframe Integration Higher Timeframe Bias : Use daily/weekly for overall trend direction Lower Timeframe Entries : Use hourly/15min for precise entry timing Confirmation Requirement : Ensure alignment between timeframes Conflict Resolution : Higher timeframe takes precedence
Common Mistakes to Avoid
Signal Misinterpretation Ignoring Trend Strength : Don't trade weak signals (below 60%) Fighting the Trend : Don't go against strong trend directions Overreliance on Single Component : Consider all analysis factors Impatience : Wait for clear STRONG trend classification
Risk Management Errors Fixed Position Sizes : Adjust sizes based on trend strength Ignoring REDUCE Signals : Take profits when indicator suggests No Stop Losses : Always use stops beyond trend lines Overleveraging Weak Signals : Use smaller positions in MEDIUM zones
Technical Analysis Errors Ignoring Divergences : Pay attention to momentum warnings Missing Squeeze Opportunities : Watch for breakout setups Poor Timeframe Selection : Match timeframe to trading style Alert Fatigue : Don't enable too many alerts simultaneously
Advanced Techniques
Divergence Trading Early Reversal Detection : Use divergences to anticipate trend changes Confirmation Required : Wait for trend strength decline confirmation Tight Risk Management : Use smaller positions for counter-trend trades Quick Exits : Take profits rapidly on divergence trades
Momentum Squeeze Strategies Breakout Preparation : Position before squeeze resolution Direction Bias : Use trend direction for breakout direction Volume Confirmation : Combine with volume analysis when possible False Breakout Protection : Use tight stops for failed breakouts
Multi-Component Analysis Alignment Priority : Perfect alignment (100%) provides highest confidence Distance Consideration : Closer to trend lines = higher probability Momentum Confirmation : Rising momentum supports trend direction Squeeze Integration : High squeeze factor increases breakout potential
Dynamic Position Management Scaling In : Add to positions as trend strength increases Scaling Out : Reduce positions as trend strength decreases Stop Trailing : Move stops with Fast Trend Line progression Profit Optimization : Use strength peaks for profit-taking timing
Conclusion
The Fundur - Trend Lines indicator represents a sophisticated approach to trend analysis, combining adaptive trend line technology with comprehensive strength measurement and intelligent signal generation. By quantifying trend strength through multiple analytical components, this indicator provides traders with objective, data-driven insights for making informed trading decisions.
The indicator's strength lies in its ability to adapt to changing market conditions while providing clear, actionable signals. The comprehensive trend strength analysis removes guesswork from trend trading, allowing traders to size positions appropriately and manage risk effectively based on quantified market conditions.
Success with the Trend Lines indicator comes from understanding that trend strength is dynamic and requires continuous monitoring. The 0-100% strength scale provides an objective framework for position management, while the multi-component analysis ensures robust signal generation across different market conditions.
Remember that this indicator works best when combined with proper risk management, position sizing, and market context awareness. Start with conservative settings and smaller position sizes while learning the indicator's behavior in different market environments. The comprehensive alert system helps maintain awareness of changing conditions, but successful trading still requires discipline and adherence to your trading plan.
For optimal results, practice with the indicator across different timeframes and market conditions, always prioritizing risk management over profit potential, and maintaining realistic expectations about market behavior and indicator performance.

Expansion Triangle [TradingFinder] MegaPhone Broadening🔵 Introduction
The Expanding Triangle, also known as the Broadening Formation, is one of the key technical analysis patterns that clearly reflects growing market volatility, increasing indecision among participants, and the potential for sharp price explosions.
This pattern is typically defined by a sequence of higher highs and lower lows, forming within two diverging trendlines. Unlike traditional triangles that converge to a breakout point, the expanding triangle pattern becomes wider over time, leaving no precise apex for a breakout to occur.
From a price action perspective, the pattern represents a prolonged tug-of-war between buyers and sellers, where neither side has taken control yet. Each aggressive swing opens the door to new opportunities whether it's a trend reversal, range trading, or a momentum breakout. This dual nature makes the pattern highly versatile across market conditions, from exhausted trend ends to volatile consolidation zones.
The custom-built indicator for this pattern uses a combination of smart algorithms and detailed analysis of swing dynamics to automatically detect expanding triangles and highlight low-risk entry points.
Traders can use this tool to capitalize on high-probability setups from shorting near the upper edge of the structure with confirmation, to trading bearish breakouts during trend continuations, or entering long positions near the lower boundary during bullish reversals. The chart examples included in this article demonstrate these three highly practical trading scenarios in live market conditions.
A major advantage of this indicator lies in its structural filtering engine, which analyzes the behavior of each price leg in the triangle. With four adjustable filter levels from Very Aggressive, which highlights all potential patterns, to Very Defensive, which only triggers when price actually touches the triangle's trendlines the indicator ensures that only structurally sound and verified setups appear on the chart, reducing noise and false signals significantly.
Long Setup :
Short Setup :
🔵 How to Use
The pattern typically forms in conditions of heightened uncertainty and volatility, where price swings generate a series of higher highs and lower lows. The expanding triangle consists of three key legs bounded by diverging trendlines. The indicator intelligently analyzes each leg's direction and angle to determine whether a valid pattern is forming.
At the core of the indicator’s logic is its leg filtering system, which controls the quality of the pattern and filters out weak or noisy setups. Four structural filter modes are available to suit different trading styles and risk preferences. In Very Aggressive mode, filters are disabled, and the indicator detects any pattern purely based on the sequence of swing points.
This mode is ideal for traders who want to see everything and apply their own discretion.
In Aggressive mode, the indicator checks whether each new leg extends no more than twice the length of the previous one. If a leg overshoots excessively, the structure is invalidated.
In Defensive mode, the filter enforces a minimum movement requirement each leg must move at least 2% of the previous one. This prevents the formation of shallow, weak patterns that visually resemble triangles but lack substance.
The strictest setting, Very Defensive, combines all previous filters and additionally requires the price to physically touch the triangle’s trendlines before issuing a signal. This ensures that setups only appear when real market interaction with key structural levels has occurred, not based on assumptions or geometry alone. This mode is ideal for traders seeking maximum precision and minimal risk.
🟣 Bullish Setup
A bullish setup within the Expanding Triangle pattern occurs when price revisits the lower support boundary after a series of broad swings typically near the third leg of the formation. This area often represents a shift in momentum, where sellers begin to lose strength and buyers prepare to take control.
Ideally, the setup is accompanied by a bullish reversal candle (e.g. doji, pin bar, or engulfing) near the lower trendline. If the Very Defensive filter is active, the indicator will only issue a signal if price makes a confirmed touch on the trendline and reacts from that level. This significantly improves signal accuracy and filters out premature entries.
After confirmation, traders may choose to enter a long position on the bullish candle or shortly afterward. A logical stop-loss is placed just below the recent swing low within the pattern. The target can be set at or near the upper trendline, or projected using the full height of the triangle added to the breakout point. On higher timeframes, this reversal often marks the beginning of a strong uptrend.
🟣 Bearish Setup
A bearish setup forms when price climbs toward the upper resistance trendline, usually as the third leg completes. This is where buyers often begin to show exhaustion, and sellers step in with strength providing an ideal low-risk entry point for short positions.
As with the bullish setup, if the Candle Confirmation filter is enabled, the indicator will only show a signal when a bearish reversal candle forms at the point of contact. If Defensive or Very Defensive filters are also active, the setup must meet strict criteria of proportionate leg movement and an actual trendline touch to qualify.
Once confirmed, traders can enter on the reversal candle, placing a stop-loss slightly above the recent high. The target can be set at the lower trendline or calculated based on the triangle's full height, projected downward. This setup is particularly useful at the end of weak bullish trends or in volatile market tops.
🔵 Settings
🟣 Logic Settings
Pivot Period : Defines how many bars are analyzed to identify swing highs and lows. Higher values detect larger, slower structures, while lower values respond to faster patterns. The default value of 13 offers a balanced sensitivity.
Pattern Filter :
Very Aggressive : Detects all patterns based on point sequence with no structural checks.
Aggressive : Ensures each leg is no more than 2x the size of the previous one.
Defensive : Requires each leg to be at least 2% the size of the previous leg.
Very Defensive : The strictest level; only confirms patterns when price touches trendlines.
Candle Confirmation : When enabled, the indicator requires a valid confirmation candle (doji, pin bar, engulfing) at the interaction point with the trendline before issuing a signal. This reduces false entries and improves entry precision.
🟣 Alert Settings
Alert : Enables alerts for SSS.
Message Frequency : Determines the frequency of alerts. Options include 'All' (every function call), 'Once Per Bar' (first call within the bar), and 'Once Per Bar Close' (final script execution of the real-time bar). Default is 'Once per Bar'.
Show Alert Time by Time Zone : Configures the time zone for alert messages. Default is 'UTC'.
🔵 Conclusion
The Expanding Triangle pattern, with its wide structure and volatility-driven nature, represents chaos but also opportunity. For traders who can read its behavior, it provides some of the most powerful setups for reversals, breakouts, and range-based trades. While the pattern may seem messy at first glance, it is built on clear logic and when properly detected, it offers high-probability opportunities.
This indicator doesn’t just draw expanding triangles it intelligently evaluates their structural quality, validates price interaction through candle confirmation, and allows the trader to fine-tune the detection logic through adjustable filter levels. Whether you’re a reversal trader looking for a turning point, or a breakout trader hunting momentum, this tool adapts to your strategy.
In volatile or uncertain markets, where fakeouts and sudden shifts are common, this indicator can become a cornerstone of your trading system helping you turn volatility into structured, high-quality opportunities.

Xcalibur Signals & Alerts [AlgoXcalibur]An advanced trend-following algorithm forged to empower retail traders with an edge.
Xcalibur Signals & Alerts is a sophisticated, multi-layered algorithm designed to consistently deliver real-time trend signals—without clutter or unnecessary complexity. The system combines refined trend-following logic with breakout detection, flat-market filtration, false signal failsafes, take profit cues, live alerts, and more — all in a visually simple, easy-to-use indicator built for all assets, timeframes, and market conditions.
🧠 Algorithm Logic
Xcalibur Signals & Alerts operates on a systematic framework that evaluates multiple technical dimensions in harmony—directional alignment, momentum confirmation, relative strength, volume bias, breakout detection, Fibonacci calculations, and more. Rather than reacting to isolated triggers, it filters every opportunity through a multi-layered confirmation engine. It doesn’t just react to every move—it evaluates them. This cohesive approach ensures that each signal results from aligned conditions—not arbitrary thresholds. By combining structural awareness with adaptive filtering, Xcalibur maintains clarity and consistency across a wide range of market environments—delivering actionable signals without unnecessary noise or lag.
⚙️ User-Adjustable Features
• Adjustable Sensitivity:
Choose from 5 pre-tuned Signal Trigger Settings and 3 dynamic Confirmation Filter Modes to tailor the system to your trading style, asset, and timeframe. Candle color reflects the active trigger condition, while an adaptive cyan line displays the selected Confirmation Filter—blocking signals until the filter threshold is crossed.
• Directional Stability Filter: When enabled, this filter uses mean-reversion calculations to determine directional bias and block unreliable signals during choppy, indecisive price action. A magenta line represents this filter threshold and provides higher-confidence signals during periods of low directional conviction.
• Pullback Allowance Filter:
When enabled, this unique filter uses Fibonacci ratios to deliberately block signals from temporary pullbacks during strong trend periods. A green (uptrend) or red (downtrend) line marks the active pullback allowance zone.
• False Signal Failsafe
:
Two selectable modes:
Simple — Cancels the signal if price breaks the signal candle’s high or low.
Advanced — Requires both a price break and opposing momentum confirmation.
When triggered, the system plots a white “X” signal, turns candles gray, disables the background color, sends an alert (if enabled), and enters standby mode until a valid trend condition re-emerges.
• Reaction Zones:
Identifies probable reversal or breakout zones based on recent price action patterns. A yellow line appears when active, with a yellow caution flag plotted if the price reaches this critical area.
• Take-Profit Cues
: Automatically detects potential trend exhaustion using price action structure and momentum shifts. When triggered, a visual “TP” marker is plotted—advising traders to manage profits or prepare for a possible reversal.
• Trailing Stop:
Plots a dynamic, percentage-based trailing stop or trailing take-profit using your selected input. Adjust it to suit your risk tolerance and asset.
• Multi-Timeframe Monitor
: Displays real-time trend direction across 1m, 2m, 5m, 15m, 1H, 4H, and 1D timeframes in a compact, easy-to-read table.
• Alert System
:
Receive desktop and/or mobile alerts for:
* New trend signals
* Failsafe triggers
* 9:00 AM Morning Greeting messages with auto re-arming confirmation
(Alerts are limited to 9:00 AM – 4:00 PM Eastern Time)
• SuperCandles
: Highlights strong momentum moves with a stunning and easily recognizable glow effect.
• Color-Coded Candles & Background
: Candles reflect the current trigger condition, while the background tint tracks the most recent trend—enhancing situational awareness.
*All input settings include tooltips to guide users through setup and interpretation.
⚔️ Not Just Another Signal Tool
Xcalibur Signals & Alerts was built from the ground up to empower retail traders with access to a cohesive, structured algorithmic system—one that reflects the kind of awareness, discipline, and market adaptability found in professional-grade algorithms.
This is not another oversensitive or under-responsive signal indicator that is limited to one specific type of market condition or trader. It does not utilize hyperactive triggers, rely on lagging crossover logic, or need infinitely adjustable and complex sensitivity settings. Instead of cluttered visuals to interpret, this indicator delivers a simple, easy-to-use tool—prioritizing clarity and usability without compromising on depth and sophistication.
Whether the market is trending, breaking out, or moving sideways, Xcalibur adapts—prioritizing trend stability, directional integrity, and visual clarity from one signal to the next.
⚠️ While the Xcalibur Signals & Alerts algorithm is immune to human emotion, you are not. Be mindful not to fall victim to costly emotions that can manipulate your judgment, and understand the unpredictable and complex nature of trading. No algorithm, strategy, or technique can deliver perfect accuracy, and Xcalibur Signals & Alerts is no exception. While AlgoXcalibur strives to be as accurate as possible, incorrect signals can and will occur. Xcalibur Signals & Alerts is a tool, not a guarantee. Users are fully responsible for making their own trading decisions, implementing proper risk management, and always trading responsibly.
🛡️ Wield Xcalibur as a standalone weapon or use it alongside other tools.
🔐 To get access or learn more, visit the Author’s Instructions section.

IDKFAIDKFA - Advanced Order Blocks & Volume Profile with Market Structure Analysis
Why IDKFA?
Named after the legendary DOOM cheat code that gives players "all weapons and full ammo," IDKFA provides traders with a comprehensive arsenal of market analysis tools. Just as the cheat code arms players with everything needed for combat, this indicator equips traders with essential market structure tools: Order Blocks, Volume Profile, LVN/HVN areas, Fibonacci retracements, and intelligent buy/sell signals - all in one unified system.
Core Features
Order Blocks Detection
Automatically identifies institutional order blocks using pivot high/low analysis
Extends blocks dynamically until price interaction occurs
Bullish blocks (demand zones) and bearish blocks (supply zones)
Customizable opacity and extend functionality
Advanced Volume Profile
Real-time volume profile calculation for multiple session types
Point of Control (POC), Value Area High (VAH), and Value Area Low (VAL)
Mode 1: Side-by-side bull/bear volume display
Mode 2: Overlapped volume display with percentage analysis
Shows buying vs selling pressure at each price level
LVN/HVN Area Detection
Low Volume Nodes (LVN): Areas below VAL where price moves quickly
High Volume Nodes (HVN): Areas above VAH with strong resistance
NPOC (Naked Point of Control): Single print areas within Value Area
Volume-based gradient coloring shows relative activity levels
Smart Fibonacci Retracements
Auto-detects trend direction for proper fibonacci orientation
Dynamic color coding: Red levels in uptrends, Gold in downtrends
Special 88.6% level turns lime green in downtrends
Key levels: 23.6%, 38.2%, 50%, 61.8%, 65%, 78.6%, 88.6%
Intelligent Signal System
Works best on higher timeframes
Identifies high-probability reversal setups at key levels
Buy signals: Large bearish rejection followed by bullish reclaim
Sell signals: Large bullish rejection followed by bearish breakdown
Signals only trigger near significant support/resistance areas
Signal Analysis & Usage Guidelines
Buy Signal Mechanics
The buy signal triggers when:
Previous candle shows significant bearish movement (minimum ATR multiplier)
Current candle reclaims a configurable percentage of the previous candle's range
Price is near a key support level (order blocks, fibonacci, volume levels)
Sell Signal Mechanics
The sell signal triggers when:
Previous candle shows significant bullish movement (minimum ATR multiplier)
Current candle rejects below a configurable percentage of the previous candle's range
Price is near a key resistance level (order blocks, fibonacci, volume levels)
When to TAKE Signals
High Probability Buy Signals:
Signal appears AT or BELOW the VAL (Value Area Low)
Signal occurs at bullish order block confluence
Price is in LVN area below VAL (momentum acceleration zone)
Signal aligns with fibonacci 61.8% or 78.6% support
Multiple session POC levels provide support confluence
Previous session's VAL acting as current support
High Probability Sell Signals:
Signal appears AT or ABOVE the VAH (Value Area High)
Signal occurs at bearish order block confluence
Price is in HVN area above VAH (heavy resistance zone)
Signal aligns with fibonacci 61.8% or 78.6% resistance
Multiple session POC levels provide resistance confluence
Previous session's VAH acting as current resistance
When to AVOID Signals
Avoid Buy Signals When:
Signal appears ABOVE the VAH (buying into resistance)
Price is in HVN red zones (high volume resistance areas)
No clear support structure below current price
Volume profile shows heavy selling pressure (high bear percentages)
Signal occurs during low-volume periods between major sessions
Multiple bearish order blocks exist below current price
Avoid Sell Signals When:
Signal appears BELOW the VAL (selling into support)
Price is in LVN green zones (momentum could continue)
No clear resistance structure above current price
Volume profile shows heavy buying pressure (high bull percentages)
Signal occurs during Asian session ranges without clear direction
Multiple bullish order blocks exist above current price
Volume Profile Context for Signals
Understanding Bull/Bear Percentages:
70%+ Bull dominance at a level = Strong support expected
70%+ Bear dominance at a level = Strong resistance expected
50/50 Split = Neutral zone, less predictable
Use percentages to gauge conviction behind moves
POC (Point of Control) Interactions:
Signals above POC in uptrend = Higher probability
Signals below POC in downtrend = Higher probability
Signals against POC bias require extra confirmation
POC often acts as magnetic level for price return
Trading Strategies
Strategy 1: VAL/VAH Bounce Strategy
Wait for price to approach VAL (support) or VAH (resistance)
Look for signal confirmation at these critical levels
Enter with tight stops beyond the Value Area
Target opposite boundary or next session's levels
Strategy 2: Order Block + Volume Confluence
Identify order block alignment with VAL/VAH
Wait for signal within the confluence zone
Enter on signal with stop beyond order block
Use LVN areas as acceleration zones for targets
Strategy 3: LVN/HVN Strategy
LVN (Green) Areas: "Go Zones" - expect quick price movement through low volume
HVN (Red) Areas: "Stop Zones" - expect resistance and potential reversals
NPOC Areas: "Fill Zones" - price often returns to fill single print gaps
Strategy 4: Multi-Session Analysis
Use Daily/Weekly for major structure context
Use 4H for intermediate levels
Use 1H for precise entry timing
Ensure all timeframes align before taking signals
Strategy 5: Fibonacci + Volume Profile
Buy signals at 61.8% or 78.6% fibonacci near VAL
Sell signals at 61.8% or 78.6% fibonacci near VAH
Use 88.6% level as final support/resistance before major moves
50% level often aligns with POC for confluence
Signal Quality Assessment
Grade A Signals (Highest Probability):
Signal at VAL/VAH with order block confluence
Fibonacci level alignment (61.8%, 78.6%)
Volume profile shows 70%+ dominance in signal direction
Multiple timeframe structure alignment
Signal occurs during high-volume sessions (London/NY)
Grade B Signals (Moderate Probability):
Signal near POC with some confluence
Fibonacci 50% or 38.2% alignment
Mixed volume profile readings (50-70% dominance)
Some timeframe alignment present
Signal during overlap sessions
Grade C Signals (Lower Probability):
Signal with minimal confluence
Weak fibonacci alignment or none
Volume profile neutral or against signal
Conflicting timeframe signals
Signal during low-volume periods
Risk Management Guidelines
Position Sizing Based on Signal Quality:
Grade A: Standard position size
Grade B: Reduced position size (50-75%)
Grade C: Minimal position size (25%) or skip entirely
Stop Loss Placement:
Beyond order block boundaries
Outside Value Area (VAL/VAH)
Below/above fibonacci confluence levels
Account for session volatility ranges
Profit Targets:
First target: Opposite VAL/VAH boundary
Second target: Next session's key levels
Final target: Major order blocks or fibonacci extensions
Credits & Attribution
Original components derived from:
Market Sessions & Volume Profile by © Leviathan (Mozilla Public License 2.0)
Volume Profile elements inspired by @LonesomeTheBlue's volume profile script
Pivot Order Blocks by TradingWolf / © MensaTrader (Mozilla Public License 2.0)
Auto Fibonacci Retracement code (public domain)
Significant enhancements and modifications include:
Advanced LVN/HVN detection and visualization
Bull/Bear percentage analysis for Mode 2/3
Comprehensive alert system with market context
Integrated buy/sell signals at key levels
Performance optimizations and extended session support
Enhanced Mode 2/3 with percentage pressure analysis
Important Disclaimers
This indicator is a technical analysis tool designed for educational purposes. It does not provide financial advice, investment recommendations, or trading signals that guarantee profits. All trading involves substantial risk of loss, and past performance does not guarantee future results. Users should conduct their own research, understand the risks involved, and consider consulting with qualified financial advisors before making trading decisions. The signals and analysis provided are based on historical price patterns and volume data, which may not predict future market movements accurately.
Best Practices
Never trade signals blindly - always consider volume profile context
Wait for confluence between multiple tools before entering
Respect the Value Area - avoid buying above VAH or selling below VAL
Use session context - Asian ranges vs London/NY breakouts
Practice proper risk management - position size based on signal quality
Understand the bigger picture - use multiple timeframes for context
Remember: Like the IDKFA cheat code, having all the tools doesn't guarantee success. The key is learning to use them together effectively and understanding when NOT to take a signal is often more important than knowing when to take one.

Liquidity Sweep Candlestick Pattern with MA Filter📌 Liquidity Sweep Candlestick Pattern with MA Filter
This custom indicator detects liquidity sweep candlestick patterns—price action events where the market briefly breaks a previous candle’s high or low to trap traders—paired with optional filters such as moving averages, color change candles, and strictness rules for better signal accuracy.
🔍 What is a Liquidity Sweep?
A liquidity sweep occurs when the price briefly breaks the high or low of a previous candle and then reverses direction. These events often occur around key support/resistance zones and are used by institutional traders to trap retail positions before moving the price in the intended direction.
🟢 Bullish Liquidity Sweep Criteria
The current candle is bullish (closes above its open).
The low of the current candle breaks the low of the previous candle.
The candle closes above the previous candle’s open.
Optionally, in Strict mode, it must also close above the previous candle’s high.
Optionally, it can be filtered to only show if the candle changed color from the previous one (e.g., red to green).
Can be filtered to only show when the price is above or below a moving average (if MA filter is enabled).
🔴 Bearish Liquidity Sweep Criteria
The current candle is bearish (closes below its open).
The high of the current candle breaks the high of the previous candle.
The candle closes below the previous candle’s open.
Optionally, in Strict mode, it must also close below the previous candle’s low.
Optionally, it can be filtered to only show if the candle changed color from the previous one (e.g., green to red).
Can be filtered to only show when the price is above or below a moving average (if MA filter is enabled).
⚙️ Features & Customization
✅ Signal Strictness
Choose between:
Less Strict (default): Basic wick break and close conditions.
Strict: Must close beyond the wick of the previous candle.
✅ Color Change Candles Only
Enable this to only show patterns when the candle color changes (e.g., from red to green or green to red). Helps filter fake-outs.
✅ Moving Average Filter (optional)
Supports several types of MAs: SMA, EMA, WMA, VWMA, RMA, HMA
Choose whether signals should only appear above or below the selected moving average.
✅ Custom Visuals
Show short (BS) or full (Bull Sweep / Bear Sweep) labels
Plot triangles or arrows to represent bullish and bearish sweeps
Customize label and shape colors
Optionally show/hide the moving average line
✅ Alerts
Includes alert options for:
Bullish sweep
Bearish sweep
Any sweep
📈 How to Use
Add the indicator to your chart.
Configure the strictness, color change, or MA filters based on your strategy.
Observe signals where price is likely to reverse after taking out liquidity.
Use with key support/resistance levels, order blocks, or volume zones for confluence.
⚠️ Note
This tool is for educational and strategy-building purposes. Always confirm signals with other indicators, context, and sound risk management.

Breaker Blocks & Unicorns (with Deviations) by RiseBreaker Block and Unicorns (with Deviations) - The Highest Probability ICT Pattern
This advanced indicator identifies and tracks ICT Breaker Blocks, while incorporating powerful supplementary features including Unicorn patterns and customizable deviation levels.
These patterns develop through a precise market structure sequence culminating in structural breaks. Following Breaker Block confirmation, users can optionally enable highly customizable deviation levels. Additionally, the indicator can scan active Breaker Blocks for overlapping Fair Value Gaps (FVGs) and Inverted Fair Value Gaps (IFVGs)-(also known as "Unicorns") that represent high-probability trading opportunities, highly regarded in the ICT community.
This comprehensive tool provides unmatched functionality for traders and analysts seeking to track, backtest, and execute Breaker Block strategies. With its extensive feature set and granular customization options, it delivers capabilities that surpass existing alternatives in the market.
What is an ICT Breaker Block?
To explain this, we must understand the ABC sequence that form this pattern. It consists of:
Initial range (from A -> B)
First break point, commonly called "Manipulation" (C)
Second break, which is when the pattern is formed.
Each of these "points" consist of pivot levels, with an adjustable strength.
Breaker Blocks are invalidated and made inactive if price breaks the "C point", or manipulation.
Unicorns
Unicorns are Fair Value Gaps or Inverted Fair Value Gaps that overlap a Breaker Block. Breakers have their associated Unicorn, which is updated until price retraces into said gap.
Standard Deviations
This indicator has options to display deviations based on Breaker Blocks:
Breaker Deviations -> using the initial range (A -> B).
Manipulation Deviations -> using the manipulation (B -> C).
Input Settings:
This tool offers a lot of customizable options, which could be overwhelming to some users. Below you will find an in-depth definition of every input's purpose, to complement the tooltips that can be found directly in the indicator's settings.
Mode ⚙️
Default -> Displays every Breaker Block pattern found.
Bullish -> Displays every Bullish Breaker Block found.
Bearish -> Displays every Bearish Breaker Block found.
Reversals -> Displays alternate Breaker Blocks (Bearish -> Bullish -> Bearish and so on).
This is paired with a Historical input, to select the amount of previous Breakers to display.
Extend 📏
Last -> This option will extend the most recent Breaker's drawings.
Specified -> Extend Breakers a preset amount of bars.
All -> Extend all active Breakers to the current bar.
None -> Never extend Breaker Blocks.
Each object has it's specific " offset " parameter, which defines the amount of bars to extend drawings past the current bar.
Parameters
This section defines the main parameters used to define the Breaker Block pattern.
Time Filter -> Optional session to filter Breakers based on time of day.
Pivot Strength -> Determines how many consecutive bars to the left of a pivot must be lower (for highs) or higher (for lows) to confirm it as a point.
Range Lookback -> Amount of ranges that the indicator will keep track for each direction.
Breaker Type -> Defines how a Breaker Block is displayed:
Range -> Entire initial range.
Consecutive -> Last consecutive onside candles (upclose for bullish, downclose for bearish).
Last -> Last onside candle.
Breaker Offset -> Amount of bars to extend Breaker Blocks past the current bar.
Use Candle Bodies? -> Use bar open to close rather than high to low.
Require Candle Close? -> Use bar close to form Breaker Blocks.
Remove After Invalidation? -> Remove drawings for invalidated Breakers.
Style
Breaker Block boxes styling based on directions.
Optional Middle Line and styling.
Optional Signals for Breaker Block formation:
Triangle label with adjustable sizing on the formation bar.
Line with custom styling at breakout point to the formation bar.
Unicorn Fair Value Gaps
Checkbox to display Unicorns with adjustable "FVGs", "IFVGs", or "Both" types.
Overlap Threshold -> Distance away from Breaker to still consider an "overlap".
Unicorn Offset -> Amount of bars to extend unicorn gaps past the current bar.
Lines styling.
Optional Middle Line and styling.
Include Volume Imbalances? -> Include adjacent VIs as part of Fair Value Gaps.
Extend until Reached? -> Extend Unicorn drawings until price reaches them.
Deviations
Checkbox to display Standard Deviations with adjustable types and levels.
Lines styling.
Text size and positioning.
Extend until Reached? -> Extend deviation lines until price reaches them.
Text
Label contents:
Default -> "+/- Breaker".
Abbreviation -> "+/- BB".
None -> No text.
Size .
Font (Default or Monospace) and Format (None, Italic or Bold).
Align -> vertical and horizontal positioning.
This indicator is for educational and informational purposes only. Past performance and historical patterns do not guarantee future results. Trading involves substantial risk of loss and is not suitable for all investors. Always conduct your own analysis and consider your financial situation before making any trading decisions. The identification of patterns does not constitute trading advice.
For any additional questions and/or feedback related to this indicator, users can comment below!

TrendLine + AlertsThe TrendLine + Alerts indicator is an advanced technical analysis tool designed to quickly identify trend direction using various moving averages and RMSD deviation. It dynamically generates buy and sell signals and visually marks entry points with price labels on the chart. Additionally, an optional transaction table can be toggled on or off, displaying buy and sell prices along with the percentage returns of individual trades and an aggregated summary row, facilitating the evaluation of trading strategy performance.
🔧 Key Features:
- Supports multiple moving average types: SMA, EMA, HMA, DEMA, TEMA, RMA, FRAMA
- Dynamic trend analysis based on RMSD deviation, adaptable to current market conditions
- Color-coded trend indication: green for uptrends, red for downtrends
- Alert generation: real-time buy and sell signals (TrendLine BUY / SELL)
- Price labels on the chart for better visualization of entry/exit points
- Interactive settings panel allowing selection of data source (open, close, high, low etc.), adjustable moving average length, and RMSD deviation multiplier
- Optionally displays a dynamic transaction table (toggleable via chart settings) that shows:
- Buy: entry prices
- Sell: exit prices
- Percent: percentage return of each trade, displayed as a number
- A summary row that aggregates the percentage returns, offering a quick evaluation of trading performance
⚙️ Settings:
- Ability to select the data source: open, close, high, low, oc2, hl2, occ3, hlc3, ohlc4, hlcc4
- Adjustable moving average length
- Customizable RMSD deviation multiplier
- Toggle switch to enable or disable the transaction table
🚀 Application:
Ideal for traders seeking an effective method to identify trends and turning points in the market. It is suitable for both short-term day trading and long-term trend analysis, with adjustable settings to suit individual trading strategies.
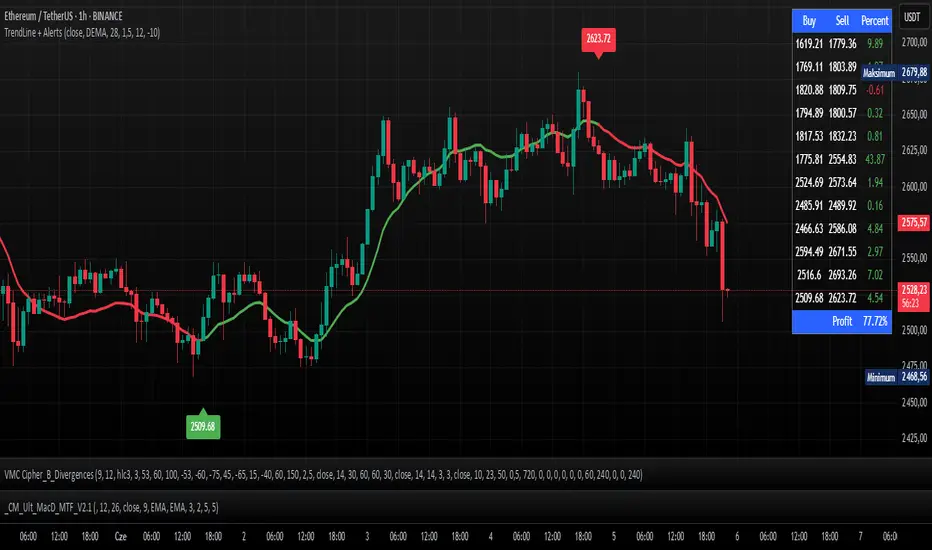
Enhanced Stock Ticker with 50MA vs 200MADescription
The Enhanced Stock Ticker with 50MA vs 200MA is a versatile Pine Script indicator designed to visualize the relative position of a stock's price within its short-term and long-term price ranges, providing actionable bullish and bearish signals. By calculating normalized indices based on user-defined lookback periods (defaulting to 50 and 200 bars), this indicator helps traders identify potential reversals or trend continuations. It offers the flexibility to plot signals either on the main price chart or in a separate lower pane, leveraging Pine Script v6's force_overlay functionality for seamless integration. The indicator also includes a customizable ticker table, visual fills, and alert conditions for automated trading setups.
Key Features
Dual Lookback Indices: Computes short-term (default: 50 bars) and long-term (default: 200 bars) indices, normalizing the closing price relative to the high/low range over the specified periods.
Flexible Signal Plotting: Users can toggle between plotting crossover signals (triangles) on the main price chart (location.abovebar/belowbar) or in the lower pane (location.top/bottom) using the Plot Signals on Main Chart option.
Crossover Signals: Generates bullish (Golden Cross) and bearish (Death Cross) signals when the short or long index crosses above 5 or below 95, respectively.
Visual Enhancements:
Plots short-term (blue) and long-term (white) indices in a separate pane with customizable lookback periods.
Includes horizontal reference lines at 0, 20, 50, 80, and 100, with green and red fills to highlight overbought/oversold zones.
Dynamic fill between indices (green when short > long, red when long > short) for quick trend visualization.
Displays a ticker and legend table in the top-right corner, showing the symbol and lookback periods.
Alert Conditions: Supports alerts for bullish and bearish crossovers on both short and long indices, enabling integration with TradingView's alert system.
Technical Innovation: Utilizes Pine Script v6's force_overlay parameter to plot signals on the main chart from a non-overlay indicator, combining the benefits of a separate pane and chart-based signals in a single script.
Technical Details
Calculation Logic:
Uses confirmed bars (barstate.isconfirmed) to calculate indices, ensuring reliability by avoiding real-time bar fluctuations.
Short-term index: (close - lowest(low, lookback_short)) / (highest(high, lookback_short) - lowest(low, lookback_short)) * 100
Long-term index: (close - lowest(low, lookback_long)) / (highest(high, lookback_long) - lowest(low, lookback_long)) * 100
Signals are triggered using ta.crossover() and ta.crossunder() for indices crossing 5 (bullish) and 95 (bearish).
Signal Plotting:
Main chart signals use force_overlay=true with location.abovebar/belowbar for precise alignment with price bars.
Lower pane signals use location.top/bottom for visibility within the indicator pane.
Plotting is controlled by boolean conditions (e.g., bullishLong and plot_on_chart) to ensure compliance with Pine Script's global scope requirements.
Performance Considerations: Optimized for efficiency by calculating indices only on confirmed bars and using lightweight plotting functions.
How to Use
Add to Chart:
Copy the script into TradingView's Pine Editor and add it to your chart.
Configure Settings:
Short Lookback Period: Adjust the short-term lookback (default: 50 bars) to match your trading style (e.g., 20 for shorter-term analysis).
Long Lookback Period: Adjust the long-term lookback (default: 200 bars) for broader market context.
Plot Signals on Main Chart: Check this box to display signals on the price chart; uncheck to show signals in the lower pane.
Interpret Signals:
Golden Cross (Bullish): Green (long) or blue (short) triangles indicate the index crossing above 5, suggesting a potential buying opportunity.
Death Cross (Bearish): Red (long) or white (short) triangles indicate the index crossing below 95, signaling a potential selling opportunity.
Set Alerts:
Use TradingView's alert system to create notifications for the four alert conditions: Long Index Valley, Long Index Peak, Short Index Valley, and Short Index Peak.
Customize Visuals:
The ticker table displays the symbol and lookback periods in the top-right corner.
Adjust colors and styles via TradingView's settings if desired.
Example Use Cases
Swing Trading: Use the short-term index (e.g., 50 bars) to identify short-term reversals within a broader trend defined by the long-term index.
Trend Confirmation: Monitor the fill between indices to confirm whether the short-term trend aligns with the long-term trend.
Automated Trading: Leverage alert conditions to integrate with bots or manual trading strategies.
Notes
Testing: Always backtest the indicator on your chosen market and timeframe to validate its effectiveness.
Optional Histogram: The script includes a commented-out histogram for the index difference (index_short - index_long). Uncomment the plot(index_diff, ...) line to enable it.
Compatibility: Built for Pine Script v6 and tested on TradingView as of May 27, 2025.
Acknowledgments
This indicator was inspired by the need for a flexible tool that combines lower-pane analysis with main chart signals, made possible by Pine Script's force_overlay feature. Share your feedback or suggestions in the comments below, and happy trading!
