Inverse Fisher Transform on Williams %RInverse Fisher Transform On Williams %R
Since Williams R indicator produces negative values, I preferred to add 50 instead of subtracting 50.
It produces values between 0.5 and -0.5.
Generates clear buy and sell signals.
Williams %R determines overbought and oversold levels.
You can see more softly.
Indicatore Alligator

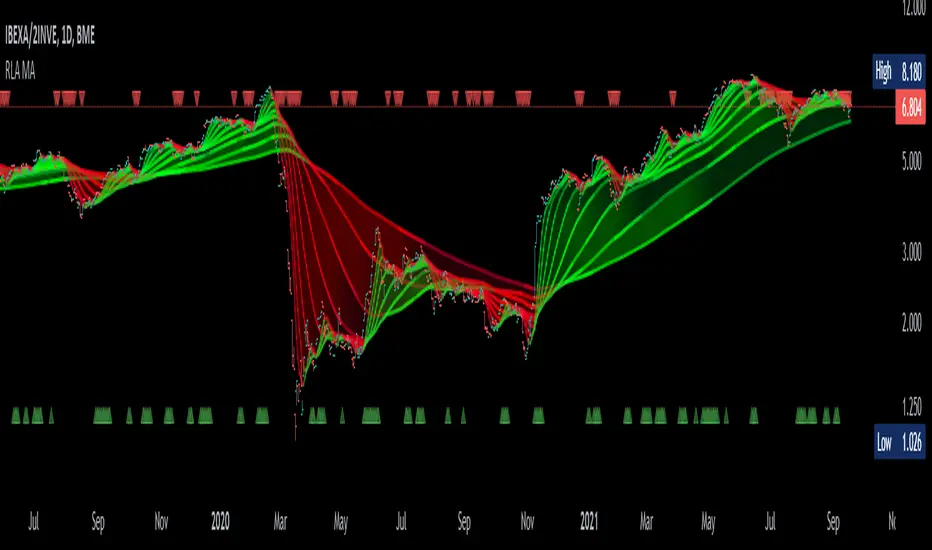
Alma Moving Average Ribbon Reverse Length [DM]Greetings Colleagues
Following some recommendations and ideas I share this moving average, put all of them together
The length calculation is automatic there is only one input.
The length is inverse so it will wrap from the longest reference point, hence using phi
Moving averages will wrap around the price.
I've also added gradient color to plots and fill plots
There is an alert selector in case you are interested in a particular crossing, "remember that the order is reversed".
There is an alert visual plotshapes with offset signal.
Finally, after spending a few hours with the Williams alligator moving averages I found nothing special, but I added the individual offset adjustment for each moving average in case someone comes up with something.
Enjoy”
Some references about alma by "tradingview pinecoders"
What to look for
The Arnaud Legoux Moving Average has three elements to it:
Window: This element is the period. By default, the window is set to 9 periods, but it can be customized to fit any trading style.
Offset: This element is the Gaussian that is applied to the combo line and can be aligned to the current price. It’s default is set to 0.85, but by setting it to 1, you can make it align fully to the current price (similar to how an Exponential Moving Average (EMA) with a setting of 0 is like a Simple Moving Average (SMA)). 0.85 is what is recommended, however, you can customize it like with the window element.
Sigma: This element is a standard deviation that is applied to the combo line in order for it to appear more sharp. The default is set to 6 and it is not recommended to change the setting. The value of 6 is inspired by the Six Sigma process.
www.tradingview.com
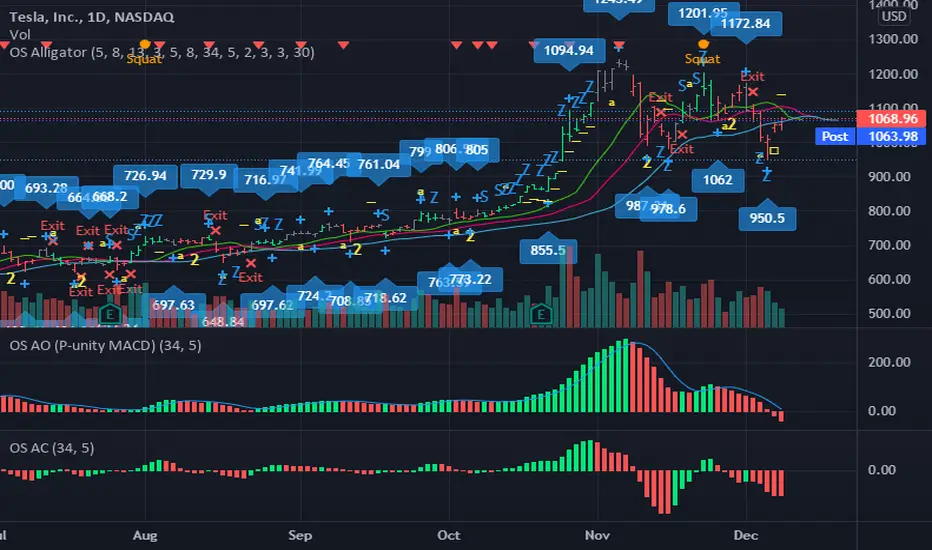
OS AlligatorOS Alligator includes Bill and Justine Williams´ indicators explained both in their "New Trading Dimensions" and "Trading Chaos: Second Edition" books. This script replicates the visual alerts shown on their graphs.
OS Alligator includes:
- Fractals (with labels for easy reading)
- Divergent Bars (signaled by top and bottom triangles)
- Zone bar colors (the bar is green when both AO and AC are green, red when both are red, and black when different)
- Zone buys and sells (subsequent AO of the same color), with letter Z
- Saucer buys and sells, with letter S
- Highest High and Lowest Low tracking (for traling stop setting)
- Balance line (Teeth) crossover alerts
and of course the Alligator's Mouth (Lips, Teeth, Jaw) with SMMA.
All these functions are customizable both in periods and in color. For example if you want to modify the Fractal or HiLo periods you can do so.
You can also add alerts based on any or all indicators.
Thank you for reading. Any comments for improvement are welcome.
-ownsov
Ultimate Buy/Sell IndicatorAn Indicator based on the William Alligator, helping to find suitable entry and exit points.

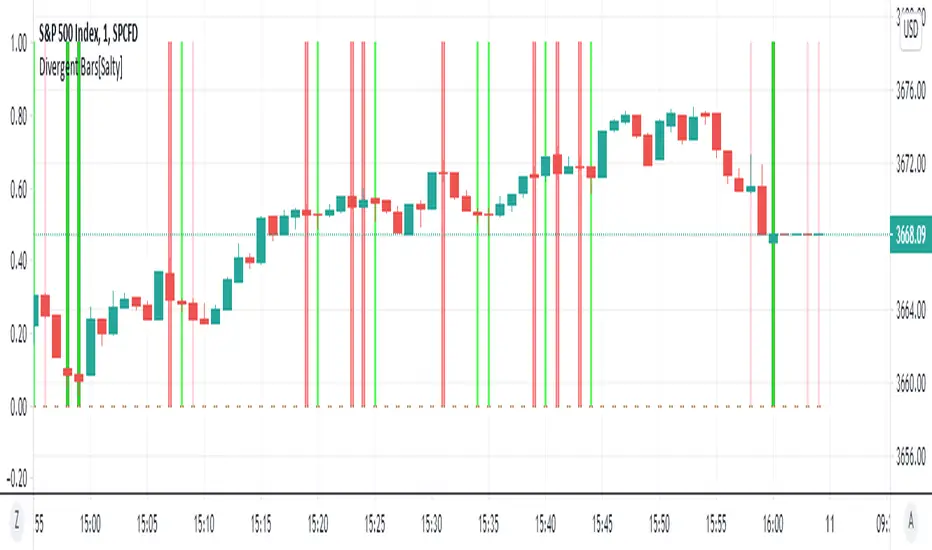
Divergent Bars[Salty]Updated an existing Divergent Bar script to be able to show all divergent bars. There are 2 set of divergent bars that can be turned on. The original one based on price and alligator lines, and a new second one that shows ALL divergent bars. The second set has lighter lines and colors to differentiate them from the filtered alligator divergent bars.
Multi StrategyDuring the course of a trade, we can find ourselves changing strategies depending on the market. Instead of using many different templates, I have a simple indicator that clearly says "Buy", "Sell" or "Stay Out". The great thing about this approach, is we instantly observe the majority are in agreement and that decides which way to place our trade.
This indicator includes the following strategies:
- QQE
- Ichimoku using much faster settings.
- Parabolic SAR
- Supertrend
- TTM Oscillator
- The Squeeze strategy
- The Alligator Strategy
Using this indicator is simple, if the lines are mainly green then buy, if mainly red then sell OR don't trade. So...
Green Line - This strategy is in a buy position
Orange or Black Line - This strategy is undecided
Red Line - This strategy is in a sell position
There are also some green and red circles for reference that appear showing when that bar has broken through the Ichimoku cloud.
The trader's approach is simple, when all indicators are green or red, then take the trade. As soon as one indicator changes, then re-evaluate using your normal process, such as price action, to determine whether to close the trade or continue.
I can customise this further or add other strategies, please message me.

Fibonacci RainbowThis indicator is inspired by Bill William's Alligator .
Taken 7 Fibonacci numbers, painted in the colors of the rainbow and highlighted when the rainbow fan is up or down.

Zenith BladeThis script is based heavily on "Support/Resistance Zones x3" by Lij_MC
What I did is went and added alerts for when price breakouts the support line/zone.
You have the options to change if it is based on a zone breakout or a line breakout
You also can choose when it will go off, so for example you want an alert to trigger only between 7am and 8am then you can change that in the menu.
Lastly you can choose whither or not to show the Williams Alligator on the chart as I have found it beneficial in conjunction with the script since its based primarily on fractals to calculate Support and Resistance.

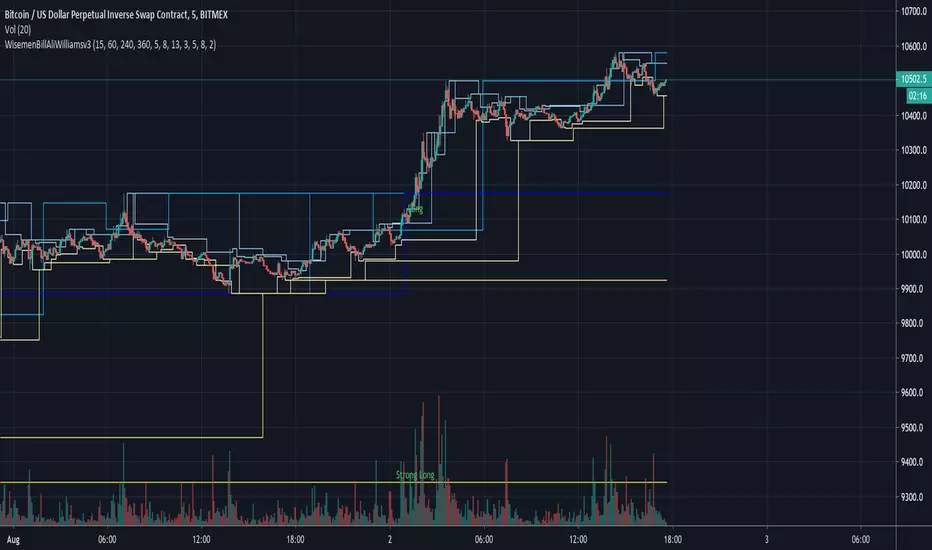
Wisemen Bill Ali Williams v3Use 2 timeframe:
Current timeframe + configurable timeframe (default: 6hours)
Get resistance & support for both timeframe.
Entry when breakout both resistance or both support
For donations
BTC: 3E7rUPX7upS8iTj42JdLt7keJVbJLfvMoH
ETH: 0x094ed88e4c5a9b225e936586cbc2d61f4a027f68
Thank you & happy trading!
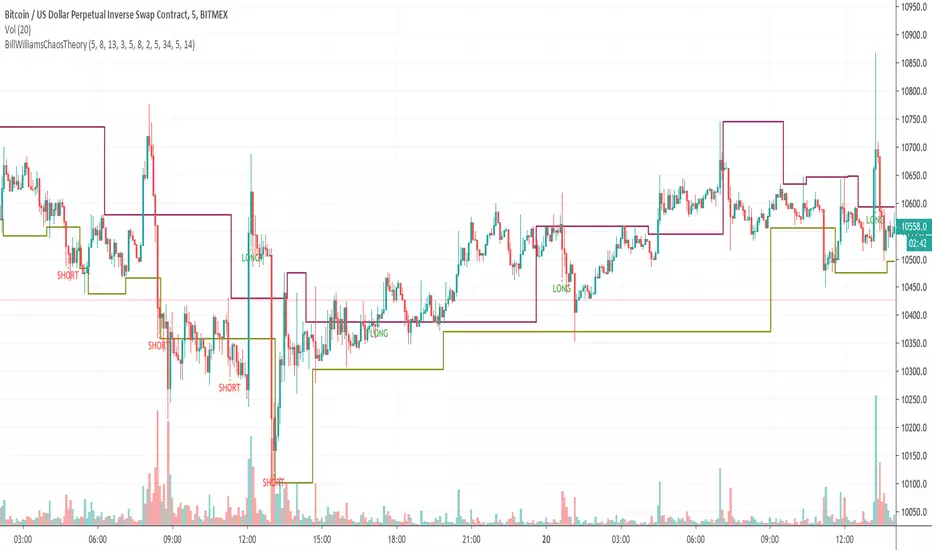
Bill Williams Chaos TheoryBill Williams Chaos Theory
- Alligator
- Fractals
- Accelerator Decelerator Oscillator
- Market Facilitation Index
Combining all of that to generate signal long or short.
Long entry when long signal appears.
Short entry when short signal appears.
For donations
BTC: 3E7rUPX7upS8iTj42JdLt7keJVbJLfvMoH
ETH: 0x094ed88e4c5a9b225e936586cbc2d61f4a027f68
Thank you & happy trading!
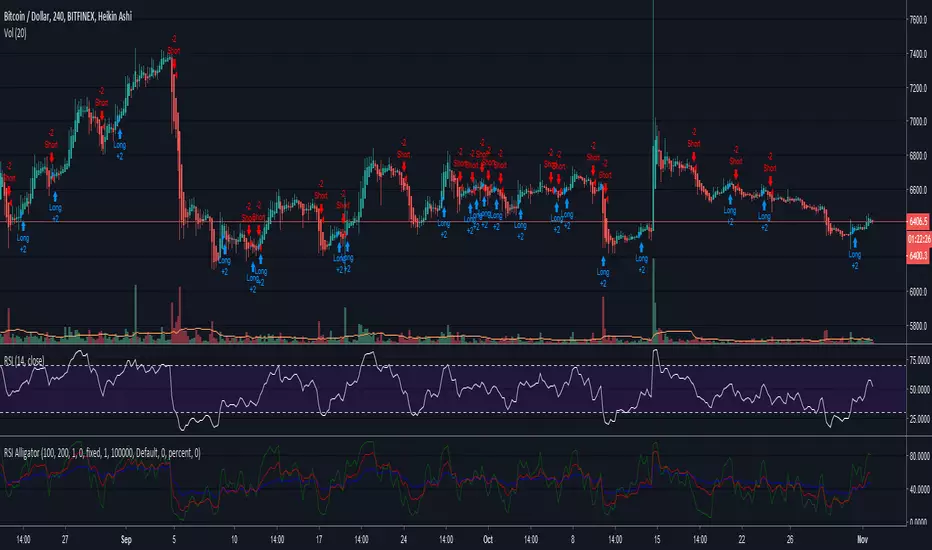
RSI Alligator StrategyHello trading family! Just wanted to give a quick write up and share the new code for the RSI Alligator Strategy. I amended it to show every crossover signal, weak and strong, so we can accurately gauge its effectiveness.
Having played with this for a couple hours now I have learned a few things
-Using Heikin Ashi seems to smooth it out a bit and provides about 20% fewer signals, leading to overall more accuracy. However, it can be misleading as the Heikin Ashi opening price doesn't always line up with the market price, especially in cases of large moves. Overall though it didn't seem too far off except for a few instances.
-Also, using the Heikin Ashi gives you a better idea of the trend, which this indicator is primarily used to detect and exploit.
-Having tested on TF of 1H-1D, overall profitability is found to be highest between 4H-12H, with 1D giving the "safest" longer term signals, and lower TF's generating many more signals due to volatility.
-Instead of waiting for the next signal in order to close, you can often use a crossover/crossunder of the 5 and 13 to close the previous trade, especially if paired with a Heikin Ashi of opposite color (green to close a short, red to close a long)
-You will also notice several instances where the Green 5 period show divergences that aren't visible on the regular RSI, another handy little feature
So far I have still only tested this on BTCUSD. Feel free to apply it to any coin and let me know what you find.
Here is the script. If you have any ideas or suggestions please let me know!
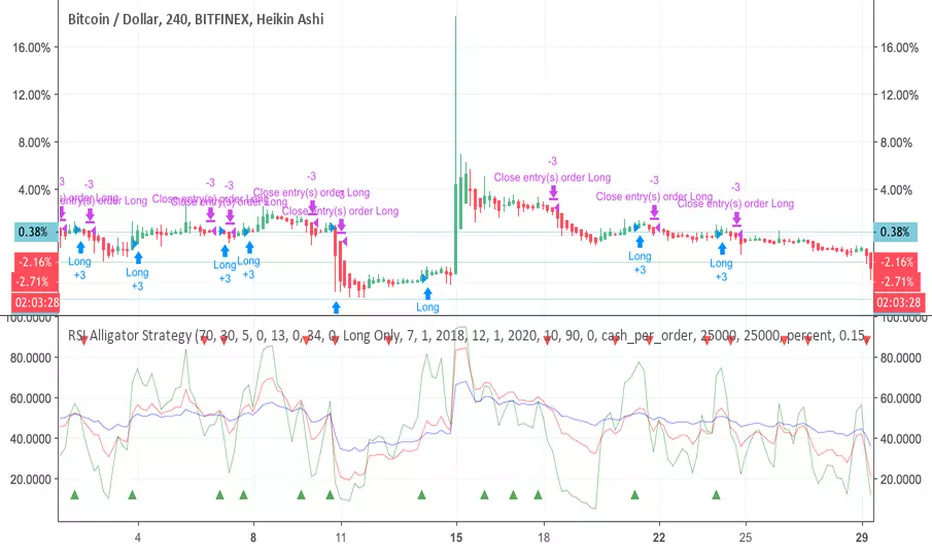
RSI Alligator Strategy [forked from jedireza]Backtester for RSI alligator is Williams Alligator strategy using Relative Strength Index to predict entries
Original script can be found at
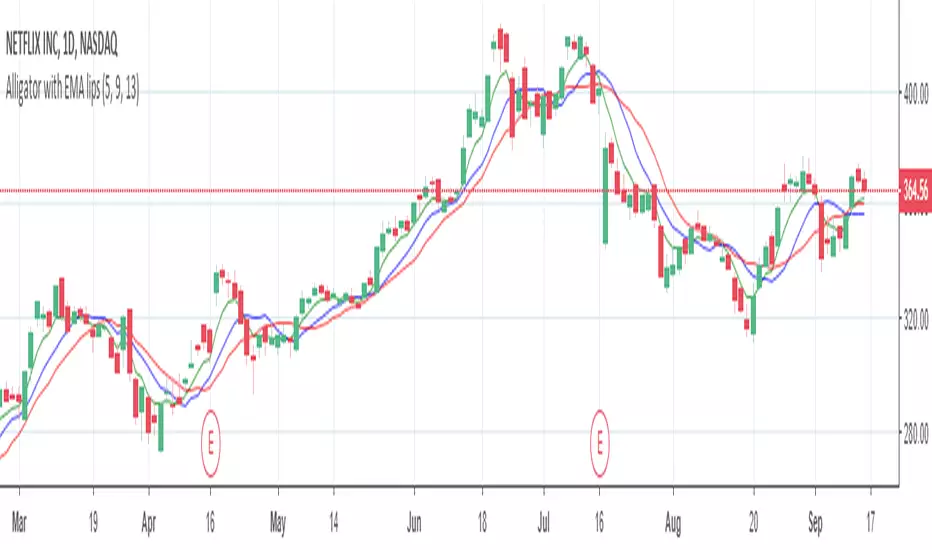
Alligator with EMA lipsI wanted Alligator but with lips, more sensitive to the latest data instead of the whole period. Made alligator with EMA lips.
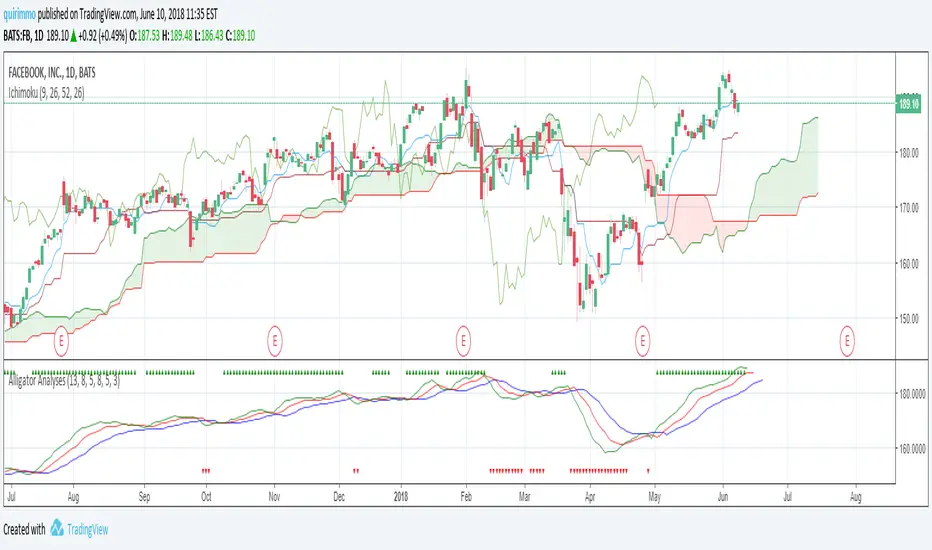
Alligator AnalysesA simple script in order to plot the Alligator Indicator with triangles plotted on the graph in order to see directly if the alligator is sleeping or eating.
You will see green up triangles when the alligator is bullish eating, while red down triangles when the alligator is bearish eating.
You will not see anything on the chart when the alligator is sleeping.
Bill Williams. Alligator, Fractals & Res/Sup combined (by vlkvr)Bill Williams indicators (each separately) are simple and quite self-sufficient, however, are most often used together. The key ones (Alligator and Fractals) are freely available and everyone can use them, but why use them on the chart separately, when "together more fun", and not conceivable, in my opinion, they are one without the other.
So, I present "split/copypasta" of two key indicators of Bill Williams, plus (as a bonus) visualization of "Support/Resistance" levels (and in fact, lines from extremes or the same fractals).
As a result, before you indicator "three-in-one".

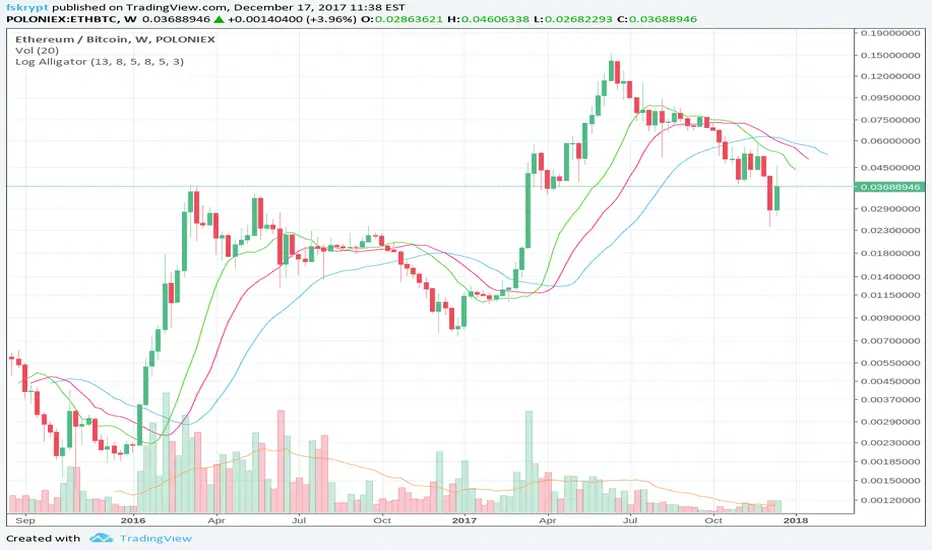
Log-space Williams AlligatorMake Williams Alligator usable for looking at weekly and high-volatility crypto charts.
The built-in indicator may have some problems with these charts, as in example below:
Bill Williams Divergent BarsBill William Bull/Bear divergent bars
See: Book, Trading Chaos by Bill Williams
Coded by polyclick
A bullish (green) divergent bar, signals a trend switch from bear -> bull
-> The current bar has a lower low than the previous bar, but closes in the upper half of the candle.
-> This means the bulls are pushing from below and are trying to take over, potentially resulting in a trend switch to bullish.
-> We also check if this bar is below the three alligator lines to avoid false positives.
A bearish (red) divergent bar, signals a trend switch from bull -> bear
-> The current bar has a higher high than the previous bar, but closes in the lower half of the candle.
-> This means the bears are pushing the price down and are taking over, potentially resulting in a trend switch to bearish.
-> We also check if this bar is above the three alligator lines to avoid false positives.
Best used in combination with the Bill Williams Alligator indicator.

ChaosThis script adds a Bill Williams Alligator to your charts and the three wisemen:
1. Wiseman 1 - Bullish or bearish divergent bars shown with a circle (be sure to check angulation manually).
2. Wiseman 2 - Super AO - with a square.
3 Wiseman 3 - Fractal with a triangle.
Be sure to wait until the current bar is closed before using these signals.
Reference: TradingChaos Version 2

True Williams Alligator (Timeframe Multiplier)Modified version of my original "True Williams Alligator (SMMA)" indicator that includes a multiplier to show the alligator (ie elliot wave mode) of higher timeframes. See original indicator for details.
Note: First script submission. Didn't mean to use this chart. Ugly and messy. Oops.
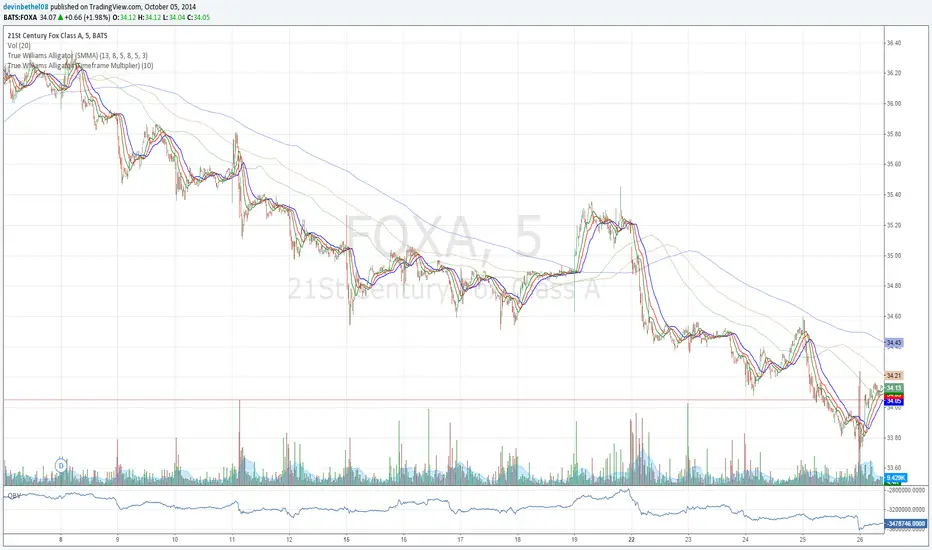
True Williams Alligator (Timeframe Multiplier)Modified version of the true alligator indicator (ie SMMA) that features a timeframe multiplier so that you can monitor the elliott wave of higher timeframes. (See original "True Williams Alligator" for more details.)
Note: First script submission. Didn't mean to use this chart. Also this is a duplicate post -- oops.

True Williams Alligator (SMMA)The built-in implementation of the alligator is incorrect. It uses SMA with altered input parameters to approximate the true alligator indicator.
The alligator was created with a supercomputer to model the elliott wave - it's very apart from other MA techniques. The built-in approximation (and similar techniques) and the true alligator yield very different conclusions. Hence the need for this, a true and exact implementation of "The Mighty Alligator" (Bill Williams, Trading Chaos 1, New Trading Dimensions, Trading Chaos 2).
Note: First script submission. Didn't mean to use this chart. Ugly and messy. Oops.

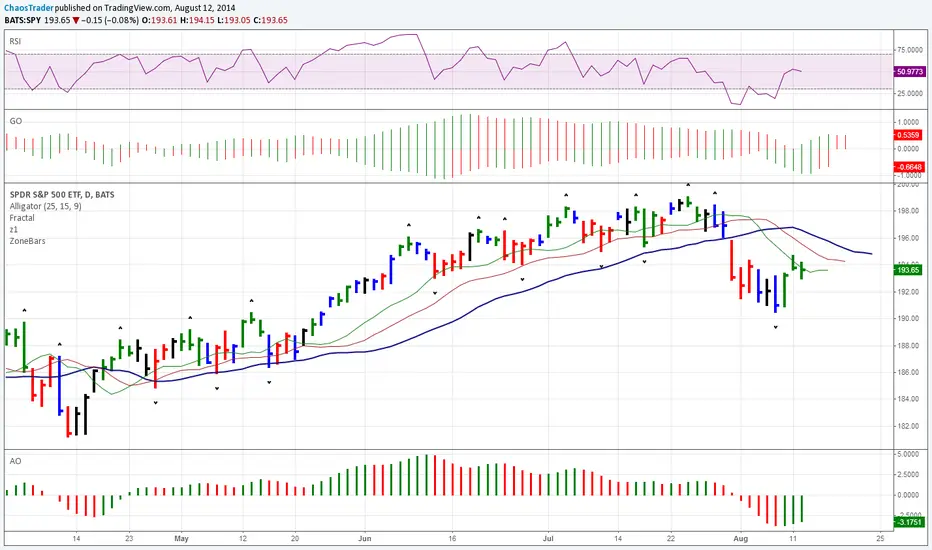
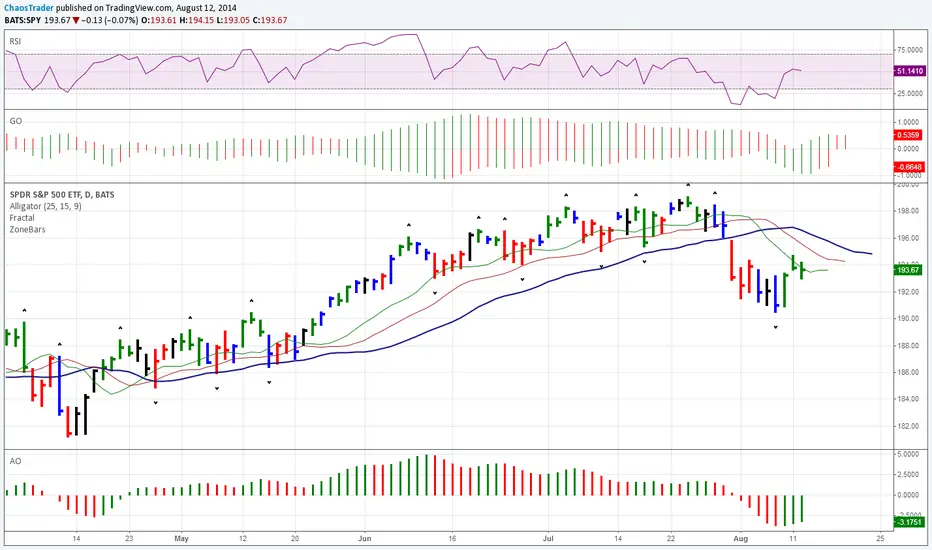
ZoneBarsBill Williams Zone and Squat Bars. See New Trading Dimensions by Bill Williams, PhD.
Bars are green (green zone) when the Awesome Oscillator and Accelerator/Decelerator are both positive.
Bars are red (red zone) when the Awesome Oscillator and Accelerator/Decelerator are both negative.
Bars are blue when a squat bar is formed, these indicate a battle between bulls and bears and often happen near trend continuation or trend changes.
Caution: Assumes chart is a bar chart - not a candle chart.
Caution: Squat bars are accurate only with official exchange volume data - BATS data will give false squat bars.