Correlate 21 coinsHey!
I remade some dude's script to add more coins.
Its a pearson correlation indicator, which would give us an idea of the main trend and behaviour of the pairs you choose.
Altcoin

The People's Indicator Swing TradeThe People's Indicator Swing Trade is the Longer Term Version of the People's Indicator. It will allow you to spot patterns.

Kairi FlyerThis indicator shows the divergence between FX and spot price.
bitFlyer FXBTCJPY
XBTUSD
ETHUSD
ADA
BCH
EOS
LTC
TRX
XRP

Current volatilityHello everyone.
Today an other small indicator that show the current volatility .
It works on all tickers ( crypto-currencies / others ) .
Method :
- ((high-low) * 100) / open
Hope it will be useful for you :)

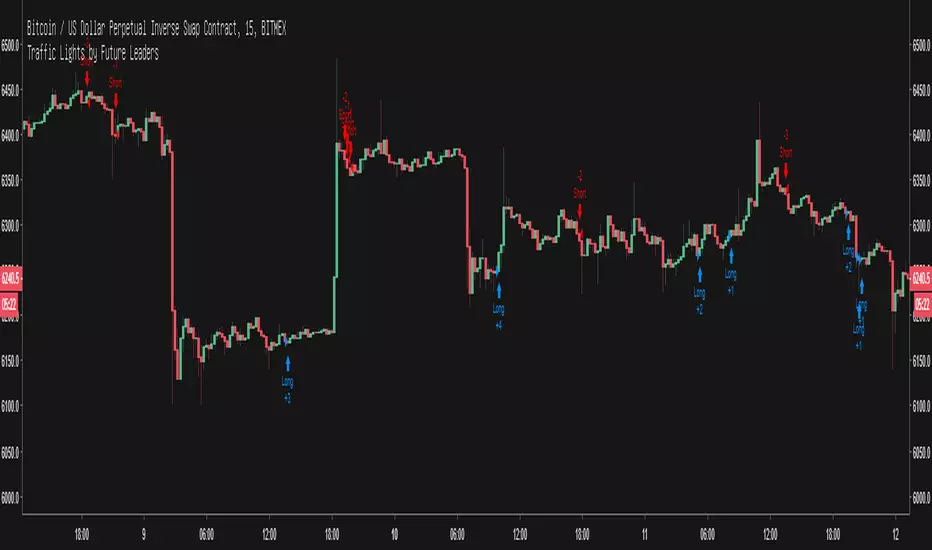
Short Selling BITMEX Alts (15min scalp strategy)So this is a strategy i made for trading BITMEX alts on 15minute timeframe.
Works simply. You get sell signal when it is considered overbought and way too far from its mean -> the moving average. So you short it with that moving average as the target. Sometimes it goes lower, since the sell signal represents resistance area and average represents support and they act accordingly. Might break through, might bounce back to entry. So its safer to exit at support then pray on breakdown, its 15min strategy afterall.
There is no defined stop loss on this strategy. When i trade it i take risk/reward setup and my stop is calculated based on reward from entry to target. Usually its 1R or above that,usually i use price action for that purpose. if you trade it manually you have advantage, since signal gets confirmed on candle close, yet it could appear as soon as candle opens. So if you dont want any additional risks - wait for candle close and short it. If you want to gamble it - enter and average it up as it goes until you meet your risk limit.
Here is how it is inteded to be traded.
This strategy does not account for limit fees on bitmex, so it wouldnt be much practical to entry AND exit with market orders. As you can see in example, simple 1.5% move would lose 1/3 of its reward if you used market entry+exit.
This one works on :
TRX
EOS
LTC
BCH
ADA
All 15 minute timeframes. Plus it showes really good results in spot exachnges too, if you want to use as a tool to exit spot exposure (binance chart, same symbols).
Contact for free trial here or at twitter.com (i post full perfomance on all pairs there)
Also check this strategies performance on BCHH contract on bitmex. Absolute banger.

CRYPTONYY TRADING MACHINEThia script will automatically gives you long and short signals.
WORKS ON ALL EXCHANGE.
SUITABLE FOR BITMEX TRADING.
FOR ALTCOINS TRADING GO FOR 30MIN OR ABOVE 30MIN TIMEFRAME.
AUTOMATIC STOP LOSS TRIGGER.
MORE NEW UPDATES COMING!!!

[SSABU] ALTCOIN-KRW-PRICE-TREND✅ ALTCOIN-KRW-PRICE-TREND Indicator.
This indicator is a supplementary indicator that notifies you of the original price of Altcoin in BTC Market in real time without checking the original chart.
The BTC market saturation value that the user sees is multiplied by the average value of the Brisim and the covit,
It tells you the original price of altcoin.
Look at the Satco chart on Altcorne in Binary's BTC market and do not check the chart of the coin price of the coin
You can also find out by checking only the secondary indicators.
✅ ALTCOIN-KRW-PRICE-TREND 지표 입니다.
본 지표는 BTC마켓에 있는 알트코인의 원화가격을 원화차트를 확인하지 않아도 실시간으로 알려주는 보조지표 입니다.
사용자가 보고있는 BTC마켓의 사토시값에 트레이딩뷰에서 지원하는 원화 차트인 빗썸과 코빗의 원화 평균값을 곱하여
알트코인의 원화가격을 저절로 알려줍니다.
바이낸스의 BTC마켓에 있는 알트코인의 사토시 차트를 보고 해당코인의 원화가격이 얼마인지 따로 차트를 확인하지 않고
보조지표만 확인하여도 알 수 있습니다.
✅ 매매에 도움되는 다른 보조지표
Basel major 2.21

Crypto Correlation Matrix Series [SHK]Hi everyone, Although everything's clear from the title but I should describe some basic points.
Currency Correlation is a statistical measure of how two securities move in relation to each other.
So this script is used to show if current pair (alt-coins) is moving in the same direction of bitcoin (or ethereum) or not. Consider that in crypto market most of alt-coins have correlation of +0.7 with bitcoin, So temporary changes in correlation may signal a reversal or sharp continuation for the alt-coin.
"1" : The alt coin is moving in same direction of Bitcoin (Or Ethereum).
"0" : The alt coin is moving in random direction compared to Bitcoin. (No movement relation)
"-1" : The alt coin is moving in opposite direction of Bitcoin.
Important Note: By default average of 15 bars back is measured to calculate the correlation by this script. Please test other periods and share the best options with us.
Comments are welcomed :)

MTF Deviation - Mtrl_ScientistHi everyone,
There are a lot of possible ways to look at markets and find valid patterns.
This time, I've looked at how shorter time frames deviate from the overall price consensus.
What you're seeing here is a range-bound difference of the lowest time frame from the overall price consensus (baseline), represented as blue line.
When lower time frames agree with the baseline, the difference becomes 0.
Logically, this difference cannot deviate too much from the baseline, and to quantify that, I've added fib-levels based on a deviation percentage that depends on price volatility and can be adjusted in the settings.
How it works:
First of all, you need to switch to the 1min time frame to get access to the lowest time frame data.
Look at how the blue line follows the support/resistance fib levels.
Oversold conditions are usually given by entering the lowest red band, whereas overbought conditions are given by entering the upper red band.
However, there are also extreme cases, where the blue line exceeds the set fib levels. In that case, price will reverse with very high likelihood.
Alternatively you can also ping-pong between two fib levels for frequent small trades.
Note that this indicator doesn't use any security functions to access time frame data. Instead, I found a different way to avoid repainting.
At the moment I'm just playing around with this to see how I can improve it. Feedback is very welcome!


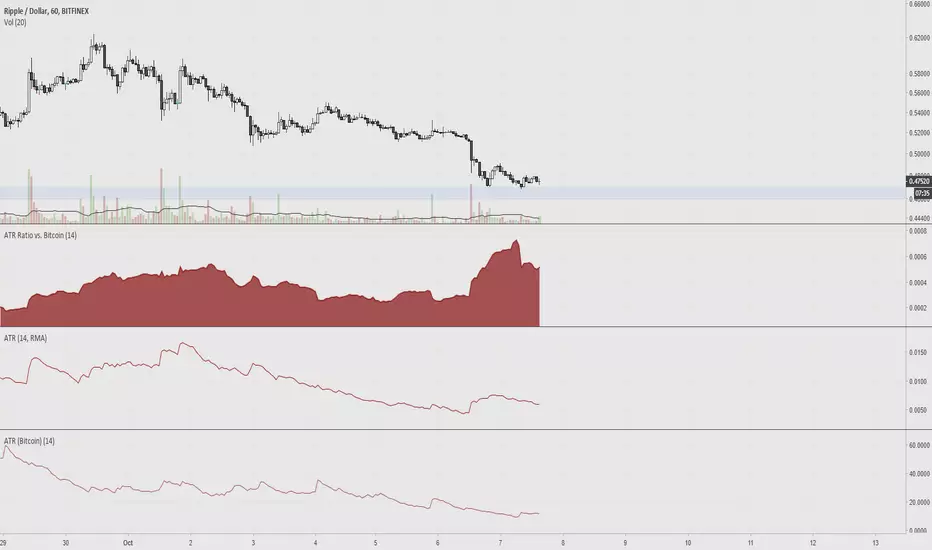
ATR Ratio vs. BitcoinAverage True Range is used to determine if a ticker's trading range is widening or narrowing, which is helpful for finding the trend or to use as a stop loss. The idea of this indicator is to compare the ATR of altcoins versus bitcoin, since volatility is low.
Leverage Trading Signal by Varun V2.0This Script is beased on leverage trading and the best past is, it has alert in all time frame
DPD INDICATOR (DEMA PRICE DİFFERENCE PERCENTAGE )I use DEMA and Price difference in many strategies and and trade.
Finally , ı wanted to build an indicator for relation between them.
It calculates the percentage of difference between price and dema and estimates deviation from the main trend.
Formula = (price-dema)/price*100
There is some parameters;
DEMA Length is length of dema , ı think 50 is good enough,
there is upper and lower band for DPD Score .
You can change it based on volatilities of your pairs to find an optima.
and use it to be sure about your entry point.
I will developed and combine DPD with some other indicators and build strategies with it.
You can be part of that , I am waiting for your feedback.
Stay in Touch :)

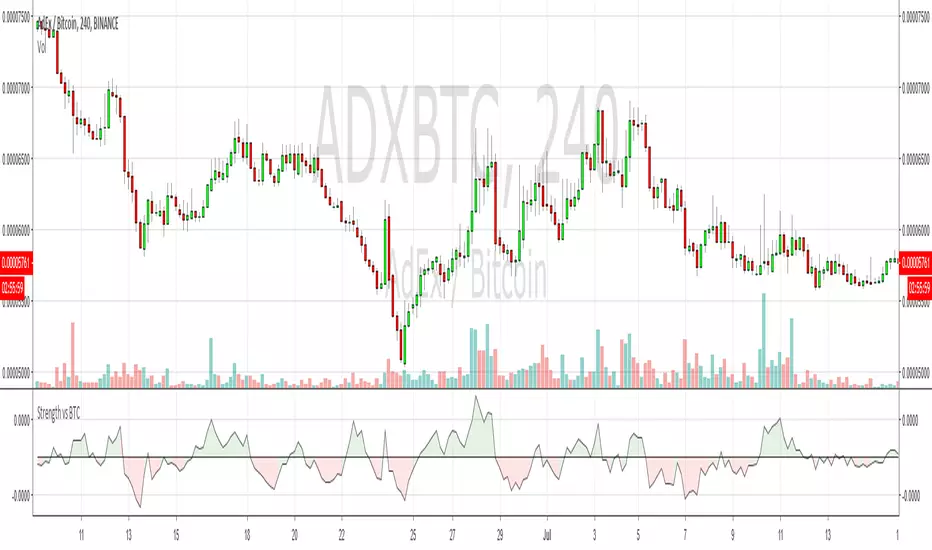
Strength Relative to BTCShows strength of the currently charted alt compared to BTCUSD. If BTC is going down or sideways and the alt is going up, then you'll see green and vice-versa for red. Good for quick at-a-glance strength evaluation when flying through a watchlist. The output uses a normalised moving average to reduce signal noise.
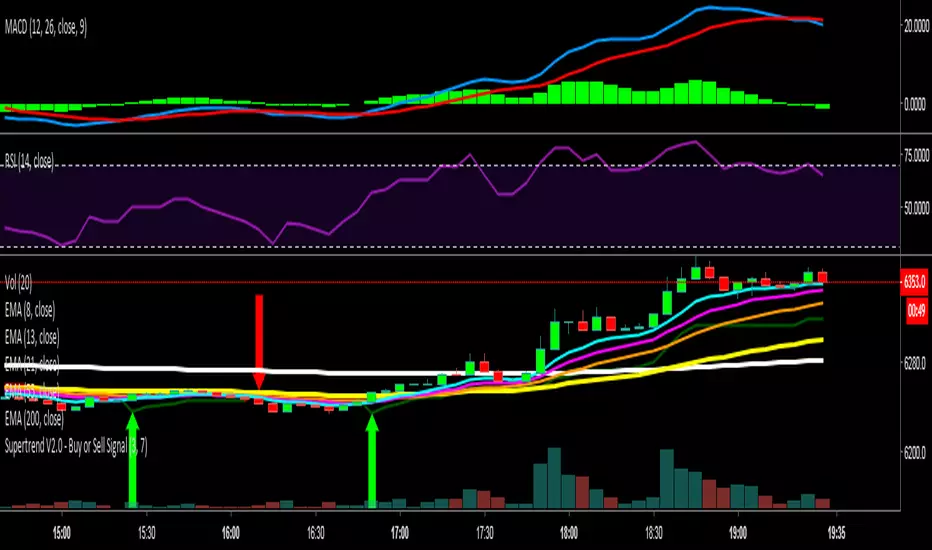
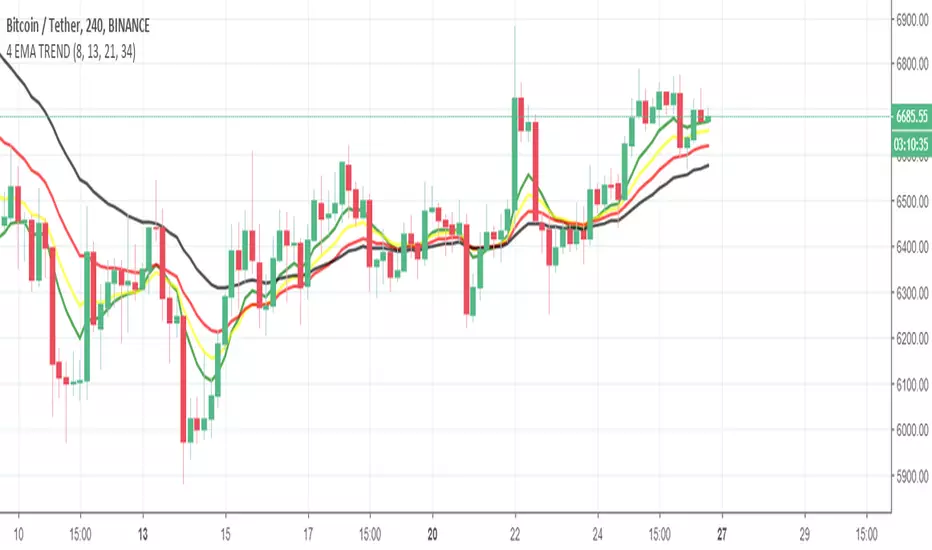
4 EMA TREND INDICATORİf GREEN > YELLOW > RED > BLACK
UPWARD TREND
If BLACK > RED > YELLOW > GREEN
DOWNWARD TREND
In upward trend , if green(fastest ema) crossunder YELLOW or RED or both of them , you can close the position . Dont wait the Downward Trend.
Lengths of EMAs are based on Fibonacci numbers ( 8,13,21,34) , if you want, you can change it based on your strategy.
[NG] Indicator - Altcoin Alpha - v1(Created for Client)
Alpha (Unique price action of asset) indicator for ALTcoins implementation, taking `BINANCE:BTCUSDT` as the market reference. Can be improved by adding more BTC charts from more sources, so as to get a unified chart of BTC for market representation.
Set `alpha period` to a value, wherein you want to see the unique price action of the asset. For short term trend, a value of 24 is good for `1H` charts (1 day), and value of 168 is good for long term trends on `1H` charts (1 week trend).
Corresponding values of `beta period` should be `168` (1 week for 1 day alpha) and `720` (1 month for 1 week alpha period).
You can set `alpha` and `beta` period as per your requirements.
Regards,

Bitcoin Multiple Moving Average 10, 20, 60 MA, 비트코인 다중 MABitcoin Multiple Moving Average 10, 20, 60 MA, 비트코인 다중 MA

40 DOMINANT ALTCOINS BINANCEThis indicator is a combination of 40 different altcoins which are found on Binance exchange.
I have listed all Binance altcoins in the order of the oldest listed and the newest.
Due to limitations on TV for calling only 40 securities at the same time, I have limited myself with adding only the oldest ones (9+ months) and some 8+ to make up at least 40 for more data.
I have excluded BTC, BCC, ETH, USDT, BNB from list as these are the trading pairs.
I have some updates in mind and will try to add more options in coming months
Regularly updating 40 altcoins list by sorting them by market cap and available historical data from Binance
Adding Bitfinex, Bittrex and other exchanges separetly, as there is only 40 security call limit
Adding ETH; USDT pairs for all above exchanges.
You can add any indicator to this indicator - such as MACD, RSI, EMA and so on to help you analyse it more deeper
When you load this indicator, it takes about 1 min wait as it takes and calculates a lot of data. After it is loaded, it works perfectly.
Currently there is only 40 oldest altcoins to gather enough data, but as time passes, I will change some of them to create better picture of alt coins.
Please report any problems and give feedback.
Any idea of improvement is welcome and I will try my best.
Please support me an consider to give a small tip to addresses bellow. It would greatly help me to free more time for improvements as I am working to support family and my time is limited for markets.
ETH: 0xac290B4A721f5ef75b0971F1102e01E1942A4578
BTC: 39p3rKuJYKGqph1Qs35yEfNWoPvpUJBBcy
This will greatly help me to keep update this indicator and give me more time to analyse and sort out all altcoins my their market cap, volume and influence.

EMAcrossover_RSI Buy/sell signal-TRXBTC_15min by rajista EMAcrossover_RSI Buy/sell signal Strategy
To be used in combination with Alerts script, both can be added to your tradingview charts (Chart time-frame should be set to 15min) like you add any other simple indicator.
Add this script to your favorites and once you have been granted access, you will be notified in your Tradingview notifications section, then you can go ahead and add these two scripts into your charts from your favorite section of Indicator menu in Tradingview.
Benefits of this strategy:
1> Fully automated buy/sell signals 24x7
2>Your trades will always be based on a certain entry and exit plan.
3>No emotions involved with these trading calls, so no chance of FOMO buying/Panic Sell
4>You can fully customize the settings with a simple click(customization details given below)
5>Its completely free of cost!!!
There are two parts of this automated trading call system:
1>Strategy script- Gives the buy/sell signals based on the settings provided.
2>Alert script- Gives Alert notifications in tradingview when a buy/sell call is made.
Principle of working is very simple to understand:
Stragey script makes:
Buy call - When the 9EMA crosses above the 21EMA or RSI level-20 is reached in 15min-Chart.
Sell call -When 9EMA crosses below the 21EMA or RSI level-70 is reached in 15min-Chart.
Above values of EMA's and RSI are default values , which can be changed easily in settings panel of Strategy script.
Alert Script allows you to add Alerts when these buy/sell calls are made.
To create a Buy call alert:
1> Click on the create alert icon in your chart (top-centre)
2>Click on Condition -drop down button and select EMAcross_rsi_Alerts
3>Below that bar you will see another bar titled "Buy"-click on its drop down menu and select "Crossing Down"
4>Below that bar right next to Value change 0 to 0.9.
5>Set expiration date for your alerts as per your wish
6>Ensure "Show Popup" and "Play sound" is checked
7>You can check option of sending the alert to your email also.
Finally click on create.
To create Sell Alert:
Repeat same process, except that, after step 2- Do this- change the "long" option to "short" by clicking on the drop down menu right next to the first bar.
Click on create, Finally both of your automated buy/sell call alerts will be configured.
I know its been 2-3 days since i tweeted about this strategy and now i am making it available, you can understand i had to put in a lot of working hours, towards creating the source code for the strategy script and then for alerts script and even more so towards finding the perfect default settings which can be used straight away by anyone, even if you are new in crypto trading, apart from the time which i dedicate to analyse charts and pass on the knowledge/info to you all.
My next post will be even more helpful to you people as i am currently testing "fully automated trading" yea you heard that right!! - This system will trade 24x7 for you guys/girls no matter wherever you are either you are sleeping or watching a movie, your trades would still be getting executed with a proper entery-exit plan on a crypto exchange.
Altcoin-BTC TidesRider (beats Buy & Hold) BINANCE:EOSBTC
参数基于Binance的EOSBTC。不同交易对有不同DNA,没有万金油策略,需要调整参数。
基于均线
双均线过滤信号
Haiken Ashi蜡烛图过滤信号
通过量能放大来“偷鸡”赚取利润
不断改进中.
Based on Moving Average
Use dual SMA to filter false signals
Use Haiken Ashi candlesticks to filter false signals
Volume sensitive buy and sell to obtain higher profit
Default settings are based on EOSBTC on Binance and are overfitted to produce good backtest results, however this is normal as each trading pair has its own DNA hence optimal settings.
I welcome suggestions of improvements.
Ongoing improvement.
Contact me for subscription.
Disclaimer: The strategy does not form or provide financial advice regarding investment. Use at your own risk.

CryptoMatt Ultra GaintradingThis script is used for daytrading the 5 min chart with autoview. Autoview allows alerts to be sent and then executes the trades on crypto exchanges. This strategy uses 2 different notifications to execute trades, a simple EMA cross, as well as a buy when in the green or sell in the red. This is still a work in progress but so far is profitable with trading alts.

Custom Time ranges
Description:
This script colours the background of any time range you specify, including weekend periods.
It can be useful for spotting patterns on Bitcoin (recurring times of buying or selling).
Checkboxes to switch on and off. Inputs to specify time and day of week.
Monday = 2
Tuesday = 3
Wednesday = 4
Thursday = 5
Friday = 6
Saturday = 7
Sunday = 1
Example 1:
1500-1800:2
This will colour the background between 3pm and 6pm on Mondays.
Example 2:
0000-0600:247
This will colour the background between midnight and 6am on Mondays, Wednesdays, and Saturdays.
Any questions you may have, please leave in comments below and I'll respond when I have time.
