MaxEvolved Japanese CloseShow the closing price of the Japanese candle. Usefull with Heiken Ashi.
Afficher le prix de fermeture de la chandelle japonaise. Utile pour Heiken Ashi.
Ashi

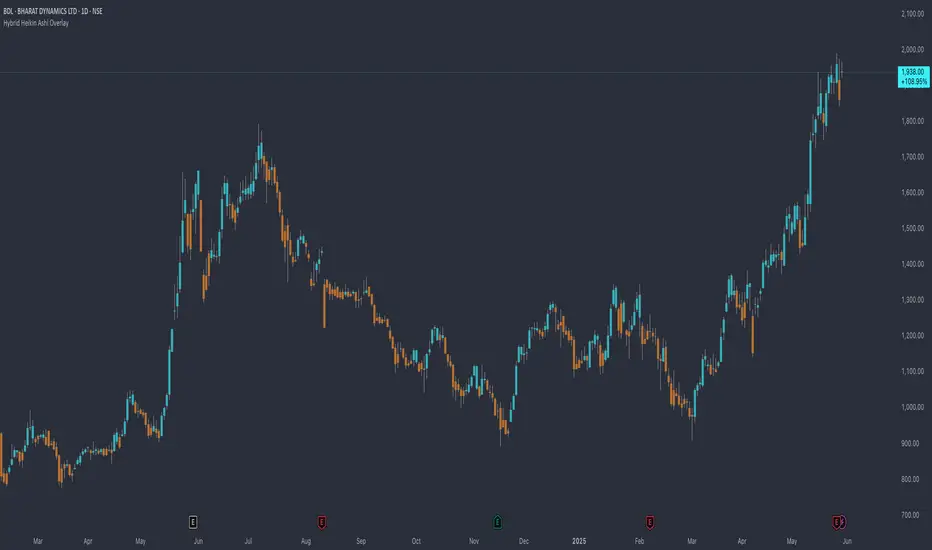
Hybrid Heikin Ashi OverlayHybrid Heikin Ashi Overlay
I personally like Heikin Ashi for its simplicity in showing clean trends. However, it tends to smooth out price action so much that we sometimes miss key signals from the actual candles.
This indicator overlays Heikin Ashi-style background colors while keeping regular candles intact — giving you the best of both worlds:
• Smoother trend visibility
• No loss of execution precision
• Customizable colors & transparency
🔹 No repainting
🔹 No strategy logic — purely visual
🔹 Designed to reduce clutter and help traders stay focused on structure
Created by: @yug_and_her
Heikin-Ashi Reversals with Region & DotsIf you want to use Heiken Ashi candles as a way to screen for bullish and bearish reversal.
Green background is stay long and strong. Red background = potential top or bearish continuation.
Yellow dots show strong red heiken ashi candles with small upside wicks. The next candle determines whether it should be green or red. If next heiken ashi candle closes above the current candle = green, bull trend still in line. If next heiken ashi candle closes below, then time to sell

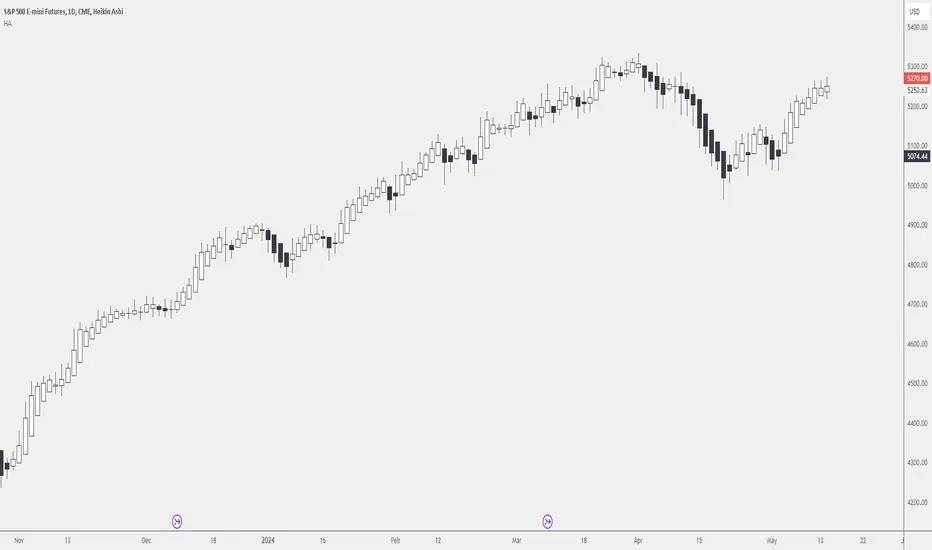
SuperTrend Heikin AshiSupertrend Heikin Ashi is an indicator based on the standard calculation of the Supertrend with the difference of using the Open and Close value of the Heikin Ashi candles instead of the normal Candle Sticks.
In this way the main characteristic of the HA candles is exploited, thus filtering movements that could generate false signals.
I recommend using SPY, SPX, QQQ to be aware of the market situation, not operating (or paying great attention) long on stocks when the indicator is red and the price is below the drawn line.

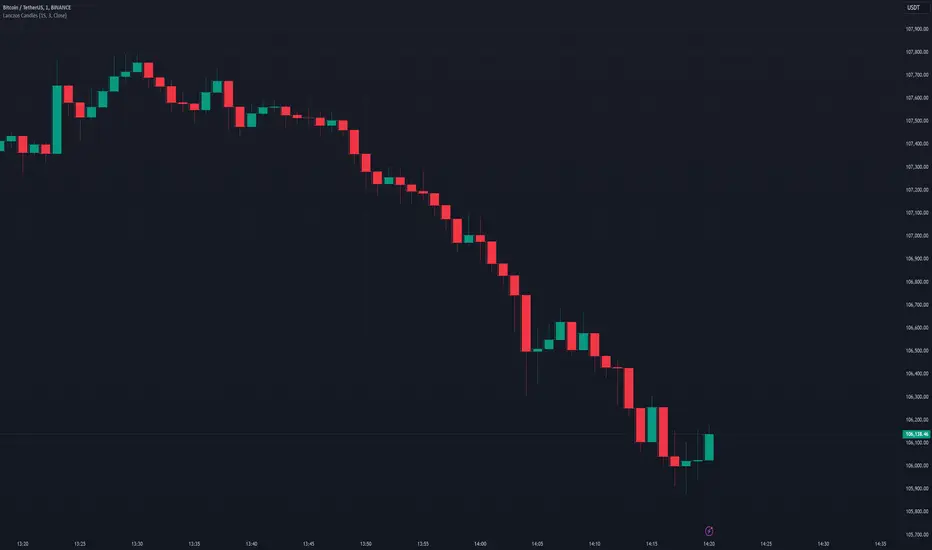
Lanczos CandlesThis indicator reconstructs price action using Lanczos resampling, incorporating lower timeframe data to create a more detailed representation of market movements. Traditional candle aggregation on higher timeframes tends to lose some price action detail - this indicator attempts to preserve more of that information through mathematical resampling.
The indicator samples price data from a lower timeframe and uses the Lanczos algorithm, a mathematical method commonly used in signal processing and image resampling, to reconstruct the price series at the chart's timeframe. The process helps maintain price movements that might otherwise be smoothed out in regular candle aggregation.
The main settings allow you to select the source timeframe for sampling, adjust the Lanczos filter width to balance smoothness versus detail preservation, and optionally enable Heikin Ashi calculation. The filter width parameter (default: 3) affects how aggressive the smoothing is - higher values produce smoother results while lower values retain more of the original variation.
This approach can be useful for technical analysis when you want to work with higher timeframes while maintaining awareness of significant price movements that occurred within those candles. The optional Heikin Ashi mode can help visualize trends in the resampled data.
The indicator works best when there's a clear ratio between your chart timeframe and the source timeframe (for example, using 1-minute data to build 5-minute candles).
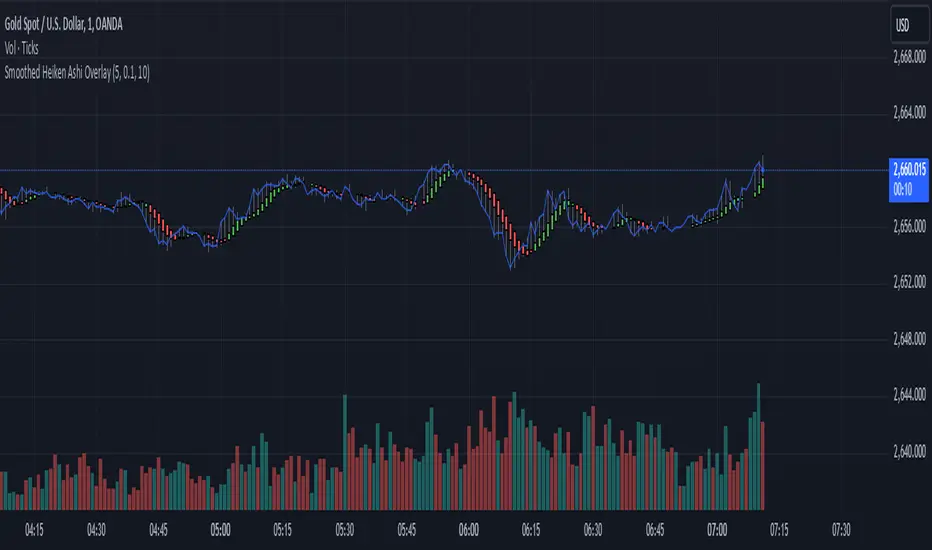
Smoothed Heiken Ashi Trend FilterThis indicator applies the Heiken Ashi technique with added smoothing and trend filtering to help reduce noise and improve trend detection.
Components of the Indicator:
Heiken Ashi Calculations:
Heiken Ashi Close (ha_close): This is the smoothed average of the current bar’s open, high, low, and close prices, calculated with a simple moving average (SMA) to filter out noise.
Heiken Ashi Open (ha_open): This is the average of the previous Heiken Ashi Open and the current Heiken Ashi Close. It’s also initialized to smooth the transition on the first bar.
Heiken Ashi High (ha_high) and Low (ha_low): These values are calculated as the highest and lowest values among the high, Heiken Ashi Open, and Heiken Ashi Close for each bar.
Smoothing and Noise Reduction:
Smoothing Length: The indicator applies a smoothing length to the Heiken Ashi Close, calculated with an SMA. This reduces minor fluctuations, giving a clearer view of the price action.
Minimum Body Size Filter: This filter calculates the body size of each Heiken Ashi candle and compares it to a percentage of the Average True Range (ATR). Only significant candles (those with larger bodies) are plotted, reducing weak or indecisive signals.
Trend Filtering with Moving Average:
The indicator uses a simple moving average (SMA) as a trend filter. By comparing the Heiken Ashi Close to the moving average:
Bullish Trend: The Heiken Ashi candle is green when it’s above the moving average.
Bearish Trend: The Heiken Ashi candle is red when it’s below the moving average.
How to Use This Indicator:
Trend Identification:
Green candles signify a bullish trend, while red candles signify a bearish trend.
The smoothing and trend filtering make it easier to identify sustained trends and avoid reacting to short-term fluctuations.
Filtering Out Noise:
Minor price fluctuations and small-bodied candles (often resulting in indecisive signals) are filtered out, leaving only significant signals.
Adjustable Parameters:
Smoothing Length: Controls the degree of smoothing applied to the Heiken Ashi Close value. Increasing this value will make the Heiken Ashi candles smoother.
Minimum Body Size: This is a percentage of the ATR, used to filter out small or indecisive candles.
Trend Moving Average Length: Controls the period of the moving average used as a trend filter.
This Smoothed Heiken Ashi Trend Filter indicator is useful for identifying trends and filtering out noisy signals. By smoothing and filtering, it helps traders focus on the overall trend rather than minor price movements.
Let me know if there’s anything more you’d like to add or adjust!
OBV based on Heikin-AshiDescription
This indicator calculates the On-Balance Volume (OBV) based on Heikin-Ashi candles rather than regular candlesticks.
OBV based on Heikin-Ashi: The OBV is calculated based on Heikin-Ashi candle trends. Volume is added when the Heikin-Ashi close is above the open (bullish) and subtracted when the close is below the open (bearish).
Volume Analysis: This approach helps traders identify significant volume shifts in a smoother trend environment, reducing market noise that often accompanies traditional candlestick charts.
説明
このインジケーターは、通常のローソク足ではなく、平均足(Heikin-Ashi)を基にオンバランス・ボリューム(OBV)を計算します。
平均足に基づくOBV: OBVは、平均足のトレンドに基づいて計算されます。平均足の終値が始値を上回った場合(陽線)は出来高が加算され、終値が始値を下回った場合(陰線)は出来高が減算されます。
出来高分析: この手法により、通常のローソク足チャートで発生するノイズを軽減し、滑らかなトレンド環境で重要な出来高の変化を把握できます。

Heikin Ashi & Swing Highs/LowsHeikin Ashi & Swing Highs/Lows
Indicator Description:
The "Heikin Ashi & Swing Highs/Lows" indicator combines Heikin Ashi candle analysis with the identification of significant swing highs and lows on the chart. This indicator is useful for traders looking to spot trend changes and key points in the market.
Key Features:
Heikin Ashi:
Calculation and Visualization: Utilizes the Heikin Ashi method to smooth out the candlestick chart, helping to visualize trends and reduce market noise. Heikin Ashi candles are calculated from the standard candles (Open, High, Low, Close) and are displayed on the chart with a green color for bullish signals and red for bearish signals.
Vertical Offset Adjustment: Provides options to adjust the vertical offset of the candles based on the selected timeframe, with specific adjustments for short, medium, long, and super-long periods.
Swing Highs/Lows:
Key Point Identification: Marks significant swing highs and lows on the chart using a configurable period. Swing highs are displayed in red and swing lows in green.
Candlestick Patterns: Detects and labels common candlestick patterns such as:
Hammer: A bullish candlestick pattern with a small body and a long lower wick.
Inverted Hammer: Similar to the Hammer, but with a long upper wick.
Bullish Engulfing: A two-candle pattern where a bullish candle completely engulfs a previous bearish candle.
Hanging Man: A bearish pattern with a small body and a long lower wick, appearing at the end of an uptrend.
Shooting Star: A bearish pattern with a small body and a long upper wick, appearing at the end of an uptrend.
Bearish Engulfing: A two-candle pattern where a bearish candle completely engulfs a previous bullish candle.
Settings:
Timeframe: Allows you to select the desired timeframe to adjust the Heikin Ashi candle analysis.
Vertical Offset: Customize the vertical offset of Heikin Ashi candles based on the selected timeframe.
Swing Point Style: Configure the colors of the significant swing highs and lows on the chart.
Recommended Use:
This indicator is ideal for traders looking for a clear representation of trends through Heikin Ashi candles and who want to identify key reversal points in the market by detecting swing highs/lows and candlestick patterns.
Benefits:
Facilitates the identification of smooth trends and trend reversals.
Provides a clear visual representation of critical market points.
Helps traders recognize important candlestick patterns that may indicate changes in market direction.

Optimized Heikin Ashi Strategy with Buy/Sell OptionsStrategy Name:
Optimized Heikin Ashi Strategy with Buy/Sell Options
Description:
The Optimized Heikin Ashi Strategy is a trend-following strategy designed to capitalize on market trends by utilizing the smoothness of Heikin Ashi candles. This strategy provides flexible options for trading, allowing users to choose between Buy Only (long-only), Sell Only (short-only), or using both in alternating conditions based on the Heikin Ashi candle signals. The strategy works on any market, but it performs especially well in markets where trends are prevalent, such as cryptocurrency or Forex.
This script offers customizable parameters for the backtest period, Heikin Ashi timeframe, stop loss, and take profit levels, allowing traders to optimize the strategy for their preferred markets or assets.
Key Features:
Trade Type Options:
Buy Only: Enter a long position when a green Heikin Ashi candle appears and exit when a red candle appears.
Sell Only: Enter a short position when a red Heikin Ashi candle appears and exit when a green candle appears.
Stop Loss and Take Profit:
Customizable stop loss and take profit percentages allow for flexible risk management.
The default stop loss is set to 2%, and the default take profit is set to 4%, maintaining a favorable risk/reward ratio.
Heikin Ashi Timeframe:
Traders can select the desired timeframe for Heikin Ashi candle calculation (e.g., 4-hour Heikin Ashi candles for a 1-hour chart).
The strategy smooths out price action and reduces noise, providing clearer signals for entry and exit.
Inputs:
Backtest Start Date / End Date: Specify the period for testing the strategy’s performance.
Heikin Ashi Timeframe: Select the timeframe for Heikin Ashi candle generation. A higher timeframe helps smooth the trend, which is beneficial for trading lower timeframes.
Stop Loss (in %) and Take Profit (in %): Enable or disable stop loss and take profit, and adjust the levels based on market conditions.
Trade Type: Choose between Buy Only or Sell Only based on your market outlook and strategy preference.
Strategy Performance:
In testing with BTC/USD, this strategy performed well in a 4-hour Heikin Ashi timeframe applied on a 1-hour chart over a period from January 1, 2024, to September 12, 2024. The results were as follows:
Initial Capital: 1 USD
Order Size: 100% of equity
Net Profit: +30.74 USD (3,073.52% return)
Percent Profitable: 78.28% of trades were winners.
Profit Factor: 15.825, indicating that the strategy's profitable trades far outweighed its losses.
Max Drawdown: 4.21%, showing low risk exposure relative to the large profit potential.
This strategy is ideal for both beginner and advanced traders who are looking to follow trends and avoid market noise by using Heikin Ashi candles. It is also well-suited for traders who prefer automated risk management through the use of stop loss and take profit levels.
Recommended Use:
Best Markets: This strategy works well on trending markets like cryptocurrency, Forex, or indices.
Timeframes: Works best when applied to lower timeframes (e.g., 1-hour chart) with a higher Heikin Ashi timeframe (e.g., 4-hour candles) to smooth out price action.
Leverage: The strategy performs well with leverage, but users should consider using 2x to 3x leverage to avoid excessive risk and potential liquidation. The strategy's low drawdown allows for moderate leverage use while maintaining risk control.
Customization: Traders can adjust the stop loss and take profit percentages based on their risk appetite and market conditions. A default setting of a 2% stop loss and 4% take profit provides a balanced risk/reward ratio.
Notes:
Risk Management: Traders should enable stop loss and take profit settings to maintain effective risk management and prevent large drawdowns during volatile market conditions.
Optimization: This strategy can be further optimized by adjusting the Heikin Ashi timeframe and risk parameters based on specific market conditions and assets.
Backtesting: The built-in backtesting functionality allows traders to test the strategy across different market conditions and historical data to ensure robustness before applying it to live trading.
How to Apply:
Select your preferred market and chart.
Choose the appropriate Heikin Ashi timeframe based on the chart's timeframe. (e.g., use 4-hour Heikin Ashi candles for 1-hour chart trends).
Adjust stop loss and take profit based on your risk management preference.
Run backtesting to evaluate its performance before applying it in live trading.
This strategy can be further modified and optimized based on personal trading style and market conditions. It’s important to monitor performance regularly and adjust settings as needed to align with market behavior.

Heikin Ashi Price DetectionThis script performs custom calculations for both bullish and bearish bars, providing a numerical result that can be used to gauge price movements and potential trading signals.
How It Works
Bullish Bars:
Calculates the absolute difference between the open and low prices (BullOpenLow).
Calculates the absolute difference between the high and close prices (BullHighClose).
Compares BullOpenLow and BullHighClose:
If BullOpenLow is greater, the difference is divided by BullOpenLow.
If BullHighClose is greater, the difference is divided by BullHighClose.
The result is normalized to a percentage and subtracted from 100 to produce a final value.
Bearish Bars:
Calculates the absolute difference between the close and low prices (BearCloseLow).
Calculates the absolute difference between the high and open prices (BearHighOpen).
Compares BearCloseLow and BearHighOpen:
If BearCloseLow is greater, the difference is divided by BearCloseLow.
If BearHighOpen is greater, the difference is divided by BearHighOpen.
The result is normalized to a percentage and subtracted from 100 to produce a final value.
Key Features
Bullish and Bearish Calculations: The script identifies bullish and bearish bars and applies separate calculations to each.
Normalized Results: The calculations provide a normalized result that can be easily interpreted.
Visual Representation: Results are plotted on the chart for quick visual reference.

Pivot Points with MID LevelsThis indicator shows the Standard Pivot Points level based on daily values that can act as support and resistance. It is used by a variety of traders around the world. You can select which time frame Pivot Point Levels you'd like. Daily, weekly etc... Perfect for swing trading or day trading.
Pivot Points- Shows 3 levels of resistance, the Pivot Point and 3 levels of support
(R3, R2, R1, PIVOT POINT, S1, S2, S3
MID Levels- The MID levels are 50% retracement from the pivot point level above it and below
Example- R3, MID, R2, MID, R1, MID, PIVOT POINT, MID, S1, MID, S2, MID, S3
With this indicator you will also have the option to show the Previous days High and Low that are also important levels. On gap up/down days it is always interesting to see if price will close the gap, hence the important level to note.
PDH= Previous Days High
PDL= Previous Days Low
I have added a feature that you can now select specific color to each level and the line style for each level to help understand which levels are being show by personal needs.
Happy Trading

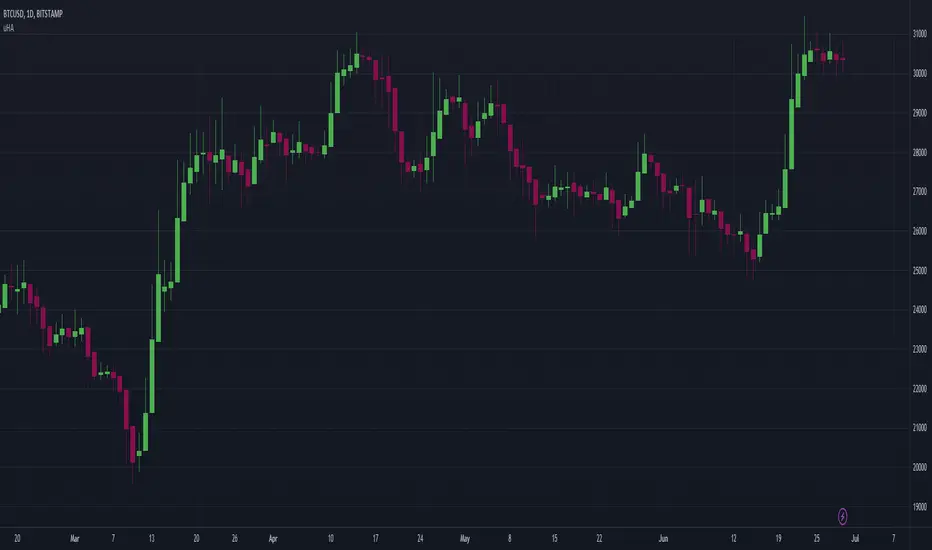
Dead Simple Heikin Ashi Candles (HA Candles)Are you looking for a dead simple calculation of the Heikin Ashi candles as they are calculated in tradingview? Here it is!
I was looking through the library and I saw that many have come up with a lot of awesome scripts using heikin ashi candles. But, I can't find anywhere that had the straightforward simple version of how Tradingview calculates them. This was a problem for me because I realized after punching the formula in that TradingView doesn't calculate HA candles in the original way.
You might say they don't calculate them the "right" but, spoiler alert, there is no right in trading. You can only be rational or irrational as you make money or lose money.
This is useful to me for building out some portions of an algo that are not going to be compatible with the built-in function. It happens. So, if you were looking for it too, hopefully it saves you some time.
For reference the original calc of HA candles is:
o = (prev_HA_open + prev_HA_close) / 2
h = math.max(high, ha_open, ha_close)
l = math.min(low, ha_open, ha_close)
c = ohlc4
Trade Well.
Heikin Ashi RSI + OTT [Erebor]Relative Strength Index (RSI)
The Relative Strength Index (RSI) is a popular momentum oscillator used in technical analysis to measure the speed and change of price movements. Developed by J. Welles Wilder, the RSI is calculated using the average gains and losses over a specified period, typically 14 days. Here's how it works:
Description and Calculation:
1. Average Gain and Average Loss Calculation:
- Calculate the average gain and average loss over the chosen period (e.g., 14 days).
- The average gain is the sum of gains divided by the period, and the average loss is the sum of losses divided by the period.
2. Relative Strength (RS) Calculation:
- The relative strength is the ratio of average gain to average loss.
The RSI oscillates between 0 and 100. Traditionally, an RSI above 70 indicates overbought conditions, suggesting a potential sell signal, while an RSI below 30 suggests oversold conditions, indicating a potential buy signal.
Pros of RSI:
- Identifying Overbought and Oversold Conditions: RSI helps traders identify potential reversal points in the market due to overbought or oversold conditions.
- Confirmation Tool: RSI can be used in conjunction with other technical indicators or chart patterns to confirm signals, enhancing the reliability of trading decisions.
- Versatility: RSI can be applied to various timeframes, from intraday to long-term charts, making it adaptable to different trading styles.
Cons of RSI:
- Whipsaws: In ranging markets, RSI can generate false signals, leading to whipsaws (rapid price movements followed by a reversal).
- Not Always Accurate: RSI may give false signals, especially in strongly trending markets where overbought or oversold conditions persist for extended periods.
- Subjectivity: Interpretation of RSI levels (e.g., 70 for overbought, 30 for oversold) is somewhat subjective and can vary depending on market conditions and individual preferences.
Checking RSIs in Different Periods:
Traders often use multiple timeframes to analyze RSI for a more comprehensive view:
- Fast RSI (e.g., 8-period): Provides more sensitive signals, suitable for short-term trading and quick decision-making.
- Slow RSI (e.g., 32-period): Offers a smoother representation of price movements, useful for identifying longer-term trends and reducing noise.
By comparing RSI readings across different periods, traders can gain insights into the momentum and strength of price movements over various timeframes, helping them make more informed trading decisions. Additionally, divergence between fast and slow RSI readings may signal potential trend reversals or continuation patterns.
Heikin Ashi Candles
Let's consider a modification to the traditional “Heikin Ashi Candles” where we introduce a new parameter: the period of calculation. The traditional HA candles are derived from the open 01, high 00 low 00, and close 00 prices of the underlying asset.
Now, let's introduce a new parameter, period, which will determine how many periods are considered in the calculation of the HA candles. This period parameter will affect the smoothing and responsiveness of the resulting candles.
In this modification, instead of considering just the current period, we're averaging or aggregating the prices over a specified number of periods . This will result in candles that reflect a longer-term trend or sentiment, depending on the chosen period value.
For example, if period is set to 1, it would essentially be the same as traditional Heikin Ashi candles. However, if period is set to a higher value, say 5, each candle will represent the average price movement over the last 5 periods, providing a smoother representation of the trend but potentially with delayed signals compared to lower period values.
Traders can adjust the period parameter based on their trading style, the timeframe they're analyzing, and the level of smoothing or responsiveness they prefer in their candlestick patterns.
Optimized Trend Tracker
The "Optimized Trend Tracker" is a proprietary trading indicator developed by TradingView user ANIL ÖZEKŞİ. It is designed to identify and track trends in financial markets efficiently. The indicator attempts to smooth out price fluctuations and provide clear signals for trend direction.
The Optimized Trend Tracker uses a combination of moving averages and adaptive filters to detect trends. It aims to reduce lag and noise typically associated with traditional moving averages, thereby providing more timely and accurate signals.
Some of the key features and applications of the OTT include:
• Trend Identification: The indicator helps traders identify the direction of the prevailing trend in a market. It distinguishes between uptrends, downtrends, and sideways consolidations.
• Entry and Exit Signals: The OTT generates buy and sell signals based on crossovers and direction changes of the trend. Traders can use these signals to time their entries and exits in the market.
• Trend Strength: It also provides insights into the strength of the trend by analyzing the slope and momentum of price movements. This information can help traders assess the conviction behind the trend and adjust their trading strategies accordingly.
• Filter Noise: By employing adaptive filters, the indicator aims to filter out market noise and false signals, thereby enhancing the reliability of trend identification.
• Customization: Traders can customize the parameters of the OTT to suit their specific trading preferences and market conditions. This flexibility allows for adaptation to different timeframes and asset classes.
Overall, the OTT can be a valuable tool for traders seeking to capitalize on trending market conditions while minimizing false signals and noise. However, like any trading indicator, it is essential to combine its signals with other forms of analysis and risk management strategies for optimal results. Additionally, traders should thoroughly back-test the indicator and practice using it in a demo environment before applying it to live trading.
The following types of moving average have been included: "SMA", "EMA", "SMMA (RMA)", "WMA", "VWMA", "HMA", "KAMA", "LSMA", "TRAMA", "VAR", "DEMA", "ZLEMA", "TSF", "WWMA". Thanks to the authors.
Thank you for your indicator “Optimized Trend Tracker”. © kivancozbilgic
Thank you for your programming language, indicators and strategies. © TradingView
Kind regards.
© Erebor_GIT

RSI in Candlestick MODEDescription:
The "RSI Bar" indicator is a versatile tool designed to enhance your technical analysis on trading charts. This Pine Script™ code calculates the Relative Strength Index (RSI) for open, close, high, and low prices, and represents the results as bars on the chart. The bars are color-coded based on whether the closing RSI is higher or lower than the opening RSI.
Additionally, the indicator incorporates advanced features such as Pareto analysis and Gaussian smoothing. The Pareto analysis helps identify significant lows and highs in the RSI, providing insights into potential trend reversals. The Gaussian smoothing further refines the analysis, contributing to a more accurate representation of the average RSI trend.
Key Features:
RSI calculation for open, close, high, and low prices.
Color-coded bars for easy visualization of RSI trends.
Pareto analysis to highlight key RSI levels indicating potential reversals.
Gaussian smoothing for improved trend analysis and visualization.
Heiken-Ashi

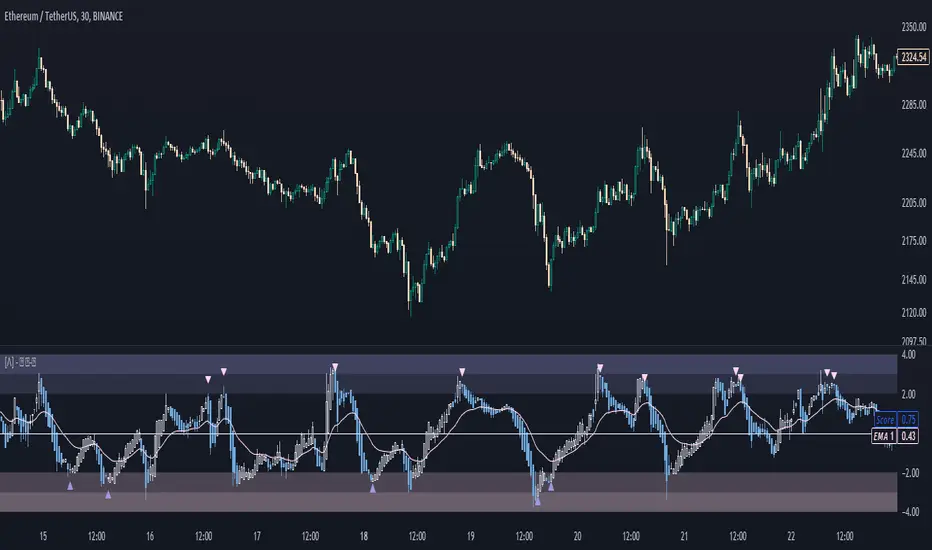
Simple Neural Network Transformed RSI [QuantraSystems]Simple Neural Network Transformed RSI
Introduction
The Simple Neural Network Transformed RSI (ɴɴᴛ ʀsɪ) stands out as a formidable tool for traders who specialize in lower timeframe trading.
It is an innovative enhancement of the traditional RSI readings with simple neural network smoothing techniques.
This unique blend results in fairly accurate signals, tailored for swift market movements. The ɴɴᴛ ʀsɪ is particularly resistant to the usual market noise found in lower timeframes, ensuring a clearer view of short-term trends.
Furthermore, its diverse range of visualization options adds versatility, making it a valuable tool for traders seeking to capitalize on short-duration market dynamics.
Legend
In the Image you can see the BTCUSD 1D Chart with the ɴɴᴛ ʀsɪ in Trend Following Mode to display the current trend. This is visualized with the barcoloring.
Its Overbought and Oversold zones start at 50% and end at 100% of the selected Standard Deviation (default σ = 2), which can indicate extremely rare situations which can lead to either a softening momentum in the trend or even a mean reversion situation.
Here you can also see the original Indicator line and the Heikin Ashi transformed Indicator bars - more on that now.
Notes
Quantra Standard Value Contents:
To draw out all the information from the indicator calculation we have added a Heikin-Ashi (HA) Candle Visualization.
This HA transformation smoothens out the indicator values and gives a more informative look into Momentum and Trend of the Indicator itself.
This allows early entries and exits by observing the HA transformed Indicator values.
To diversify, different visualization options are available, either a classic line, HA transformed or Hybrid, which contains both of the previous.
To make Quantra's Indicators as useful and versatile as possible we have created options
to change the barcoloring and thus the derived signal from the indicator based on different modes.
Option to choose different Modes:
Trend Following (Indicator above mid line counts as uptrend, below is downtrend)
Extremities (Everything going beyond the Deviation Bands in a Mean Reversion manner is highlighted)
Candles (Color of HA candles as barcolor)
Reversion (HA ONLY) (Reversion Signals via the triangles if HA candles change state outside of the Deviation Bands)
- Reversion Signals are indicated by the triangles in the Heikin-Ashi or Hybrid visualization when the HA Candles revert
from downwards to upwards or the other way around OUTSIDE of the SD Bands.
Depending on the Indicator they signal OB/OS areas and can either work as high probability entries and exits for Mean Reversion trades or
indicate Momentum slow downs and potential ranges.
Please use another indicator to confirm this.
Case Study
To effectively utilize the NNT-RSI, traders should know their style and familiarize themselves with the available options.
As stated above, you have multiple modes available that you can combine as you need and see fit.
In the given example mostly only the mode was used in an isolated fashion.
Trend Following:
Purely relied on State Change - Midline crossover
Could be combined with Momentum or Reversion analysis for better entries/exits.
Extremities:
Ideal entry/exit is in the accordingly colored OS/OB Area, the Reversion signaled the latest possible entry/exit.
HA Candles:
Specifically applicable for strong trends. Powerful and fast tool.
Can whip if used as sole condition.
Reversions:
Shows the single entry and exit bars which have a positive expected value outcome.
Can also be used as confirmation or as last signal.
Please note that we always advise to find more confluence by additional indicators.
Traders are encouraged to test and determine the most suitable settings for their specific trading strategies and timeframes.
In the showcased trades the default settings were used.
Methodology
The Simple Neural Network Transformed RSI uses a simple neural network logic to process RSI values, smoothing them for more accurate trend analysis.
This is achieved through a linear combination of RSI values over a specified input length, weighted evenly to produce a neural network output.
// Simple neural network logic (linear combination with weighted aggregation)
var float inputs = array.new_float(nnLength, na)
for i = 0 to nnLength - 1
array.set(inputs, i, rsi1 )
nnOutput = 0.0
for i = 0 to nnLength - 1
nnOutput := nnOutput + array.get(inputs, i) * (1 / nnLength)
nnOutput
This output is then compared against a standard or dynamic mean line to generate trend following signals.
Mean = ta.sma(nnOutput, sdLook)
cross = useMean? 50 : Mean
The indicator also incorporates Heikin Ashi candlestick calculations to provide additional insights into market dynamics, such as trend strength and potential reversals.
// Calculate Heikin Ashi representation
ha = ha(
na(nnOutput ) ? nnOutput : nnOutput ,
math.max(nnOutput, nnOutput ),
math.min(nnOutput, nnOutput ),
nnOutput)
Standard deviation bands are used to create dynamic overbought and oversold zones, further enhancing the tool's analytical capabilities.
// Calculate Dynamic OB/OS Zones
stdv_bands(_src, _length, _mult) =>
float basis = ta.sma(_src, _length)
float dev = _mult * ta.stdev(_src, _length)
= stdv_bands(nnOutput, sdLook,sdMult/2)
= stdv_bands(nnOutput, sdLook, sdMult)
The Standard Deviation bands take defined parameters from the user, in this case sigma of ideally between 2 to 3,
to help the indicator detect extremely improbable conditions and thus take an inversely probable signal from it to forward to the user.
The parameter settings and also the visualizations allow for ample customizations by the trader.
For questions or recommendations, please feel free to seek contact in the comments.

Doji Candle _ ThaerAbusalahIdentify doji candles in heikin ashi .
the indicator will search for a doji candles that are same in upper and lower wick by 50% and more .

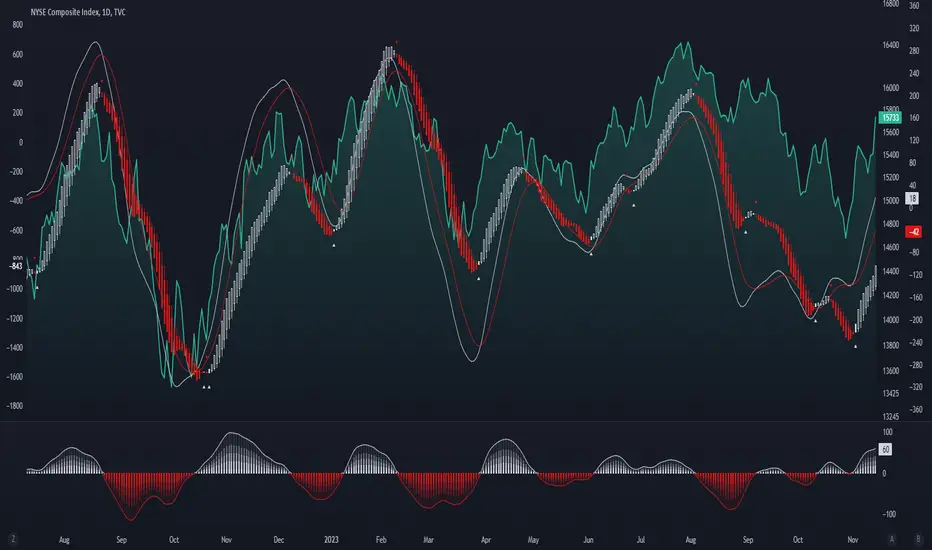
Enhanced McClellan Summation Index
The Enhanced McClellan Summation Index (MSI) is a comprehensive tool that transforms the MSI indicator with Heikin-Ashi visualization, offering improved trend analysis and momentum insights. This indicator includes MACD and it's histogram calculations to refine trend signals, minimize false positives and offer additional momentum analysis.
Methodology:
McClellan Summation Index (MSI) -
The MSI begins by calculating the ratio between advancing and declining issues in the specified index.
float decl = 𝘐𝘯𝘥𝘪𝘤𝘦 𝘥𝘦𝘤𝘭𝘪𝘯𝘪𝘯𝘨 𝘪𝘴𝘴𝘶𝘦𝘴
float adv = 𝘐𝘯𝘥𝘪𝘤𝘦 𝘢𝘥𝘷𝘢𝘯𝘤𝘪𝘯𝘨 𝘪𝘴𝘴𝘶𝘦𝘴
float ratio = (adv - decl) / (adv + decl)
It then computes a cumulative sum of the MACD (the difference between a 19-period EMA and a 39-period EMA) of this ratio. The result is a smoothed indicator reflecting market breadth and momentum.
macd(float r) =>
ta.ema(r, 19) - ta.ema(r, 39)
float msi = ta.cum(macd(ratio))
Heikin-Ashi Transformation -
Heikin-Ashi is a technique that uses a modified candlestick formula to create a smoother representation of price action. It averages the open, close, high, and low prices of the current and previous periods. This transformation reduces noise and provides a clearer view of trends.
type bar
float o = open
float h = high
float l = low
float c = close
bar b = bar.new()
float ha_close = math.avg(b.o, b.h, b.l, b.c)
MACD and Histogram -
The Enhanced MSI incorporates MACD and histogram calculations to provide additional momentum analysis and refine trend signals. The MACD represents the difference between the 12-period EMA and the 26-period EMA of the MSI. The histogram is the visual representation of the difference between the MACD and its signal line.
Options:
Index Selection - Choose from TVC:NYA , NASDAQ:NDX , or TVC:XAX to tailor the MSI-HA to the desired market index.
MACD Settings - Adjust the parameters for the MACD calculation to fine-tune the indicator's responsiveness.
Ratio Multiplier - Apply scaling to the MSI to suit different market conditions and indices.
Benefits of Heikin-Ashi -
Smoothed Trends - Heikin-Ashi reduces market noise, providing a more apparent and smoothed representation of trends.
Clearer Patterns - Candlestick patterns are more distinct, aiding in the identification of trend reversals and continuations.
Utility and Use Cases:
Trend & Momentum Analysis - Utilize the tool's Heikin-Ashi visualization for clearer trend identification in confluence with it's MACD and histogram to gain additional insights into the strength and direction of trends, while filtering out potential false positives.
Breadth Analysis - Explore market breadth through the MSI's cumulative breadth indicator, gauging the overall health and strength of the underlying market.
- Alerts Setup Guide -
The Enhanced MSI is a robust indicator that combines the breadth analysis of the McClellan Summation Index with the clarity of Heikin-Ashi visualization and additional momentum insights from MACD and histogram calculations. Its customization options make it adaptable to various indices and market conditions, offering traders a comprehensive tool for trend and momentum analysis.
External Indicator Analysis Overlay | Buy/Sell | HTF Heikin-AshiThis chart overlay offers multiple candlestick display options. The Regular (Japanese) and the Heikin-Ashi candles are well known. The Mari-Ashi (or Renko) option is something special as it should be timeframe independent, so that sideways action should be represented in one candle. That is difficult to realize as an overlay on the normal candlestick structure, but perhaps the chosen implementation is useful nonetheless. The Velocity option is experimental and is designed to show if the price has accelerated too much in a trend direction. In this case, the highs and lows do not reflect the actual highs and lows, but indicate the overshooting velocity. The opening of the candle also depends on the inherent velocity, but the close of the candle is always the actual close. Anyway, it doesn't look very useful, but the option is there.
All options can be applied to higher timeframes. A usable setting is obtained by disabling only the body of the TradingView candles in regular mode and enabling this overlay.
A large part of this overlay consists of buy/sell indication settings. For activation it is necessary to select an external source. For example the “Relative Bi-Directional Volatility Range”, specifically the Trend Shift Signal (TSS). This signal switches from 0 to 1, if the trend becomes bullish or from 0 to -1, if the trend becomes bearish. It will be automatically detected without specifying the Indication Type. Alternatively, the Volatility Moving Average (VMA) would meet the requirements for the Indication Type “Buy = positive | Sell = negative”. The Moving Average Convergence Divergence (MACD) also fulfills these conditions. Another example is to use any Moving Average with the Indication Type “Buy = rising | Sell = falling”. In the chart above the Hull Moving Average (HMA) is used. In addition, it is possible to reverse the signal, so that positive signals become negative and vice versa. The signals will be labeled as Buy or Sell on the chart.
The user can analyze whether the provided signals are good or bad indications for going long or short or simply for rebalancing a portfolio. Therefore, it is possible to set a starting point for the analysis and choose a weighting for the investments from 0% to 100% of the portfolio. To avoid sleepless nights, a very reliable (and conservative) setting seems to be Rebalancing with 50% (very similar to the well-known 60/40 portfolio). The calculation results are shown in a table.
As a small addition there is the possibility to label the peaks by setting the distance between the highs/lows. This will make the quality of the buy and sell signals even more clear.

Ultimate Heiken-AshiWhy ultimate?
It's very configurable (you can select to see the candles or a line, pick the colors, switch between Heiken-Ashi and normal candles, etc.).
In addition to standard Heiken-Ashi candles, it offers the option of a new, modified calculation of the candles different than the standard Heiken-Ashi calculation.
It can work based off the existing candles of the chart or it can force working based off normal candles regardless of any non-standard candles loaded in the current chart.
It can add the Heiken-Ashi calculation (or the modified one) twice, thus intensifying the effect.
FYI, you can disable the regular bars (so that they don't overlap with this indicator) by click on the eye icon next to the ticker on the very top left of the chart.
Manage risk and enjoy!
On Balance Volume Heikin-Ashi Transformed
The OBV Heikin Ashi indicator is a modified version of the On-Balance Volume indicator that incorporates the Heikin Ashi transformation. This technical tool aims to provide traders with a smoother representation of volume dynamics and price trends.
The OBV Heikin Ashi indicator combines the principles of OBV and Heikin Ashi to offer insights into the volume and price behavior of an asset. Understanding OBV and Heikin Ashi individually will provide a foundation for comprehending the uniqueness and utility of this indicator.
On-Balance Volume:
OBV is a volume-based indicator that measures the cumulative buying and selling pressure in the market. It considers the relationship between volume and price movements to determine the overall strength and direction of a trend. Rising OBV values suggest bullish buying pressure, while falling values indicate bearish selling pressure.
Heikin Ashi:
Heikin Ashi is a Japanese candlestick charting technique that aims to filter out noise and provide a smoother representation of price trends. It calculates each candlestick based on the average of the previous candle's open, close, high, and low prices. Heikin Ashi candles can reveal the underlying trend more clearly by reducing market noise.
Methodology:
The 𝘖𝘉𝘝 𝘏-𝘈 indicator applies the Heikin Ashi transformation to the OBV values. Each OBV value is replaced with a Heikin Ashi equivalent, which is calculated based on the average of the previous Heikin Ashi candle's open and close prices. This transformation smooths out the OBV values and helps identify the overall trend with reduced noise. Additionaly, 2 optional EMAs are included for convergence-divergence analysis.
By applying the Heikin Ashi transformation to OBV, the indicator aims to enhance the readability of volume and trend information, providing traders with a clearer understanding of market dynamics.
Utility:
The 𝘖𝘉𝘝 𝘏-𝘈 indicator can be a valuable tool for traders and investors in analyzing volume and price trends. It offers a smoother representation of OBV values, allowing for easier identification of trend reversals, bullish or bearish market conditions, and potential trading opportunities. Traders can utilize the indicator to confirm price trends, validate support and resistance levels, and enhance their overall trading strategies.
It is worth noting that the effectiveness of the indicator may vary depending on the specific market and trading strategy. It is recommended to combine its analysis with other technical indicators and perform thorough backtesting before making trading decisions.
Key Features:
2 Adjustable EMAs
Normalized Oscillator Mode
Example Charts:
See Also:
Z-Score Heikin-Ashi Transformed

Z-Score Heikin-Ashi TransformedThe Z-Score Heikin-Ashi Transformed (𝘡 𝘏-𝘈) indicator is a powerful technical tool that combines the principles of Z-Score and Heikin Ashi to provide traders with a smoothed representation of price movements and a standardized measure of market volatility.
The 𝘡 𝘏-𝘈 indicator applies the Z-Score calculation to price data and then transforms the resulting Z-Scores using the Heikin Ashi technique. Understanding the individual components of Z-Score and Heikin Ashi will provide a foundation for comprehending the methodology and unique features of this indicator.
Z-Score:
Z-Score is a statistical measure that quantifies the distance between a data point and the mean, relative to the standard deviation. It provides a standardized value that allows traders to compare different data points on a common scale. In the context of the 𝘡 𝘏-𝘈 indicator, Z-Score is calculated based on price data, enabling the identification of extreme price movements and the assessment of their significance.
Heikin Ashi:
Heikin Ashi is a popular charting technique that aims to filter out market noise and provide a smoother representation of price trends. It involves calculating each candlestick based on the average of the previous candle's open, close, high, and low prices. This approach results in a chart that reduces the impact of short-term price fluctuations and reveals the underlying trend more clearly.
Methodology:
The 𝘡 𝘏-𝘈 indicator starts by calculating the Z-Score of the price data, which provides a standardized measure of how far each price point deviates from the mean. Next, the resulting Z-Scores are transformed using the Heikin Ashi technique. Each Z-Score value is modified according to the Heikin Ashi formula, which incorporates the average of the previous Heikin Ashi candle's open and close prices. This transformation smooths out the Z-Score values and reduces the impact of short-term price fluctuations, providing a clearer view of market trends.
This tool enables traders to identify significant price movements and assess their relative strength compared to historical data. Positive transformed Z-Scores indicate that prices are above the average, suggesting potential overbought conditions, while negative transformed Z-Scores indicate prices below the average, suggesting potential oversold conditions. Traders can utilize this information to identify potential reversals, confirm trend strength, and generate trading signals.
Utility:
The indicator offers valuable insights into price volatility and trend analysis. By combining the standardized measure of Z-Score with the smoothing effect of Heikin Ashi, traders can make more informed trading decisions and improve their understanding of market dynamics. 𝘡 𝘏-𝘈 can be used in various trading strategies, including identifying overbought or oversold conditions, confirming trend reversals, and establishing entry and exit points.
Note that the 𝘡 𝘏-𝘈 should be used in conjunction with other technical indicators and analysis tools to validate signals and avoid false positives. Additionally, traders are encouraged to conduct thorough backtesting and experimentation with different parameter settings to optimize the effectiveness of the indicator for their specific trading approach.
Key Features:
Optional Reversion Doritos
Adjustable Reversion Threshold
2 Adjustable EMAs
Example Charts:
See Also:
On Balance Volume Heikin-Ashi Transformed
RSI Primed [ChartPrime]
RSI Primed combines candlesticks, patterns, and the classic RSI indicator for advanced market trend indications
Introduction
Technical traders are always looking for innovative methods to pinpoint potential entry and exit points in the market. The RSI Prime indicator provides such traders with an enhanced view of market conditions by combining various charting styles and the Relative Strength Index (RSI). It offers users a unique perspective on the market trends and price momentum, enabling them to make better-informed decisions and stay ahead of the market curve.
The RSI Primed is a versatile indicator that combines different charting styles with the Relative Strength Index (RSI) to help traders analyze market trends and price momentum. It offers multiple visualization modes that serve specific purposes and provide unique insights into market performance:
Regular Candlesticks
Candlesticks with Patterns
Heikin Ashi Candles
Line Style
Regular Candlestick Mode
The Regular Candlestick Mode in RSI Primed depicts traditional Japanese candlesticks that most traders are familiar with. This mode bypasses any smoothing or modified calculations, representing real-price movements. Regular candlesticks offer a clear and straightforward way to visualize market trends and price action.
Candlestick with Patterns Mode
The Candlestick with Patterns Mode focuses on identifying high-probability candlestick patterns while incorporating RSI values. By leveraging the information captured by the RSI, this mode allows traders to spot significant market reversals or continuation patterns that could signal potential trading opportunities. Some recognizable patterns include engulfing bullish, engulfing bearish, morning star bullish, and evening star bearish patterns.
Heikin Ashi Candles Mode
The Heikin Ashi Candles Mode presents an advanced candlestick charting technique known for its excellent trend-following capabilities. Heikin Ashi Candles filter out noise in the market and provide a clear representation of market trends. In this mode, candlesticks are plotted based on RSI values of the open, high, low, and close prices, helping traders understand and utilize market trends effectively.
Line Style Mode
The Line Style Mode offers a simpler and minimalistic representation of the RSI values by using a line instead of candlesticks to visualize market trends. This mode helps traders focus on the overall trend direction and eliminates potential distractions caused by the complexity of candlestick patterns.
Candle Color Overlay Mode
The Candle Color Overlay Mode is a unique feature in the RSI Primed indicator that allows traders to visualize the RSI values on the chart's candles as a heat gradient. This mode adds a color overlay to the candlesticks, representing the RSI values in relation to the candlesticks' price action.
By displaying the RSI as a color gradient, traders can quickly assess market momentum and identify overbought or oversold conditions without having to switch between different modes or charts. The gradient ranges from cool colors (blue and green) for lower RSI values, indicating oversold conditions, to warm colors (orange and red) for higher RSI values, signifying overbought situations.
To enable the Candle Color Overlay Mode, traders can toggle the "Color Candles" option in the indicator settings. Once enabled, the color gradient will be applied to the candlesticks on the chart, providing a visually striking and informative representation of the RSI values in relation to price action. This mode can be used in tandem with any of the other charting styles, allowing traders to gain even more insights into market trends and momentum.
RSI Primed Implementation
The RSI Primed indicator combines the benefits of various charting styles with the RSI to help traders gain a comprehensive view of market trends and price momentum. It incorporates the Heikin Ashi and RSI values as inputs to generate several visualization modes, enabling traders to select the one that best suits their needs.
Chebyshev Digital Audio Filter in RSI Primed Indicator
A unique feature of the RSI Primed Indicator is the incorporation of the Chebyshev Digital Audio Filter, a powerful tool that significantly influences the indicator's accuracy and responsiveness. This signal processing method brings several benefits to the context of the RSI indicator, improving its performance and capabilities.
1. Improved Signal Filtering
The Chebyshev filter excels in its ability to remove high-frequency noise and unwanted signals from the RSI data. While other filtering techniques might introduce unwanted side effects or distort the RSI data, the Chebyshev filter accurately retains the main signal components, enhancing the RSI Primed's overall accuracy and reliability.
2. Faster Response Time
The Chebyshev filter offers a faster response time than most other filtering techniques. In the context of the RSI Primed Indicator, this means that the filtering process is quicker and more efficient, allowing traders to act swiftly during rapidly changing market conditions.
3. Enhanced Trend Detection
By effectively removing noise from the RSI data, the Chebyshev filter contributes to the enhanced detection of underlying market trends. This feature helps traders identify potential entry and exit points more accurately, improving their overall trading strategy and performance.
How to Use RSI Primed
Traders can choose from different visualization modes to suit their preferences while using the RSI Primed indicator. By closely monitoring the chosen visualization mode and the position of the moving average, traders can make informed decisions about market trends.
Green candlesticks or an upward line slope indicate a bullish trend, and red candlesticks or a downward line slope suggest a bearish trend. If the candles or line are above the moving average, it could signify an uptrend, whereas a position below the moving average may indicate a downtrend.
The RSI Primed indicator offers a unique and comprehensive perspective on market trends and price momentum by combining various charting styles with the RSI. Traders can choose from different visualization modes and make well-informed decisions to capitalize on market opportunities. This innovative indicator provides a clear and concise view of the market, enabling traders to make swift decisions and enhance their trading results.

SumIndTarget:
The SumInd indicator combines Heiking Ashi, Sar Parabolic, Koncord, RSI, DMI, MACD and Bollinger Bands to give buy or sell signals or trends. This are called base indicators.
The goal is to have a clear and quick buy or sell suggestion and to avoid evaluating all or some of the named indicators, especially if they give contradictory signals among them. This speed and simplicity helps the trader to see several tickers in less time. It is intended for all markets and time periods where the above-mentioned indicators can be used.
How it works:
SumInd already has the importance or "weight" of each indicator named above configured, but they can be modified. You can set 0% for no use, or any other value based on the weight you want to give it, between 1% and 200% where 100% is the normal use, and increases or decreases based on importance.
Each base indicator can give signals to buy, sell or just "wait and see".
Each base indicator is checked for a buy signal, in which case its weight is added to the positive or green line, and if there is a sell signal, its weight is subtracted from the sell or red line. in case of indeterminacy or 'wait and see', nothing is added to any signal.
The yellow or total line is the sum of the buy or green signal plus the sell or red signal.
If the yellow or total line rises above the buy level, the background changes to green and an up arrow appears at the bottom of the chart indicating the buy suggestion, because most of the indicators you are interested in gave a buy signal.
If the yellow line or total falls below the sell level, the background changes to red and a downward arrow appears in the upper area of the chart indicating the sell suggestion, because most of the indicators you are interested in gave a sell signal.
The Buy and Sell level can be changed according to the security of the suggestion you need.
Areas without arrows or marks are considered "wait and see" areas, the previous trend in principle continues. They can be marked with the default background if desired from the SumInd settings.
Details and criterials:
Each of the following indicators can be turned on or off and assigned different weights of importances, by whether or not it shares the following criteria:
Heikin Ashi candles: add or subtract half an assigned weight if there is a buy or sell candle and the other half weight if there are two consecutive candles with the same signal.
RSI: Adds or subtracts the assigned weight if the ema is below or above the signal.
Parabolic Sar: Adds half a weight in transition to buy or sell and another half weight if there are two consecutive signals of the same trend.
Koncord: Add or subtract the weight if the current trend (mountain) grows or decreases respectively from the 4th previous time signal, and also the value (red line) is less than 35 or exceeds 65 respectively.
DMI: Adds or subtracts a quarter of the weight assigned by the DMI signal multiplied by the value of DMI, if the positive or negative signal exceeds the other negative or positive signal by 15% respectively.
Bollinger Bands: Add or subtract the weight if the previous third signal touches or falls out of the zone and keeps growing or decreasing respectively.
MACd: Add or subtract one third of the weight if the last 3 time signals are rising or falling, Add or subtract another third if the fast signal is above or below the slow signal, and Add or subtract the last third of the weight if it is rising with the negative fast signal, or falling with the positive fast signal.
