HA StudyShows trends based on 1W and 3D heikin ahsi candles and moving averages crossing next possible close prediction on 1W and 3D heiking ashi candles
Ashi

Heikin Ashi Candles - Actual CloseHeikin Ashi Candles - Actual Close is a simple script that instead of displaying Heikin Ashi Close it displays the actual close.
This script is a handy tool for anyone that wants to use Heikin Ashi candles that displays the real close. The coloring of the candles is still based on the Heikin Ashi calculations.
Enjoy.

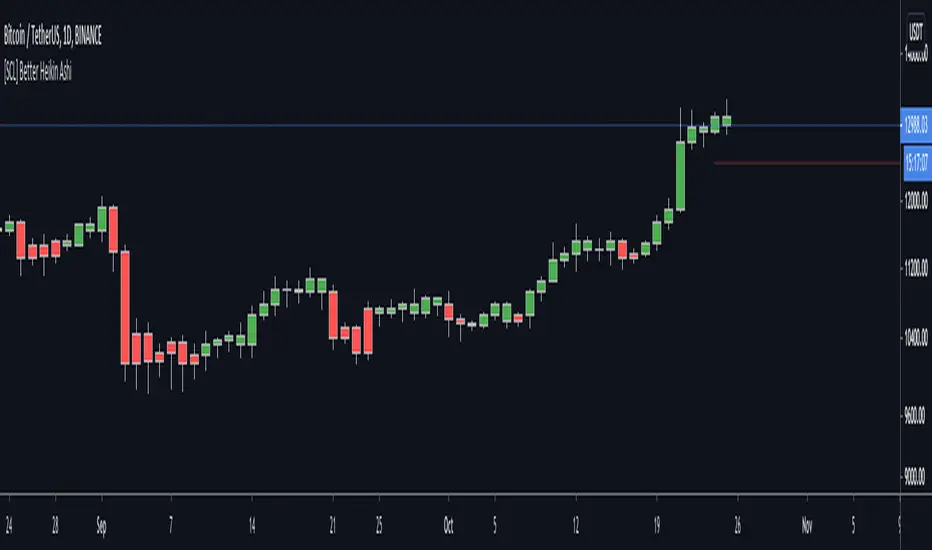
[SCL] Better Heikin AshiTo display the Heikin Ashi candle direction on your normal chart, using this script is better than switching between layouts. It includes different display modes so that you can use it alongside other indicators without clashing visually (bar colour/plotted shapes/shapes on flip only), and alerts on changes in direction. Many scripts include some or other of these features; here I've included them all in one for flexibility. One feature that AFAIK is unique is the "predictive close", which shows you where the current candle needs to close in order to change the Heikin Ashi direction.
Heikin Ashi is a different method of calculating candlesticks. It has several advantages:
+ It can help to show the dominant trend in a smoother way than normal candles.
+ Flips in direction can show either trend reversal, or a pause and continuation, which can be a place to join a trend.
Disadvantages of using Heikin Ashi include:
+ Having to change to a different chart layout
+ Difficulties working directly with Heikin Ashi values, because the values of the Open, Low, High, and Close displayed are different to the "real" prices.
This indicator solves this problem by bringing trend information from Heikin Ashi candles (whether they're bullish or bearish) onto your normal candle chart. It displays in the main chart pane.
Support and Resistance-Heiken Ashi-Swing Index System-alertsThis is a breakout system that has pivot swing lines and a trailing stop built in. Many people try to use different ways to find out what a swing point is such as, zig zags, lookbacks, fractals, hand-drawn chart lines, or other subjective indicators. This looks at the heiken ashi price to objectively find the swing pivots. Many would agree that the color changes in the heiken ashi bars are signs of price reversals. This indicator tells where the significant swing points will be based on this concept. A lookback for a specific number of bars is then done to make sure the lowest low or the highest high is the actual swing point by looking at all possible combinations where it could be after finding the color change in the heiken ashi bar. After the swing points are found, the pivot lines can act as support and resistance levels, as trailing stops, as a confirmation of a breakout, or any other use that S/R lines might have. The colored zone filling is included along with the pivot top and bottom lines to show that the price has broken above/below the pivot lines and has remained above/below them. This trailing stop can be used as a final indication of an exit for trend following, breakout system, or any other system that it might benefit from by sometimes reacting before other trailing stop to give off a more reliable exit signal. It works similarly to other trailing stops such as ATR based ones and Supertrend, but instead of being used for an exit or stop, it is meant more for an entry or confirmation signal. A breakout of a price pattern or S/R levels can be confirmed when the colored red/green zone changes color. Other trailing stops or exit strategies can be combined to give off a better exit.
I made this indicator so that instead of using a trailing stop line to show the direction of the breakout or trend, a colored zone is used so that it doesn't get in the way of the upper and lower lines. It can be turned off in the settings if only the support and resistance lines are needed. Other than that, this indicator doesn't need any inputs whatsoever to find out where the swing pivots points might and are found objectively using heiken ashi. I also included several alerts to signal whenever the trend direction color zone changes, when the price breaks support or resistance, or when it breaks the previous support and resistance levels.

Heikin Ashi Trend IndicatorMy own implantation of Heikin Ashi which i call HAT.
The Heikin Ashi Trend Indicator (HAT) used to determine the price direction of an asset, as well as draw attention to when the price direction is changing.
The HAT indicator translates the current close/open/high/low into Heikin Ashi and smooths them a bit using Tilson T3 formula.
Buy signal when Heikin Ashi Close is bigger than Heikin Ashi Open with Tilson T3 smoothing.
Sell signal when Heikin Ashi Open is bigger than Heikin Ashi Close with Tilson T3 smoothing.
Set the 'percentSqueeze' percentage to display possible reversal with light Red/Green crosses.
Green - Up Trend
Light Green - Possible reversal is near
Red - Down Trend
Light Red - Possible reversal is near
Follow for more indicators: www.tradingview.com

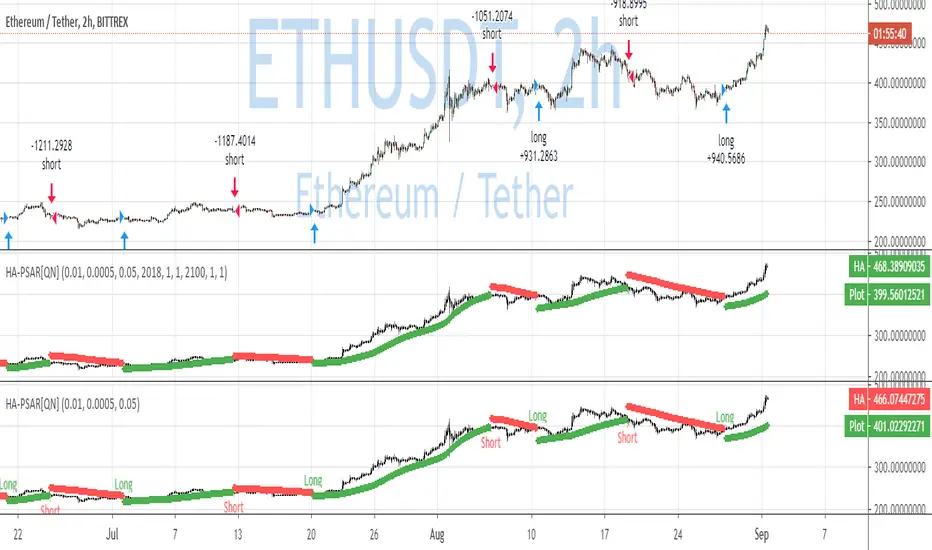
QuantNomad - Heikin-Ashi PSAR AlertsUsing this script you can create alerts for my Heikin-Ashi PSAR Strategy:
When creating alerts use "Once Per Bar Close" in parameters.
####################
Disclaimer
Please remember that past performance may not be indicative of future results.
Due to various factors, including changing market conditions, the strategy may no longer perform as good as in historical backtesting.
This post and the script don’t provide any financial advice.
Heiken-Ashi Color Vts// Simple as it says:
// gives you the color of the Heiken Ashi candles in a separate panel.
// I needed this indicator since in TV switching from HA to normal candles resets the chart and I had to go back manually.
// This solves the nasty issue.
// Moreover, nobody enters/exits the trade on the HA values but everyone uses just their color, right?
// Since bearish candles are encoded with value -1 and bullish candles with +1,
// a simple average can be defined (if you don't find it useful, disable it).
// Vitelot-Yanez-Vts, Aug 2020
//
QuantNomad - Heikin-Ashi PSAR StrategyContinue experimenting with different combinations of strategies.
Here is the PSAR Strategy calculated based on HA candles. HA is already calculated inside the script, do not apply it to HA candles.
Strategy is calculated based on 25% equity invested with 0.1% commission.
####################
Disclaimer
Please remember that past performance may not be indicative of future results.
Due to various factors, including changing market conditions, the strategy may no longer perform as good as in historical backtesting.
This post and the script don’t provide any financial advice.

Trend trader StrategyFirst I would like to thank to @JustUncleL since this strategy started from one of his scalper strategies
This strategy can be adapted to all time charts .
First it has the session where we want to trade, for this example I choosed the EURUSD so I only take in consideration london/neywork session.
Its made from 3 EMA :
normal
slow
ultra slow
It has has the capacity to use HA candles into consideration if its needed.
At the same time we have a price channel made from faster MAs, that act like a bollinger band .
Together with all of them, we establish which trend we have if its uptrend or downtrend
Then we check the candles if they are below or above the MA , and based on the condition if they crossed recently we can suggest if its a buy or a long condition
At the same time we have 2 options of stop conditions:
Through a trailing stop made from ATR or % based
And second, a SL/TP made from pip points or % based.
For this example I used % based.
Let me know what you think about it, and if you found some nice settings for it. So far I only adapted to EURUSD 1 min time.

|AG| Heiken Ashi Scanner|AG| Heiken Ashi Scanner
Heiken Ashi shares some characteristics with standard candlestick charts but differs
based on the values used to create each candle.
Instead of using the open, high, low, and close like standard candlestick charts,
the Heikin-Ashi technique uses a modified formula based on two-period averages.
This gives the chart a smoother appearance, making it easier to spots trends and reversals,
but also obscures gaps and some price data.
Heikin Ashi in my perspective is one of the best trend detectors in long term scenarios.
The use of Heiken Ashi Smoothed could be determined by the use of a moving average.
The use of Smoothed with Simple, Exponential, and Hull Moving Average are included in this script.
Script Explanation:
This Script is going to plot us different Heikin Ashi when they are up ( Bullish ) is going to be colored.
7 different Time-Frames are going to be taken into account.
Also is possible to modify the Length Setting and the MA calculation.
Setting Options:
↪Scanner TIME:
↪This Script (Scanner) is going to show us different Heiken Ashi Time-Frames
↪7 in total.
↪Higher Time-Frames
60 - 120 - 240 - 480 - 1D - 3D -1W
↪Lower Time-Frames
1 - 5- 15 -30 -60 - 120 -240
↪Smoothed?:
↪Select Turn On/Turn Off
↪Is going to select or deselect Smoothed Heiken A. or change in base our configuration.
↪Select Type:
↪This option let us select between:
↪ Exponential and Hull Moving Average.
↪Length Options
↪Length 1
↪Length 2
↪ In EMA and SMA I prefer 1:3 and 1:5
↪And In Hull MA. I prefer 10:1
↪Design Settings
↪Color Options
↪ U can select different color options.
↪ My Favorites are Orange, Aqua, and Purple.
↪Transparency
↪Set Transparency 0 is 100% visible and 100 is invisible.
↪LineWidth (defval= 5)
↪Set the thickness
↪Show Information Panel
↪ We are going to have a little informative panel in the right so we could
have a quick look at the trend.
↪Panel Position Offset (defval= 33)
Examples Of Color Options:
Examples Of Configurations:
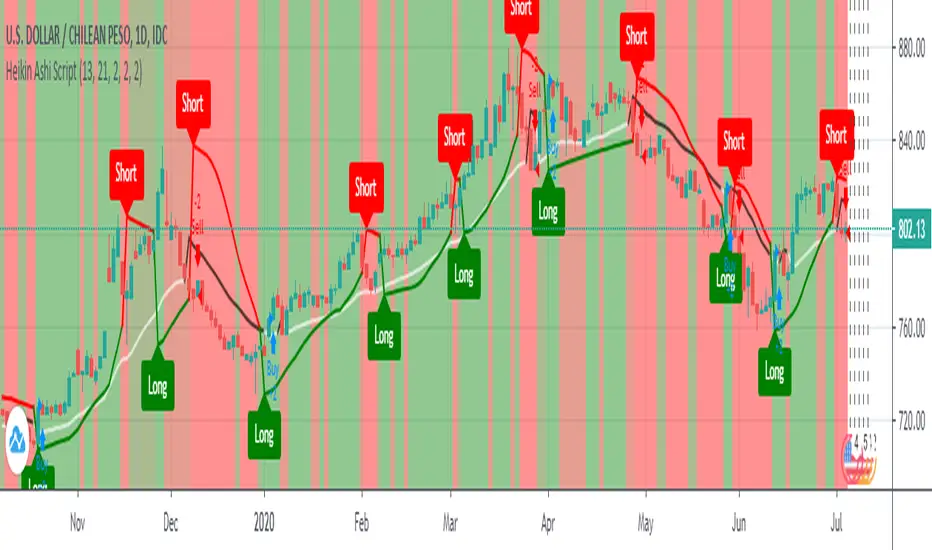
Heikin Ashi ScriptThis is a backtested Heikin-Ashi candles color change strategy.
You have to use this strategy on normal candles and not Heikin-Ashi!!!
Why normal candles? :- Because if you'll apply this strategy on Heikin Ashi candles then your backtesting won't be valid.
Here's how to use it.
Go LONG in case of ALL of the condition matches:-
1) When Buy arrow appeared under the last daily candle.
2) Candle background color should be green.
3) When the MA line changes the color from red to green.
Go SHORT in case of ALL of the condition matches:-
1) When Sell arrow appeared above the last daily candle.
2) Candle background color should be red.
3) When the MA line changes the color from green to red.
This strategy work in all the asset and all the timeframe.
Happy Trading!!!
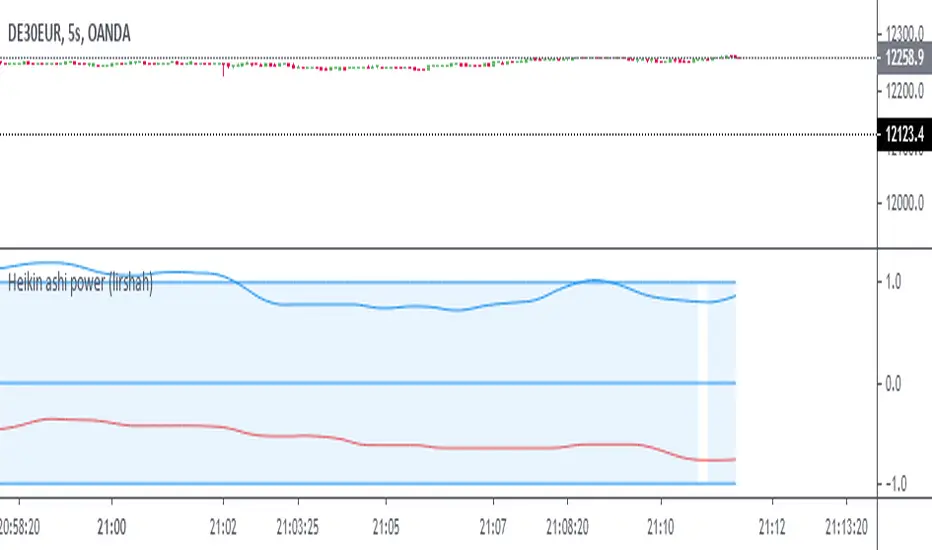
Heikin ashi power (lirshah)Heikin Ashi power strategy has been written based on the heikin ashi candles movement.
the strategy is composed from two different line, bullish candle line and bearish candle line.
the bullish line is a representative of bull power which is directly related to number of positive candles and also power of candles.
so the more positive candles and the more upward trends causes the powerful bullish line and conducted to an extreme level.
the strategy trigger buy signals when bullish line passes the extreme and similar scenario for selling signals.
this strategy has very good results on 5 Sec , 5 min and 15 min time frames.
also it can be applied to variety of markets, crypto, indices , cfd and futures.
the standard parameters are as below:
period:200
internal smooth: 5
external smooth: 10
extreme level: 1
take profit
stop-loss
below overview is results of XBTUSD on 5 min chart, with 1 contract trade and 0.075% commission per trade.
in order to access scripts contact me directly.
Heikin-Ashi Source Function HTFHigher TimeFrame using custom source function for toggling traditional Candle sources or Heikin-Ashi sources on a traditional Candles chart.
Thanks to PineCoders for rounding method: www.pinecoders.com
Thanks to @LucF and @RicardoSantos for their advice and enlightenment as always.
NOTICE: This is an example script and not meant to be used as an actual strategy. By using this script or any portion thereof, you acknowledge that you have read and understood that this is for research purposes only and I am not responsible for any financial losses you may incur by using this script!
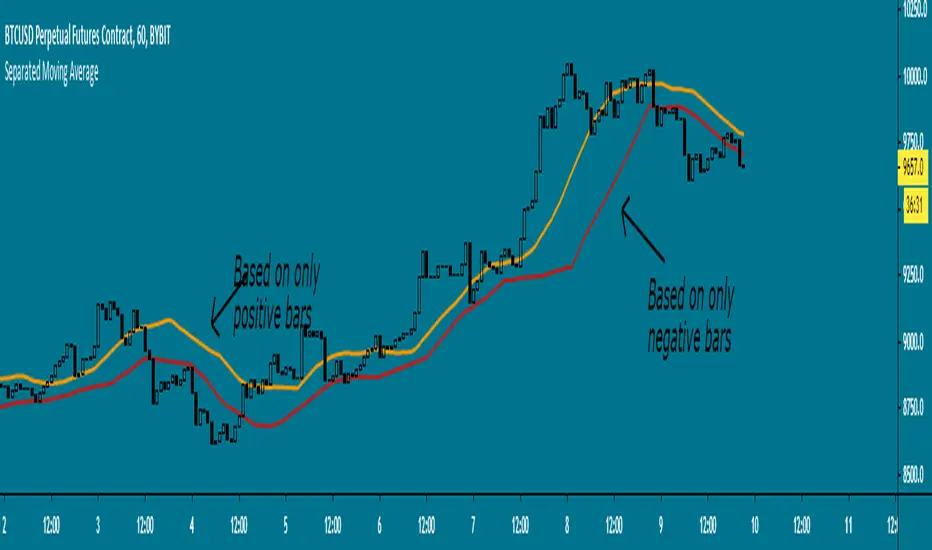
Separated Moving Average - evoHere are two moving averages, one based on positive candles and the other based on negative candles. If the current bar is positive, the negative MA will use its last known negative bar for the calculation. The default setting uses Heikin Ashi to smooth the candles with the trend, you can turn this off if you want in inputs.
Let me know if you find it useful :)
Off-chart 21 MA, Bollinger Bands and Heikin Ashi CandlesThis off-chart indicator provides three basic and useful tools for trend trading in Bitcoin and probably other markets. Heikin Ashi candles being utilized with classic candle patterns at the same time could be considered as a conservative and safe confirmation approach for entring your position.

21 MA, Bollinger Bands and Heikin AshiThis on-chart indicator provides three basic and useful tools for trend trading in Bitcoin and probably other markets. Moving and Bollinger lines act as strong support and resistance in 4H resolution. Heikin Ashi candles being utilized with classic candle patterns at the same time could be considered as a conservative and safe confirmation approach for entring your position.

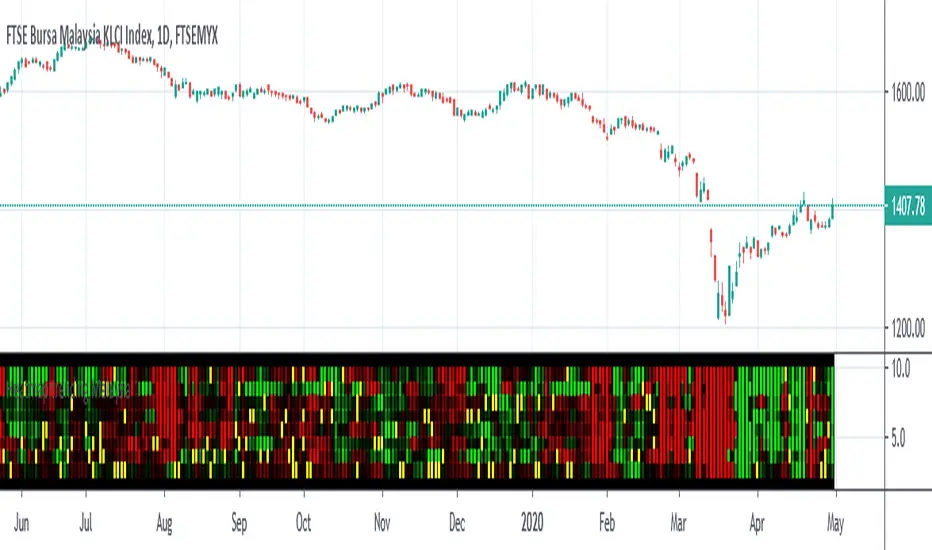
Heatmap trending MalaysiaThis heatmap chart is created base on Heikin Ashi trend for Malaysia Major Index
CONSTRUCTN ,TECHNOLOGY,FINANCE,CONSUMER,PROPERTIES,IND-PROD,PLANTATION,REIT.
This allow compare to malaysia stock for macro trending.
Lastly ,thank to LonesomeTheBlue which inspire me for this coding .
Heikin-Ashi Source FunctionCustom source function for toggling traditional Candle sources or Heikin-Ashi sources on a traditional Candles chart.
Thanks to PineCoders for rounding method: www.pinecoders.com
Thanks to @LucF and @RicardoSantos for their advice and enlightenment as always.
NOTICE: This is an example script and not meant to be used as an actual strategy. By using this script or any portion thereof, you acknowledge that you have read and understood that this is for research purposes only and I am not responsible for any financial losses you may incur by using this script!
Pivot Points Standard Asian RangeThis script is a trend following template for intraday trading. When the moving averages cross, you get your signal to look for buy/ sell trades only. wait for price to pullback before entering for continuation trades. Can be used for counter trend trading strategy as well. Best used with heiken-ashi candles.

Briz HA MTF - A Heikin-Ashi Multi-Timeframe Indicator Ever wanted to know what Heikin-Ashi candles are showing for multiple time frames at a glance? Adjustable time frame for each row. Arrows show when each column is either all green (white up arrow) or all red (yellow down arrow).

Smooth HA / Hull MA / MTF===========
Smooth HA / Hull MA / MTF
===========
A combination of a Smoothed Heikin Ashi Chart Line and a Hull MA Line, paints a "Long" or "Short" alert when the Hull MA changes color - editable settings for the smoothing of HA data and Hull MA Length; you can also change the time frame used (must be the same or longer as the chart).
-----------
This indicator does a real good job at finding highs and lows (otherwise known as entry and exit points!) picking up on just about every large, decent swing and making the most from those big moves! The disadvantage of all Smoothed HA strategies are when times are choppy or ranging - given the natural lag of the indicator you can be sure in choppy times you'd be buying at the top and selling at the bottom almost every time ~ No indicator is perfect!
This Smooth HA/Hull MA indicator also has a built in MTF function (Multi-Time-Frame). This means you can be using a 1hr chart and set the indicator to a 4hr chart - generally any movements on a greater time frame will overcome any movements of the smaller time frame, so this is where you should be gathering data about which direction the market is moving - as always, follow the trend.
Hope (like always) this is of at least some use to some people.
Good Luck and Happy Trading!


Heikin Ashi With Moving Averages This script is using 4 moving averages, 2 for short term movements, and 2 for long term movements.
Used on Heikin Ashi will help identify short term that is true short term, and Short Term that will most likely turn into a long term trend.
color coded candlesticks will identify if the price action is low in RSI or STOCH. colors can be changed in settings
If you need help understanding the settings let me know ill help you just post the question
You will need to add Heikin Ashi on your chart to get the full effect of this script. Nevertheless, you can use it on traditional candlesticks
