Ashi

10/20 MA Cross-Over with Heikin-Ashi Signals by SchobbejakThe 10/20 MA Heikin-Ashi Strategy is the best I know. It's easy, it's elegant, it's effective.
It's particularly effective in markets that trend on the daily. You may lose some money when markets are choppy, but your loss will be more than compensated when you're aboard during the big moves at the beginning of a trend or after retraces. There's that, and you nearly eliminate the risk of losing your profit in the long run.
The results are good throughout most assets, and at their best when an asset is making new all-time highs.
It uses two simple moving averages: the 10 MA (blue), and the 20 MA (red), together with heikin-ashi candles. Now here's the great thing. This script does not change your regular candles into heikin-ashi ones, which would have been annoying; instead, it subtly prints either a blue dot or a red square around your normal candles, indicating a heikin-ashi change from red to green, or from green to red, respectively. This way, you get both regular and heikin ashi "candles" on your chart.
Here's how to use it.
Go LONG in case of ALL of the below:
1) A blue dot appeared under the last daily candle (meaning the heikin-ashi is now "green").
2) The blue MA-line is above the red MA-line.
3) Price has recently breached the blue MA-line upwards, and is now above.
COVER when one or more of the above is no longer the case. This is very important. You want to keep your profit.
Go SHORT in case of ALL of the below:
1) A red square appeared above the last daily candle (meaning the heikin-ashi is now "red").
2) The red MA-line is above the blue MA-line.
3) Price has recently breached the blue MA-line downwards, and is now below.
Again, COVER when one or more of the above is no longer the case. This is what gives you your edge.
It's that easy.
Now, why did I make the signal blue, and not green? Because blue looks much better with red than green does. It's my firm believe one does not become rich using ugly charts.
Good luck trading.
--You may tip me using bitcoin: bc1q9pc95v4kxh6rdxl737jg0j02dcxu23n5z78hq9 . Much appreciated!--

10/20 MA Cross-Over with Heikin-Ashi Signals by SchobbejakThe 10/20 MA Heikin-Ashi Strategy is the best I know. It's easy, it's elegant, it's effective.
It's particularly effective in markets that trend on the daily. You may lose some money when markets are choppy, but your loss will be more than compensated when you're aboard during the big moves at the beginning of a trend or after retraces. There's that, and you nearly eliminate the chances of losing your profit.
The results are good throughout most assets, and at their best when an asset is making new all-time highs.
It uses two simple moving averages: the 10 MA (blue), and the 20 MA (red), together with heikin-ashi candles. Now here's the great thing. This script does not change your regular candles into heikin-ashi ones, which would have been annoying; instead, it subtly prints either a blue dot or a red square around your normal candles, indicating a heikin-ashi change from red to green, or from green to red, respectively. This way, you get both regular and heikin ashi "candles" on your chart.
Here's how to use it.
Go LONG in case of ALL of the below:
1) A blue dot appeared under the last daily candle (meaning the heikin-ashi is now "green").
2) The blue MA-line is above the red MA-line.
3) Price has recently breached the blue MA-line upwards, and is now above.
COVER when one or more of the above is no longer the case. This is very important. You want to keep your profit.
Go SHORT in case of ALL of the below:
1) A red square appeared above the last daily candle (meaning the heikin-ashi is now "red").
2) The red MA-line is above the blue MA-line.
3) Price has recently breached the blue MA-line downwards, and is now below.
Again, COVER when one or more of the above is no longer the case. This is what gives you your edge.
It's that easy.
Now, why did I make the signal blue, and not green? Because blue looks much better with red than green does. It's my firm believe one does not become rich using ugly charts.
Good luck trading.
--You may tip me using bitcoin: bc1q9pc95v4kxh6rdxl737jg0j02dcxu23n5z78hq9 . Much appreciated!--

Function To Candles - Another way to see indicatorsIntroduction
There are different and better way's to see price data, a candlestick chart is one of the best way to see the price since you have access to the open/high/low/close information, this is really efficient and can allow for naked non parametric trading strategies (candlesticks patterns) . But what about making candles out of indicators ? There are tons of studies about candlesticks patterns in price data but none (?) about candlestick patterns using indicator data, therefore i made this script in order to show candles from various indicators, i also made an heikin-ashi mode.
Rsi To Candles
All the indicators are use the open/high/low/close price as input in order to return candles. length control the indicator period.
Stochastic To Candles
The stochastic oscillator is restrained in a range of 0/100, therefore when equal to 0 or 100 the candles can be flat.
Rate Of Change To Candles
The rate of change don't distort price as heavily as other indicators since its based on differencing.
Center Of Gravity To Candles
The center of gravity (cog) is defined from tradingview as "an indicator based on statistics and the Fibonacci golden ratio", its not an indicator i'am familiar with and i don't know if its the same proposed by Elhers. The candles are smooth, high length can flatten the candles heavily making them hard to see.
Correlation Oscillator
In a range of -1/1 this indicator is quite smooth and can also flatten candles.
Patterns And Heikin-Ashi
There are tons of patterns that can be generated from candlesticks, they can be applied to this indicator as well.
The indicator can show an heikin-ashi mode, heikin-ashi candlestick use averaging to plot candles, this is why they appear smoother, some signals generated from heikin-ashi candles are :
Bullish body with no lower shadows = Strong Uptrend
Bearish body with no higher shadows = Strong Downtrend
High range and small body = Indecision/Risk of reversal
Conclusion
I made an indicator able to draw candles from other indicators, those candles contain various information that can generate decision from patterns. I hope you find a use to it, if its the case share your findings with me, maybe that you will even be able find a new candlestick pattern :)
Thanks for reading !

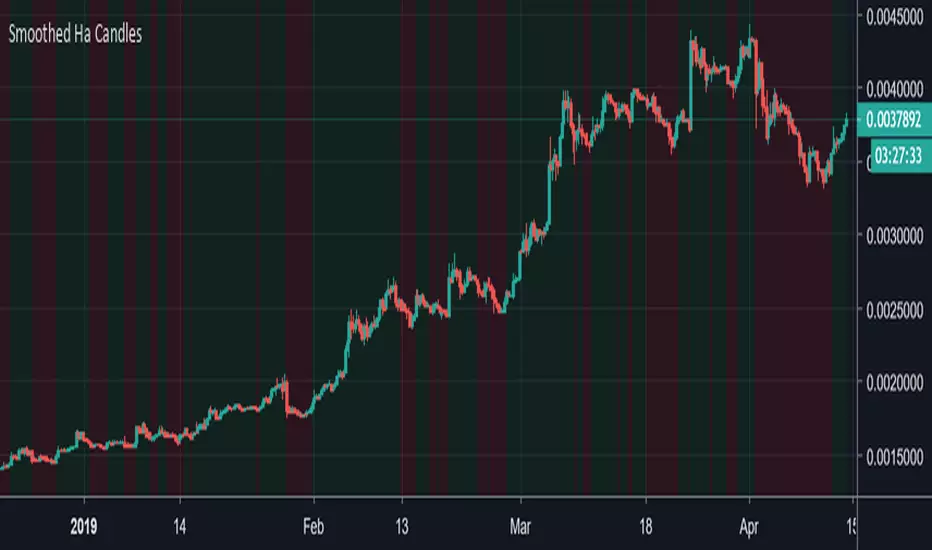
Smoothed Heiken Ashi CandlesScript that uses smoothed heikin ashi candles.
This is to be used on ordinary candles only.
I use this only on cryptocurrency. It's easy to dial in settings relative to each specific coin. I've found a lot of success using len1 particularly. Not to be used in small timeframes under 4 hours.
It will lose a lot of trades, but the point is that this strategy will catch any trends extremely well. This will more than offset any losses incurred along the way.
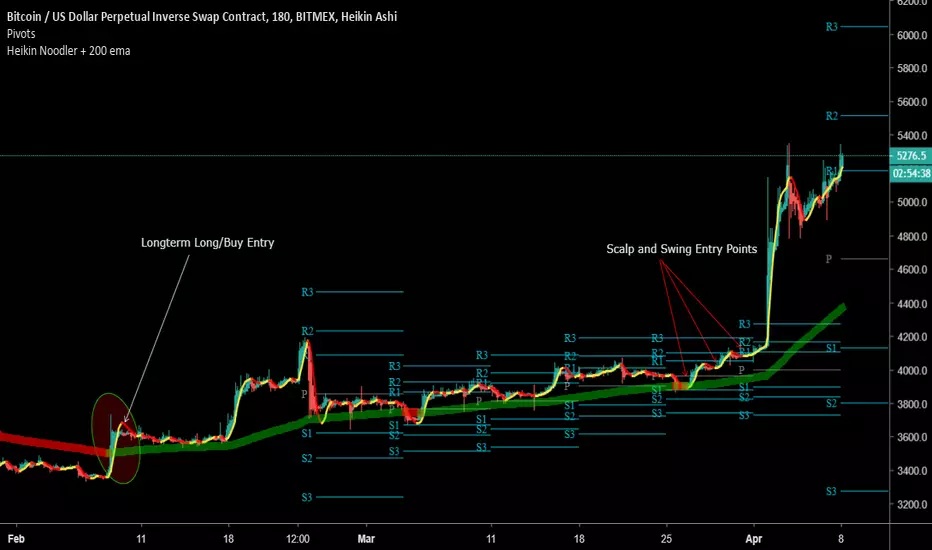
Heikin Noodler + 200 ema V2Respect the law of averages. When prices averages begin to move upward or downward, price generally follows the averaged direction.
Long/Buy on Green and Sell/Short on
Red.
I personally set my stop loss for longs/buys at the lowest low of the candles before the trend changes.
For shorts/sell, I set the stop loss at the highest high before the trend changed.
Alerts can be based on the color change.
Longer Term Trading Tip:
I added the 200 EMA, so we could identify longer term trends. The 200 EMA is th larger line turning green and red based on trend.
Wait until Heikin Noodler crosses the 200 to be at the potential start of trend change.
Scalping and Swing Trade Tips:
Trades are based solely on the smaller line which follows price directly. Just set your alerts, stop loss and ride it out.
Inbox me the words "I WANT IN NOW" for access to the indicator.
I will add people once per day. So no worries if you dont have access in 30 seconds...loI
I also have a small FREE chat group that I will be focusing on again as I have more time these days so we can share charts and ideas.
Happy Trading,
FIBAUS
Heikin Ashi OscillatorTrigger (Current Period): Heikin Ashi candle heights are plotted to form and oscillator.
Trend (1W): A slower period is also plotted.
When Trend is rising, dips in the Trigger are buying opportunities
When Trend is descending, peaks in the Trigger are selling opportunities

IO_Heikin-Ashi OverlayThis is Traditional Heikin-Ashi bars overlayed with regular candlestick/any chart type
Although HA is available in TradingView by default, this script is to recalculate HA by traditional calculations.
This version REPAINTS!! This is because Traditional HA uses Close Price (which is calculated on the fly).
-- Invsto

Heikin Ashi CandlesBetter results on 23hr chart, input settings (len, len2) at 3.
To be used over long periods of time.
Heiken-Ashi Direction Bias BlocksThis script adds red/green blocks to the top of every chart that show the current daily Heiken Ashi candle colour, so even when you're on a 1h or 4h chart you can quickly see if the current day is bullish or bearish. The higher timeframe is customisable too, so if you prefer to use weekly HA values, then now's your time to shine.
Useful for quickly going through charts without having to load the daily HA chart each time.

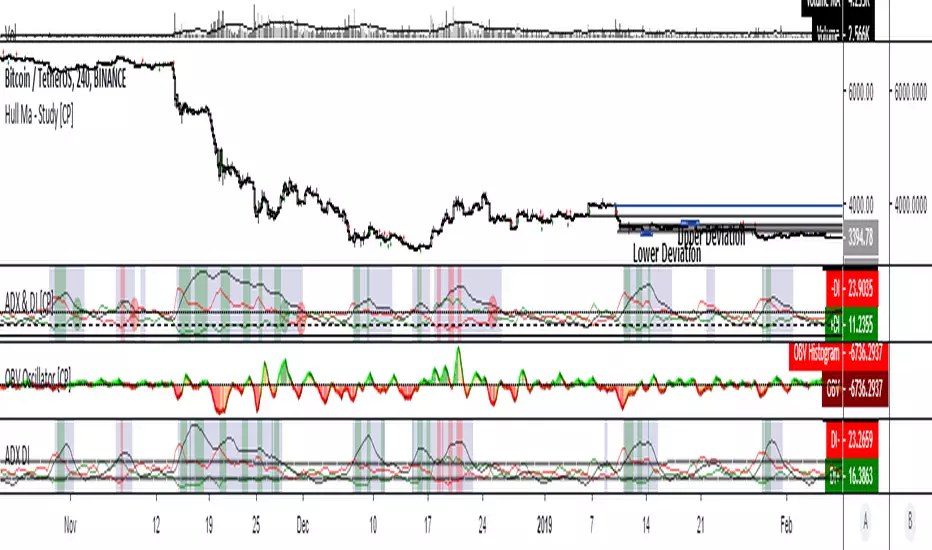
ADX & DI with Long + Short ConditionsMy version of the ADX & DI Indicator with an extra theshold and adjustable long and short conditions.
A green background (long) will appear when the ADX is rising, the DI+ is falling and the DI+ is below the (new) lower threshold.
A red background (short) will appear when the ADX is rising, the DI- is falling and the DI- is below the (new) lower treshold.
You can adjust the tolerance for the lower threshold in the settings of the indicator.
[AN] HAStudy that signals buy and sell zones based on HeikinAshi chart.
Also includes exit signals.
Strategy that tests the signals is available here:

HAMA alertHeikin Ashi + EMA alert
- all time frame
---------------------------------
BTCUSDT
Dump protect

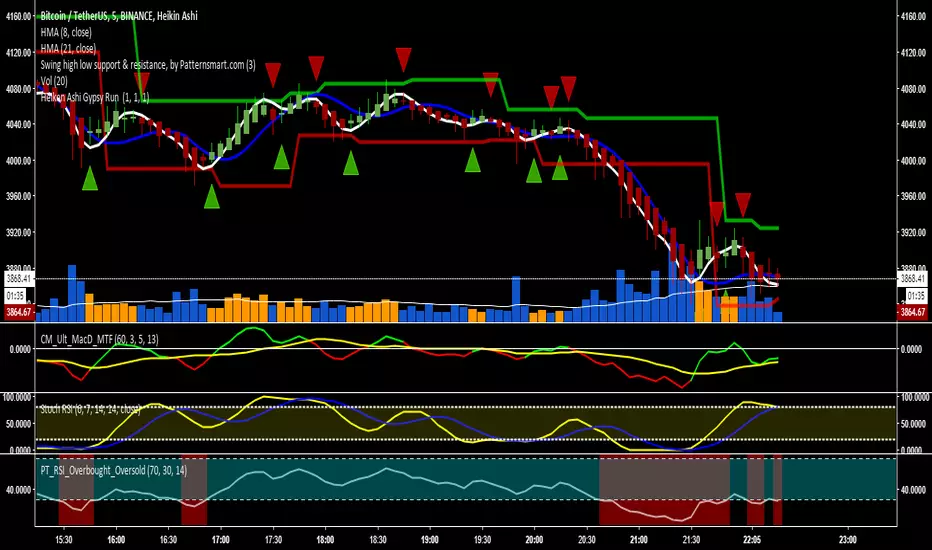
Heiken Ashi Gypsy Run Alerts & triggers based on heiken ashi changes in the colour of the candle, default settings are at 1, 1, 1 meaning it will trigger every time there is a change in the colour of the candle. You can change so it isn't as sensitive. It also has alert settings.

Mr Anderson Simple Moving Average Strategy with Bend10This script is based on Mr. Anderson's (also known as TrueCrypto28 on twitter) 10/20 Day SMA trading strategy.
This is the extended strategy which includes the Heikin Ashi candle addition, and also the Bend10 strategy.
Full explanation of strategy can be found on this thread: twitter.com
I believe there is a paid version of this indicator, but I believe it looks a bit messy, and does not include the Bend10 addition.
This version is free, less cluttered (my opinion), includes the Bend10 indicator flags, and also changes the background to show where the MAs cross.
Default indicator values align with Mr. Anderson's strategy. You can switch timeframes and it will remain based on the 1D unless you change it in the settings.
Indicator is based on the Heikin-Ashi candles, but you do not need to have these candles active for the indicator to work. It will work regardless of what candles you use.
EXPLANATION OF INDICATOR:
- "long" + green up arrow is printed when all of the long conditions are met
---> this is where you would enter a long trade
- green 'X' is printed when the long cover condition is met (HA candle flips red/price drops below 10d SMA/bearish SMA cross)
---> this is where you would exit your long trade
- "short" + red down arrow is printed when all of the short conditions are met
---> this is where you would enter a short trade
- red 'X' is printed when one of the short cover conditions are triggered (HA candle flips green/price goes above 10d SMA/bullish SMA cross)
---> this is where you would exit your short trade
- green 'B' is printed when the BEND10 long condition is met (bearish trending 10d SMA starts bending, price breaks above 10d SMA, and HA candle flips from red to green)
---> this is where you CAREFULLY consider going long. This flag is to catch big pumps earlier than the long signals. If you do make an entry here, it is advised that you keep a tight stop loss, and take profits when the price reaches the 20d SMA
- The background color for a candle is red when there is a bearish MA cross (fast beneath slow)
- The background color for a candle is green when there is a bullish MA cross (fast above slow)

3 TimeframesThis script allows you to overlay 2 other timeframes' open and close over your chart. It also has the option to overlay Heikin Ashi candles open and close over regular candles and vice versa, simply change the values in the settings. You can also set alerts for specific open/close.
🥢Crypto-Sticks: Ehler's Universal Oscillator by Cryptorthyhms🥢Crypto-Sticks™: Ehler's Ultimate Oscillator
A new series of indicators brought to you by Cryptorthyhms...giving you an alternate look at your trusted favorites! Follow me, there are still 2 dozen Crypto-Sticks indicators planned - all will be released in public library.
🚀Indicator Specific Info
New Crypto-Sticks option is an EMA of the average signal line output. Eventually I will go back and update the previous indicators with this feature as well!
Heiken Ashi candles (default) adds some more clear trend changing points. HA example here:
Volume weighting the HA candles adds a different dimension to the indicator which I have to explore more fully. VW does work somewhat on this indicator, skewing output but also adding (too much in my opinion) noise. An example of VW+HA:
💭Please leave me any ideas or feedback you have!
🚫If you use volume weighting you should be on heiken candles.
🚀Crypto-Sticks General Info
🚧This series isnt polished 100%, and I have some more options I will add in the future. But for now, I want to just release them, as I am not sure when I will have the time to put more work into them (many other big projects I am working on).
📊Its basically reinterpretations of all your favorite indicators. I calculate the values a little bit differently than normal, but the end result is creating a candlestick chart (for the indicator!). Then I added the option to plot them as Heiken Ashi candles to smooth out noise and make signaling easier. I recommend using the indicator on this setting.
🔊Lastly I implemented a Volume Weighting system for them all which simply integrates volume into the formulas for these indicators. For the most part this feature is experimental and doesn't provide huge utility (yet - I have other ways I want to try it as well - just no time). Though on some of the indicators it already shows great promise.
👍Enjoying this indicator or find it useful? Please give me a like and follow! There are many more indicators to be released in this series, not to mention I post crypto analysis and other free indicators regularly.
💬Questions? Comments? Want to get access to an entire suite of proven trading indicators? Come visit us on telegram and chat, or just soak up some knowledge. We make timely posts about the market, news, and strategy everyday. Our community isnt open only to subscribers - everyone is welcome to join.

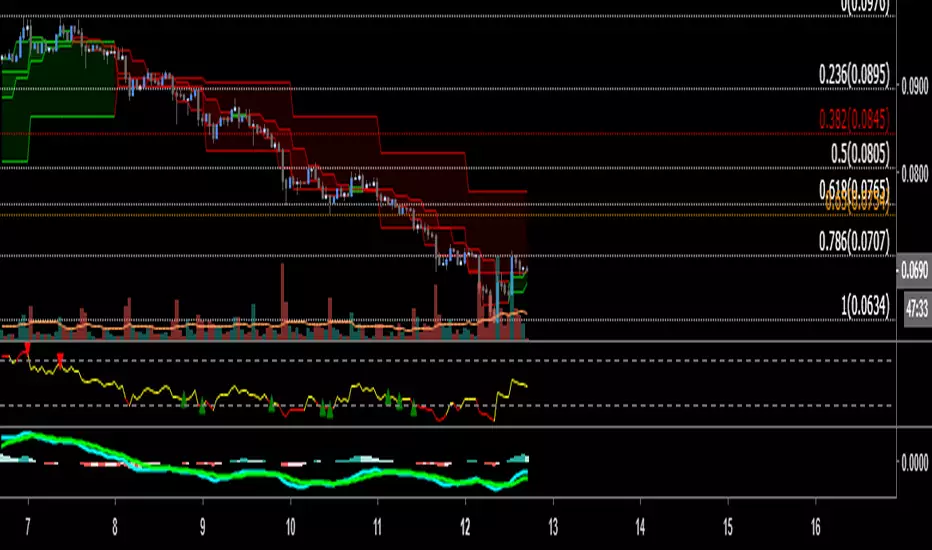
🥢 Crypto-Sticks: Rate of Change v1.0 by Cryptorthyhms🥢 Crypto-Sticks™ Rate of Change
A new series of indicators brought to you by Cryptorthyhms...giving you an alternate look at your trusted favorites!
🚀 Indicator Specific Info
⛔Please remember that you will have to adjust the ROC overbought and oversold levels to suit the volatility of the instrument you are working with. In the future I will implement a feature that does this automatically, but for now its manual.
The OB/OS zones are given in two levels, because often you can find a line of best fit that will hit "small movements" and one that will hit "big movements." In this case I chose 2 and -2 for the small zones. For the bigger zones i chose 5 and -5.
Heiken Ashi candles adds some more clear trend changing points which can be executed at the second candle going in either direction. Other coins/charts will require their own strategy - you could potentially have to tweak that parameter. In this example you would enter on 2nd green, exit on 2nd red.
Volume weighting the HA candles adds a different dimension to the indicator which I have to explore more fully.
Since WTI doesnt have volume, this feature is irrelevant for this chart.
💭Please leave me any ideas or feedback you have!
🚫If you use volume weighting you should be on heiken candles.
🚀 Crypto-Sticks General Info
🚧This series isnt polished 100%, and I have some more options I will add in the future. But for now, I want to just release them, as I am not sure when I will have the time to put more work into them (many other big projects I am working on).
📊Its basically reinterpretations of all your favorite indicators. I calculate the values a little bit differently than normal, but the end result is creating a candlestick chart (for the indicator!). Then I added the option to plot them as Heiken Ashi candles to smooth out noise and make signaling easier. Here's how it looks as Heiken Ashi:
🔊Lastly I implemented a Volume Weighting system for them all which simply integrates volume into the formulas for these indicators. For the most part this feature is experimental and doesn't provide huge utility (yet - I have other ways I want to try it as well - just no time). Though on some of the indicators it already shows great promise.
👍Enjoying this indicator or find it useful? Please give me a like and follow! There are many more indicators to be released in this series, not to mention I post crypto analysis and other free indicators regularly.
💬Questions? Comments? Want to get access to an entire suite of proven trading indicators? Come visit us on telegram and chat, or just soak up some knowledge. We make timely posts about the market, news, and strategy everyday. Our community isnt open only to subscribers - everyone is welcome to join.

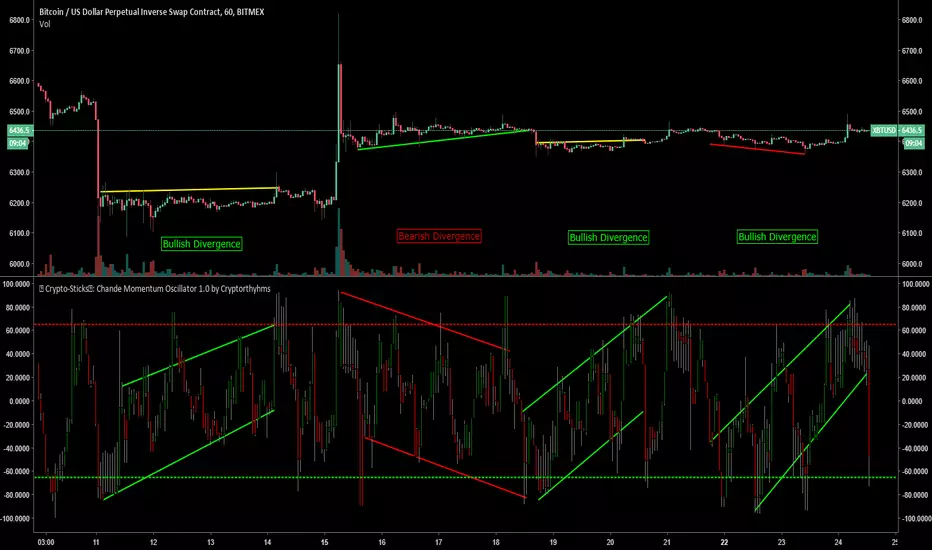
🥢 Crypto-Sticks™: Chande Momentum Osc by Cryptorthyhms🥢 Crypto-Sticks™
A new series of indicators brought to you by Cryptorthyhms...giving you an alternate look at your trusted favorites!
🚀 Indicator Specific Info
I have found this indicator to show nice divergences as shown on the main chart. Even in this nightmarish sideways bitcoin movement, it still is giving decent divergence signals! It also gives a signaling system to CMO implementing overbought and oversold zones. This indicator is freely available for anyone from the public library.
🚀 Crypto-Sticks General Info
💭This series isnt polished 100%, and I have some more options I will add in the future. But for now, I want to just release them, as I am not sure when I will have the time to put more work into them (many other big projects I am working on).
📊Its basically reinterpretations of all your favorite indicators. I calculate the values a little bit differently than normal, but the end result is creating a candlestick chart (for the indicator!). Then I added the option to plot them as Heiken Ashi candles to smooth out noise and make signaling easier. Here's how it looks as Heiken Ashi:
🔊Lastly I implemented a Volume Weighting system for them all which simply integrates volume into the formulas for these indicators. For the most part this feature is experimental and doesn't provide huge utility ( yet - I have other ways I want to try it as well - just no time). Though on some of the indicators it already shows great promise. Here is Volume Weighted + Heiken Ashi:
👍Enjoying this indicator or find it useful? Please give me a like and follow! There are many more indicators to be released in this series, not to mention I post crypto analysis and other free indicators regularly.
💬Questions? Comments? Want to get access to an entire suite of proven trading indicators? Come visit us on telegram and chat, or just soak up some knowledge. We make timely posts about the market, news, and strategy everyday. Our community isnt open only to subscribers - everyone is welcome to join.
📊 Crypto-Sticks: Chande Momentum Oacillator 1.0 by CryptorthyhmsFirst release from the Crypto-Sticks series of indicators... brought to you by Cryptorthyhms!
🚀 Indicator specific Info
I find this implementation of CMO useful for spotting divergences and for creating signals based on the indicator. Some divergences were highlighted on the chart/indicator showing you potential use cases.
🚀 Crypto-Sticks General Info
💭The idea behind this series isnt polished 100%, and I have some more options I will add in the future. But for now, I want to just release them, as I am not sure when I will have the time to put more work into them (many other big projects I am working on).
📊Its basically reinterpretations/remixes of all your favorite indicators. I calculate the values a little bit differently than normal, but the end result is creating a candlestick chart (for the indicator!). Then I added the option to plot them as Heiken Ashi candles to smooth out noise and make signaling easier.
🔊Lastly I implemented a Volume Weighting system for them all which simply normalizes volume and integrates it into the formulas for these indicators. For the most part this feature is experimental and doesnt provude huge utility (yet - I have other ways I want to try it as well - just no time).
💠I have found the candlestick implementation offers some unique perspectives and I hope you find it useful!
👍If you enjoy the indicators, feel free to give it a like and follow me! Many more free indicators to come in this series.
💬Questions? Comments? Want to become a subscriber and gain access to tons of powerful custom indicators? Join us on our telegram which is linked in my signature below!

Librehash Heikin ScalpsThe ZN Heikin Candle Signals is a special indicator that is designed to do two things:
1. Provide all 'new' candles for you.
2. Provide entries and exits.
The purpose of this indicator is to provide a different set of candles that will allow you to see trends in the price data easier by smoothing it over and providing a slightly modified Heikin Ashi candle formula (no, it is not equivalent to the Heikin Ashi formula; i.e., the OHLC/4 for the opening that it commonly uses)
The indicator is fairly straightforward in its design as well, so this description will remain brief for the time being.
Essentially, what we did is create our own candle system. Then we installed buy and sell signals on those candles in order to give users super tight entries and exits.
Simple put, this is a must-have in any trading suite. These candles are not exact replicas of the Heikin Ashi, but rather a clever modification that allows for easier trend reading whilst still allowing you to exit at the tippy top or enter at the very bottom of a trend per the actual prices on the chart.
Here’s one major example:
Here we can see the indicator calling a sell before a major fall and not re-calling it until the precipitous negative price action completely exhausts itself.
Additional Notes
For some charts and time frames, you may need to tinker with the metrics in the control panel slightly (i.e., change the period and also the 'fastener' settings ever so slightly). Make sure to backtest after any and all changes that you make in the control panel and understand that different settings work better in different situations for different coins if you're looking to absolutely optimize this indicator for it to perform its best.
This is not necessary, but something that you all may find helpful as you're trading.
If you have purchased this indicator and you have any additional questions/concerns, please do not hesitate to reach out to me through here or via my other channels I have specified (TradingView does not allow me to post links; you know how to reach me).
Also, if you are interested in purchasing and have not done so yet, please reach out at your earliest convenience.
Thank you.
