UT Bot Stochastic RSIUT Bot Stochastic RSI is a powerful trading tool designed to help traders identify potential buy and sell signals in the market. This indicator combines the Stochastic and RSI (Relative Strength Index) oscillators, two of the most popular and effective technical analysis tools, to provide a comprehensive view of market conditions.
The Stochastic oscillator is a momentum indicator that compares a security's closing price to its price range over a given time period. The RSI, on the other hand, is a momentum oscillator that measures the speed and change of price movements. By combining these two indicators, the UT Bot Stochastic RSI can help traders identify overbought and oversold conditions, as well as potential trend reversals.
The UT Bot Stochastic RSI also includes an ATR (Average True Range) trailing stop, which can be used to set stop-loss levels and manage risk. This feature is particularly useful in volatile markets, where price movements can be large and unpredictable.
In addition to its powerful technical analysis tools, the UT Bot Stochastic RSI also includes a backtesting feature, allowing traders to test their strategies on historical data. This can help traders identify the most effective settings for the indicator and improve their trading performance.
Overall, the UT Bot Stochastic RSI is a versatile and effective tool for traders of all levels, providing valuable insights into market conditions and helping to improve trading decisions
ATR

Range Finder [UAlgo]🔶 Description:
The "Range Finder " indicator aims at identifying and visualizing price ranges within a specified number of candles. By utilizing the Average True Range (ATR) indicator and Simple Moving Average (SMA), it detects potential breakout conditions and tracks consecutive candles that remain within the breakout range. This indicator offers flexibility by allowing users to customize settings such as range length, method for determining range breaks (based on either candle close or wick), and visualization options for displaying range breaks on the chart.
🔶 Key Features
Identifying Ranges: The Range Finder automatically adapts to the market by continuously evaluating the Average True Range (ATR) and its Simple Moving Average (SMA). This helps in dynamically adjusting the range based on market volatility.
Range Length: Users can specify the number of candles to be used for constructing the range via the "Range Length" input setting. This allows for customization based on trading strategies and preferences.
Range Break Method: The indicator offers the flexibility to choose between two methods for identifying range breaks. Users can select between "Close" or "Wick" based on their preference for using the closing price or the highs and lows (including wicks) of candles for defining the breakout.
Show Range Breaks: This option enables visual representation of range breaks on the chart. When activated, labels with the letter "B" will appear at the breakout point, colored according to the breakout direction (upward breakouts in the chosen up range color and downward breakouts in the chosen down range color).
Range Color Customization: The indicator provides the ability to personalize the visual appearance of the range by selecting preferred colors for ranges indicating potential upward and downward breakouts.
🔶 Disclaimer
It's important to understand that the Range Finder indicator is intended for informational purposes only and should not be solely relied upon for making trading decisions. Trading financial instruments involves inherent risks, and past performance is not necessarily indicative of future results.

Trend: SMA with ATR Bands and EMA [Oxyge]Brief introduction:
Easy to use trend indicator to help find entry positions
How it works:
1, short-term trend judgment: EMA is greatly influenced by short-term trends, so it is very good to use it as a tool for judging short-term trends. At the same time, the filtering function has been added:
Long: green
Short: red
No direction: blue
2, the general trend judgment: the use of 30SMA as the default trend line, while increasing the ATR band to increase the scope of judgment.
How do I use (assuming it is now a period of long market):
1, first look at the 30SMA and ATR band, if the slope is positive (> 45 °), then ready to go long!
2. When price comes to the ATR band, the ATR band is my point of interest
3. Wait for a test of the ATR band: the EMA turns green, which means that the short-term trend is already nice and long.
4. Stop Loss Placement: Stop Loss is placed at the most recent low.
Closing
Enjoy it!
——————————————
简单介绍:
简单易用的趋势指标,帮助寻找进场位置
它怎么工作:
1、短期趋势判断:EMA受短期趋势影响很大,因此把它作为判断短期趋势的工具非常好用。同时增加了过滤功能:
多头:绿色
空头:红色
无方向:蓝色
2、大趋势判断:使用30SMA作为默认趋势线,同时增加ATR带增加判断范围。
我是如何使用的(假设是现在是一段多头行情):
1、先看30SMA和ATR带,如果斜率为正(>45°),那么准备做多
2、当价格来到ATR带时,ATR带是我的感兴趣的点
3、等待一次对于ATR带的测试:EMA变成绿色,代表短期已经是不错的多头趋势
4、止损放置:止损放置在最近的低点
结束
请享受它

ATR Bands (Keltner Channel), Wick and SRSI Signals [MW]Introduction
This indicator uses a novel combination of ATR Bands, candle wicks crossing the ATR upper and lower bands, and baseline, and combines them with the Stochastic SRSI oscillator to provide early BUY and SELL signals in uptrends, downtrends, and in ranging price conditions.
How it’s unique
People generally understand Bollinger Bands and Keltner Channels. Buy at the bottom band, sell at the top band. However, because the bands themselves are not static, impulsive moves can render them useless. People also generally understand wicks. Candles with large wicks can represent a change in pattern, or volatile price movement. Combining those two to determine if price is reaching a pivot point is relatively novel. When Stochastic RSI (SRSI) filtering is also added, it becomes a genuinely unique combination that can be used to determine trade entries and exits.
What’s the benefit
The benefit of the indicator is that it can help potentially identify pivots WHEN THEY HAPPEN, and with potentially minimal retracement, depending on the trader’s time window. Many indicators wait for a trend to be established, or wait for a breakout to occur, or have to wait for some form of confirmation. In the interpretation used by this indicator, bands, wicks, and SRSI cycles provide both the signal and confirmation.
It takes into account 3 elements:
Price approaching the upper or lower band or the baseline - MEANING: Price is becoming extended based on calculations that use the candle trading range.
A candle wick of a defined proportion (e.g. wick is 1/2 the size of a full candle OR candle body) crosses a band or baseline, but the body does not cross the band or baseline - MEANING: Buyers and sellers are both very active.
The Stochastic RSI reading is above 80 for SELL signals and below 20 for BUY signals - MEANING: Additional confirmation that price is becoming extended based on the current cyclic price pattern.
How to Use
SIGNALS
Buy Signals - Green(ish):
B Signal - Potential pivot up from the lower band when using the preferred multiplier
B1 Signal - Potential pivot up from the lower band when using phi * multiplier
B2 Signal - Potential pivot up from the lower band when using 1/2 * multiplier
B3 Signal - Potential pivot up from baseline
Sell Signals - Red(ish):
S Signal - Potential pivot down from the upper band when using the preferred multiplier
S1 Signal - Potential pivot down from the upper band when using
S2 Signal - Potential pivot down from the upper band when using 1/2 * multiplier
S3 Signal - Potential pivot down from the baseline
DISCUSSION
During an uptrend or downtrend, signals from the baseline can help traders identify areas where they may enter the trending move with the least amount of drawdown. In both cases, entry points can occur with baseline signals in the direction of the trend.
For example, in an uptrend (when the price is forming higher highs and higher lows, or when the baseline is rising), price tends to oscillate between the upper band and baseline. In this case, the baseline BUY signal (B3) can show an entry point.
In a downtrend (when the price is forming lower highs and lower lows, or when the baseline is falling), price tends to oscillate between the baseline and the lower band. In this case, the baseline SELL signal (S3) can show an entry point.
During consolidation, when price is ranging, price tends to oscillate between the upper and lower bands, while crossing through the baseline unperturbed. Here, entry points can occur at the upper and lower bands.
When all conditions are met at the lower band during consolidation, a BUY signal (B), can occur. This signal may also occur prior to a break out of consolidation to the upside.
When all conditions are met at the upper band during consolidation, a SELL signal (S), can occur. This signal may also occur prior to a break out of consolidation to the downside.
Additional B1, B2, and S1, and S2 signals can be displayed that use the bands based on a multiplier that is half that of the primary one, and phi (0.618) times the primary multiplier as a way to quickly check for signals occurring along different, but related, bands.
Calculations
ATR Bands, or Keltner Channels, are a technical analysis tool that are used to measure market volatility and identify overbought or oversold conditions in the trading of financial instruments, such as stocks, bonds, commodities, and currencies. ATR Bands consist of three lines plotted on a price chart:
Middle Band, Basis, or Baseline: This is typically a simple moving average (SMA) of the closing prices over a certain period. It represents the intermediate-term trend of the asset's price.
Upper Band: This is calculated by adding a certain number of ATRs to the middle band (SMA). The upper band adjusts itself with the increase in volatility.
Lower Band: This is calculated by subtracting the same number of ATRs from the middle band (SMA). Like the upper band, the lower band adjusts to changes in volatility.
The candle wick signals occur if the wick is at the specified ratio compared to either the entire candle or the candle body. The upper band, lower band, and baseline signals happen if the wick is the specified ratio of the total candle size. For the major signals for upper and lower bands, these occur when the wick extends outside of the bands while closing a candle inside of the bands. For the baseline signals, they occur if a wick crosses a baseline but closes on the other side.
Settings
CHANNEL SETTINGS
Baseline EMA Period (Default: 21): Period length of the moving average basis line.
ATR Period (Default: 21): The number of periods over which the Average True Range (ATR) is calculated.
Basis MA Type (Default: SMA): The moving average type for the basis line.
Multiplier (Default: 2.5: The deviation multiplier used to calculate the band distance from the basis line.
ADDITIONAL CHANNELS
Half of Multiplier Offset (Default: True): Toggles the display of the ATR bands that are set a distance of half of the ATR multiplier.
Quarter of Multiplier Offset (Default: false): Toggles the display of the ATR bands that are set a distance of one quarter of the ATR multiplier.
Phi (Φ) Offset (Default: false): Toggles the display of the ATR bands that are set a distance of phi (Φ) times the ATR multiplier.
WICK SETTINGS FOR CANDLE FILTERS
Wick Ratio for Bands (Default: 0.4): The ratio of wick size to total candle size for use at upper and lower bands.
Wick Ratio for Baseline (Default: 0.4): The ratio of wick size to total candle size for use at baseline.
Use Candle Body (rather than full candle size) (Default: false): Determines whether wick calculations use the candle body or the entire candle size.
VISUAL PREFERENCES - SIGNALS
Show Signals (Default: true): Allows signal labels to be shown.
Show Signals from 1/2 Band Offset (Default: false): Toggle signals originating from 1/2 offset upper and lower bands.
Show Signals from Phi (Φ) Band Offset (Default: false): Toggle signals originating from phi (Φ) offset upper and lower bands.
Show Baseline Signals (Default: false): Toggle Baseline signals.
VISUAL PREFERENCES - BANDS
Show ATR (Keltner) Bands (Default: true): Use a background color inside the Bollinger Bands.
Fill Bands (Default: true): Use a background color inside the Bollinger Bands.
STOCHASTIC SETTINGS
Use Stochastic RSI Filtering (Default: False): This will only trigger some SELL signals when the stochastic RSI is above 80, and BUY signals when below 20.
K (Default: 3): The smoothing level for the Stochastic RSI.
RSI Length (Default: 14): The period length for the RSI calculation.
Stochastic Length (Default: 8): The period length over which the stochastic calculation is performed.
Other Usage Notes and Limitations
To understand future price movement, this indicator assumes that 3 things must be known:
Evidence of a change of market structure. This can be demonstrated by increased volatility, consolidation, volume spikes (which can be tracked with the MW Volume Impulse Indicator) or, in the case of this indicator, candle wicks.
The potential cause of the change. It could be a VWAP line (which can be tracked with the Multi VWAP , and Multi VWAP from Gaps indicators), an event, an important support or resistance level, a key moving average, or many other things. This indicator assumes the ATR bands can be a cause.
The current position in the price cycle. Oscillators like the RSI, and MACD, are typical measures of price oscillation (other oscillators like the Price and Volume Stochastic Divergence indicator can also be useful). This indicator uses the Stochastic RSI oscillator to determine overbought and oversold conditions.
When evidence of the change appears, and the potential cause of the change is identified, and the price oscillation is at a favorable position for the desired trading direction, this indicator will generate a signal.
ATR Bands (or Keltner Channels) are used to determine when price might “revert to the mean”. Crossing, or being near the upper or lower band, can indicate an overbought or oversold condition, which could lead to a price reversal. By tracking the behavior of candle wicks during these events, we can see how active the battle is between buyers and sellers.
If the top of a wick is large, it may indicate that sellers are aggressively attempting to bring the price down. Conversely, if the bottom wick is large, it can indicate that buyers are actively trying to counter the price action caused by selling pressure.
When this wicking action occurs at times when price is not near the upper band, lower band, or baseline, it could indicate the presence of an important level. That could mean a nearby VWAP line, a supply or demand zone, a round price number, or a number of other factors. In any case, this wick may be the first indication of a price reversal.
Shorter baseline periods may be better for short period trading like scalping or day trading, while longer period baselines can show signals that are better suited to swing trading, or longer term investing.
It's important for traders to be aware of the limitations of any indicator and to use them as part of a broader, well-rounded trading strategy that includes risk management, fundamental analysis, and other tools that can help with reducing false signals, determining trend direction, and providing additional confirmation for a trade decision. Diversifying strategies and not relying solely on one type of indicator or analysis can help mitigate some of these risks.
The TradingView platform allows a maximum of 500 labels per chart. This means that if your settings allow for a lot of signals, labels for earlier ones may not appear if the total number of labels exceeds 500 for the chart.

DEMA Adjusted Average True Range [BackQuant]The use of the Double Exponential Moving Average (DEMA) within your Adjusted Average True Range (ATR) calculation serves as a cornerstone for enhancing the indicator's responsiveness to market changes. To delve deeper into why DEMA is employed specifically in the context of your ATR calculation, let's explore the inherent qualities of DEMA and its impact on the ATR's performance.
DEMA and Its Advantages
As previously mentioned, DEMA was designed to offer a more responsive alternative to the traditional Exponential Moving Average (EMA). By giving more weight to recent price data, DEMA reduces the lag typically associated with moving averages. This reduction in lag is especially beneficial for short-term traders looking to capitalize on trend reversals and other market movements as swiftly as possible.
The calculation of DEMA involves the following steps:
Calculate EMA1: This is the Exponential Moving Average of the price.
Calculate EMA2: This is the Exponential Moving Average of EMA1, thus it is a smoothing of a smoothing, leading to a greater lag.
Formulate DEMA: The formula
EMA1 = EMA of price
EMA2 = EMA of EMA1
DEMA = (2 x EMA1) - EMA2
effectively doubles the weighting of the most recent data points by subtracting the lagged, double-smoothed EMA2 from twice the single-smoothed EMA1.
This process enhances the moving average's sensitivity to recent price movements, allowing the DEMA to adhere more closely to the price bars than either EMA1 or EMA2 alone.
Integration with ATR
In the context of your ATR calculation, the integration of DEMA plays a crucial role in defining the indicator's core functionality. Here's a detailed explanation of how DEMA affects the ATR calculation:
Initial Determination of DEMA : By applying the DEMA formula to the chosen source data (which can be adjusted to use Heikin Ashi candle close prices for an even smoother analysis), you set a foundation for a more reactive trend-following mechanism within the ATR framework.
Application to ATR Bands : The calculated DEMA serves as the central line from which the ATR bands are derived. The ATR value, multiplied by a user-defined factor, is added to and subtracted from the DEMA to form the upper and lower bands, respectively. This dynamic adjustment not only reflects the volatility based on the ATR but does so in a way that is closely aligned with the most recent price action, thanks to the utilization of DEMA.
Enhanced Signal Quality : The responsiveness of DEMA ensures that the ATR bands adjust more promptly to changes in market conditions. This quality is vital for traders who rely on the ATR bands to identify potential entry and exit points, trend reversals, or to assess market volatility.
By employing DEMA as the core component in calculating the Adjusted Average True Range, your indicator leverages DEMA's reduced lag and increased weight on recent data to provide a more timely and accurate measure of market volatility. This innovative approach enhances the utility of the ATR by making it not only a tool for assessing volatility but also a more reactive indicator for trend analysis and trading signal generation.
The main concept of combining these is to reduce lag, get a more robust signal and still capture clear trends over medium time horizons.
For me, this is best used in confluence with other indicators, it can be made faster in order to get fasters response time, or slower. This is all depending on the needs of you as a trader.
User Inputs:
The script offers several user-configurable inputs, such as the period lengths for DEMA and ATR calculations, the multiplication factor for the ATR, and options to use Heikin Ashi candles or standard price data. Additionally, it allows for the toggling of visual features, like the plotting of the DEMA ATR and its moving average, and the application of color-coded trends on price bars.
Additional Features:
Moving Average Confluence: Traders can opt to display a moving average of the DEMA ATR, choosing from various types (e.g., SMA, EMA, HMA). This feature provides a layer of confluence, aiding in the identification of trend direction and strength.
Trend Identification :
The script employs logical conditions to ascertain the trend direction based on the movement of the DEMA ATR. It assigns colors to represent bullish or bearish trends, which are reflected in the plotted lines and the coloring of price bars.
Alerts :
Customizable alert conditions for trend reversals enhance the utility of the indicator for active trading, notifying users of significant changes in trend direction.
1D Backtests
We include these backtests as a general proxy for how they work.
Please do your own calibrating to suit it to your own needs and backtest.
Past results don't = future results but they can help you understand how it functions.
INDEX:BTCUSD
INDEX:ETHUSD
BINANCE:SOLUSD

ATR Bands with Optional Risk/Reward Colors█ OVERVIEW
This indicator projects ATR bands and, optionally, colors them based on a risk/reward advantage for those who trade breakouts/breakdowns using moving averages as partial or full exit points.
█ DEFINITIONS
► True Range
The True Range is a measure of the volatility of a financial asset and is defined as the maximum difference among one of the following values:
- The high of the current period minus the low of the current period.
- The absolute value of the high of the current period minus the closing price of the previous period.
- The absolute value of the low of the current period minus the closing price of the previous period.
► Average True Range
The Average True Range was developed by J. Welles Wilder Jr. and was introduced in his 1978 book titled "New Concepts in Technical Trading Systems". It is calculated as an average of the true range values over a certain number of periods (usually 14) and is commonly used to measure volatility and set stop-loss and profit targets (1).
For example, if you are looking at a daily chart and you want to calculate the 14-day ATR, you would take the True Range of the previous 14 days, calculate their average, and this would be the ATR for that day. The process is then repeated every day to obtain a series of ATR values over time.
The ATR can be smoothed using different methods, such as the Simple Moving Average (SMA), the Exponential Moving Average (EMA), or others, depending on the user's preferences or analysis needs.
► ATR Bands
The ATR bands are created by adding or subtracting the ATR from a reference point (usually the closing price). This process generates bands around the central point that expand and contract based on market volatility, allowing traders to assess dynamic support and resistance levels and to adapt their trading strategies to current market conditions.
█ INDICATOR
► ATR Bands
The indicator provides all the essential parameters for calculating the ATR: period length, time frame, smoothing method, and multiplier.
It is then possible to choose the reference point from which to create the bands. The most commonly used reference points are Open, High, Low, and Close, but you can also choose the commonly used candle averages: HL2, HLC3, HLCC4, OHLC4. Among these, there is also a less common "OC2", which represents the average of the candle body. Additionally, two parameters have been specifically created for this indicator: Open/Close and High/Low.
With the "Open/Close" parameter, the upper band is calculated from the higher value between Open and Close, while the lower one is calculated from the lower value between Open and Close. In the case of bullish candles, therefore, the Close value is taken as the starting point for the upper band and the Open value for the lower one; conversely, in bearish candles, the Open value is used for the upper band and the Close value for the lower band. This setting can be useful for precautionally generating broader bands when trading with candlesticks like hammers or inverted hammers.
The "High/Low" parameter calculates the upper band starting from the High and the lower band starting from the Low. Among all the available options, this one allows drawing the widest bands.
Other possible options to improve the drawing of ATR bands, aligning them with the price action, are:
• Doji Smoothing: When the current candle is a doji (having the same Open and Close price), the bands assume the values they had on the previous candle. This can be useful to avoid steep fluctuations of the bands themselves.
• Extend to High/Low: Extends the bands to the High or Low values when they exceed the value of the band.
• Round Last Cent: Expands the upper band by one cent if the price ends with x.x9, and the lower band if the price ends with x.x1. This function only works when the asset's tick is 0.01.
► Risk/Reward Advantage
The indicator optionally colors the ATR bands after setting a breakpoint, one or two risk/reward ratios, and a series of moving averages. This function allows you to know in advance whether entering a trade can provide an advantage over the risk. The band is colored when the ratio between the distance from the break point to the band and the distance from the break point to the first available moving average reaches at least the set ratio value. It is possible to set two colorings, one for a minimum risk/reward ratio and one for an optimal risk/reward ratio.
The break point can be chosen between High/Low (High in case of breakout, Low in case of breakdown) or Open/Close (on breakouts, Close with bullish candles or Open with bearish candles; on breakdowns, Close with bearish candles or Open with bullish candles).
It is possible to choose up to 10 moving averages of various types, including the VWAP with the Anchor Period (2).
Depending on the "Price to MA" setting, the bands can be individually or simultaneously colored.
By selecting "Single Direction," the risk/reward calculation is performed only when all moving averages are above or below the break point, resulting in only one band being colored at a time. For this reason, when the break point is in between the moving averages, the calculation is not executed. This setting can be useful for strategies involving price movement from a level towards a series of specific moving averages (for example, in reversals starting from a certain level towards the VWAP with possible partial take profits on some previous moving averages, or simply in trend following towards one or more moving averages).
Choosing "Both Directions" the risk/reward ratio is calculated based on the first available moving averages both above and below the price. This setting is useful for those who operate in range bound markets or simply take advantage of movements between moving averages.
█ NOTE
This script may not be suitable for scalping strategies that require immediate entries due to the inability to know the ATR of a candle in advance until its closure. Once the candle is closed, you should have time to place a stop or stop-limit order, so your strategy should not anticipate an immediate start with the next candle. Even more conveniently, if your strategy involves an entry on a pullback, you can place a limit order at the breakout level.
(1) www.tradingview.com
(2) For convenience, the code for the Anchor Period has been entirely copied from the VWAP code provided by TradingView.

ATR Grid Levels [By MUQWISHI]▋ INTRODUCTION :
The “ATR Levels” produces a sequence of horizontal line levels above and below the Center Line (reference level). They are sized based on the instrument's volatility, representing the average historical price movement on a selected higher timeframe using the average true range (ATR) indicator.
_______________________
▋ OVERVIEW:
_______________________
▋ IMPLEMENTATION:
The indicator starts by drawing a Center Line that is selected by the user from a variety of common levels. Then, it draws a sequence of horizontal lines above and below the Center Line, which are sized based on the most confirmed average true range (ATR) at the selected higher timeframe.
In the top right corner of the chart, there is a table displaying both the selected ATR (in the right cell) and the ATR of the current bar (in the left cell). This feature enables users to compare these two values. It's important to note that the ATR of the current bar may not be confirmed yet, as the market is still active.
_______________________
▋ INDICATOR SETTINGS:
# Section (1): ATR Settings
(1) ATR Period & Smoothing.
(2) Timeframe where ATR value imported from.
(3) To show/hide the table comparison between the current ATR and the ATR for the selected period. Also, ability to color the current ATR cell if it’s greater.
# Section (2): Levels Settings
(1) Selecting a Center Line level among a variety of common levels, which is taken as reference level where a sequence of horizontal lines plot above and below it.
(2) Size of grid in ATR unit.
(3) Number of horizontal lines to plot in a single side.
(4) Grid Side. Ability to plot above or below the Center Line.
(5) Lines colors, and mode.
(6) Line style.
(7) Label style.
(8) Ability to remove old lines, from previous HTF.
_____________________
▋ COMMENT:
The ATR Levels should not be taken as a major concept to build a trading decision.
Please let me know if you have any questions.
Thank you.

Ichimoku OscillatorHello All,
This is Ichimoku Oscillator that creates different oscillator layers, calculates the trend and possible entry/exit levels by using Ichimoku Cloud features.
There are four layer:
First layer is the distance between closing price and cloud (min or max, depending on the main trend)
Second layer is the distance between Lagging and Cloud X bars ago (X: the displacement)
Third layer is the distance between Conversion and Base lines
Fourth layer is the distance between both Leadlines
If all layers are visible maning that positive according to the main trend, you can take long/short position and when main trend changed then you should close the position. so it doesn't mean you can take position when main trend changed, you need to wait for all other conditions met (all layers(
there is take profit partially option. if Conversion and base lines cross then you can take profit partially. Optionally you can take profit partially when EMA line crosses Fourth layer.
Optionally ATR (average true range) is used for Conversion and baseline for protection from whipsaws. you can use it to stay on the trend longer time.
I added options to enable/disable the alert and customize alert messages. You can change alert messages as you wish. if you use ' close ' in the alert message then you can get closing price in the alert message when the alert was triggered.
There is an option Bounce Off Support/Resistance , if there is trend and if the price bounce off Support/Resistance zone then a tiny triangle is shown.
There are many other options for coloring, alerts etc.
Some screenshots:
Main trend:
Taking/closing positions:
Example alert messages:
Bounce off:
Colors:
Colors:
Colors:
Non-colored background:
P.S. For a few months I haven't published any new script because of some health issues. hope to be healthy and create new scripts in 2024 :)
Enjoy!

TrendLine ScythesTrendline Scythes is a script designed to automatically detect and draw special curved trendlines, resembling scythes or blades, based on pivotal points in price action. These trendlines adapt to the volatility of the market, providing a unique perspective on trend dynamics.
🔲 Methodology
Traditional trendlines connect consecutive pivot points on a price chart, providing a linear representation of trend direction. However, this script employs a distinctive methodology by automatically detecting price pivots and then calculating special curved trendlines based on the Average True Range (ATR) of the price. This introduces a curvature to the trendlines, resembling scythes, offering a unique way to interpret market trends.
🔲 Auto Breakout and Target Detection
Trendline Scythes includes features for automatic breakout detection, signaling potential trend changes. Additionally, the script assists in target detection, helping traders set realistic and data-driven profit-taking levels based on market volatility and user adjustment.
🔲 Utility
Trend Confirmation - Use Trendline Scythes to confirm existing trends by observing how price interacts with the curved trendlines.
Breakout Signals - Auto-detection of breakouts adds a proactive element to your trading strategy, helping you stay ahead of potential trend reversals.
Target Setting - Utilize the script to set profit-taking targets based on volatility, aligning with the current market conditions.
🔲 Settings
Pivot Length - Swing detection length
Scythe Length - Adjusts the length of the scythes blade
Sensitivity - Controls how restrained the target calculation is, higher values will result in tighter targets.
🔲 Alerts
Breakout
Breakdown
Target Reached
Target Invalidated
As well as the option to trigger 'any alert' call.
Trendline Scythes is a versatile tool combining the benefits of traditional trendlines with the dynamic adaptability of curved lines for a unique approach to trend analysis.

ATR Based Support and Resistance Zones [UAlgo]🔶 ATR Based Support and Resistance Indicator 🔶
The ATR Based Support and Resistance Indicator is a technical tool designed for TradingView users to analyze and visualize support and resistance levels based on the Average True Range (ATR) indicator. ATR is a widely used volatility indicator that measures the average trading range of an asset over a specified period. This indicator utilizes ATR values to dynamically calculate and display support and resistance zones on the price chart.
🔶 Indicator Settings
ATR Length: This setting allows users to specify the length of the period over which the ATR indicator is calculated. A longer period results in a smoother ATR value, providing a broader view of market volatility.
ATR Multiplier: The ATR multiplier enables users to adjust the sensitivity of the support and resistance zones. Increasing the multiplier widens the zones, while decreasing it narrows them, allowing traders to customize the indicator according to their trading preferences and market conditions.
🔶 Key Features
Trend Identification: The indicator identifies potential support and resistance zones based on the relationship between the ATR values and the price action. When the current ATR value exceeds a certain threshold determined by the ATR multiplier, it indicates a significant price movement, potentially signaling a trend reversal or continuation.
Impulse Detection: The indicator detects impulses in price movement by comparing the current ATR value with the previous value. An impulse is identified when the current ATR value is greater than or equal to the previous value, indicating a sudden surge in market volatility.
Bearish Impulse Example :
Bullish Impulse Example:
Color-Coded Impulses: Impulse candles are color-coded for easy visualization of bullish (green) and bearish (red) impulses. This feature helps traders quickly identify potential trading opportunities and market trends.
Wick Percentage Calculation: The indicator calculates the percentage of the wick length relative to the true range of each candle. Users can specify a threshold percentage, and when the wick percentage exceeds this threshold, it indicates a potential support or resistance zone.
Support and Resistance Zones: The indicator plots support and resistance zones based on the calculated wick percentage. These zones are visualized as rectangular boxes on the price chart, highlighting areas where price reversals or significant price movements are likely to occur.
Customizable Styling: Users can customize the styling of support and resistance zones, including line style, width, border color, and background color. This flexibility allows traders to adapt the indicator's visual appearance to their personal preferences and trading strategies.
🔶 Usage
Traders can utilize the ATR Based Support and Resistance Indicator in various ways :
Trend Direction Analysis: By observing the color-coded impulse candles, traders can identify the prevailing trend direction (bullish or bearish) based on the frequency and magnitude of impulses.
Entry and Exit Signals: Traders can use the detected support and resistance zones as potential entry and exit points for their trades. When price approaches these zones, it may indicate a trading opportunity or signal the need to adjust stop-loss or take-profit levels.
Confirmation Tool: The indicator serves as a confirmation tool for identifying potential reversal or continuation signals in conjunction with other technical indicators or trading strategies.

ATR Percentage ValuesThis indicator is created to give you the daily ATR 2% and 10% values for any product that you are looking at. The way the indicator is designed is to only show the most recent 2 and 10 percent values on any chart and will not show you any other number. If you are hovering over price that occurred in the past it will show zeros on the values. To get the right values, take your mouse off of the chart and it will show you the values.
The way this indicator is coded will give you the daily ATR numbers no matter what chart timeframe you are currently looking at. The idea is to save time and make sure you do not make a mistake getting the wrong value.
*** To make this show up on the status line, click on the settings, click on the style box and check the box "VALUES IN STATUS LINE" ****

ATR Divergences [UAlgo]Divergence is a concept in financial markets that highlights inconsistencies between the price of an asset and a given indicator. This script focuses on identifying divergences using the Average True Range (ATR). Divergence occurs when there is a disparity between the direction of the price and the oscillator, providing valuable insights for traders anticipating potential trend reversals.
This script employs pivot points (with using High-Low values of the candles) to identify potential divergences between the oscillator (ATR) and price movements. Here's how each type of divergence is determined:
Key Features:
Regular Bullish Divergence:
Oscillator registers a higher low.
Price records a lower low.
Indicative of potential upward reversal.
Hidden Bullish Divergence:
Oscillator indicates a lower low.
Price exhibits a higher low.
Signals a concealed bullish continuation pattern.
Regular Bearish Divergence:
Oscillator shows a lower high.
Price marks a higher high.
Suggests a possible downward reversal.
Hidden Bearish Divergence:
Oscillator reflects a higher high.
Price displays a lower high.
Indicates a hidden bearish continuation pattern.
Usage and Customization:
ATR Length: Adjustable parameter for customizing the Average True Range calculation period.
Plot Options: Choose to display Regular Bullish, Hidden Bullish, Regular Bearish, and/or Hidden Bearish divergences.
Wait for Candle Close: Option to wait for candle closure before plotting signals.
How to Interpret:
Regular divergences may indicate potential trend reversals, while hidden divergences suggest a continuation of the current trend. Traders can leverage these signals to make informed decisions in their trading strategies.
Feel free to customize the parameters based on your trading preferences. Happy Trading!

ATR TrendTL;DR - An average true range (ATR) based trend
ATR trend uses a (customizable) ATR calculation and highest high & lowest low prices to calculate the actual trend. Basically it determines the trend direction by using highest high & lowest low and calculates (depending on the determined direction) the ATR trend by using a ATR based calculation and comparison method.
The indicator will draw one trendline by default. It is also possible to draw a second trendline which shows a 'negative trend'. This trendline is calculated the same way the primary trendline is calculated but uses a negative (-1 by default) value for the ATR calculation. This trendline can be used to detect early trend changes and/or micro trends.
How to use:
Due to its ATR nature the ATR trend will show trend changes by changing the trendline direction. This means that when the price crosses the trendline it does not automatically mean a trend change. However using the 'negative trend' option ATR trend can show early trend changes and therefore good entry points.
Some notes:
- A (confirmed) trend change is shown by a changing color and/or moving trendline (up/down)
- Unlike other indicators the 'time period' value is not the primary adjustment setting. This value is only used to calculate highest high & lowest low values and has medium impact on trend calculation. The primary adjustment setting is 'ATR weight'
- Every settings has a tooltip with further explanation
- I added additional color coding which uses a different color when the trend attempts to change but the trend change isn't confirmed (yet)
- Default values work fine (at least in my back testing) but the recommendation is to adjust the settings (especially ATR weight) to your trading style
- You can further finetune this indicator by using custom moving average types for the ATR calculation (like linear regression or Hull moving average)
- Both trendlines can be used to determine future support and resistance zones
- ATR trend can be used as a stop loss finder
- Alerts are using buy/sell signals
- You can use fancy color filling ;)
Happy trading!
Daniel

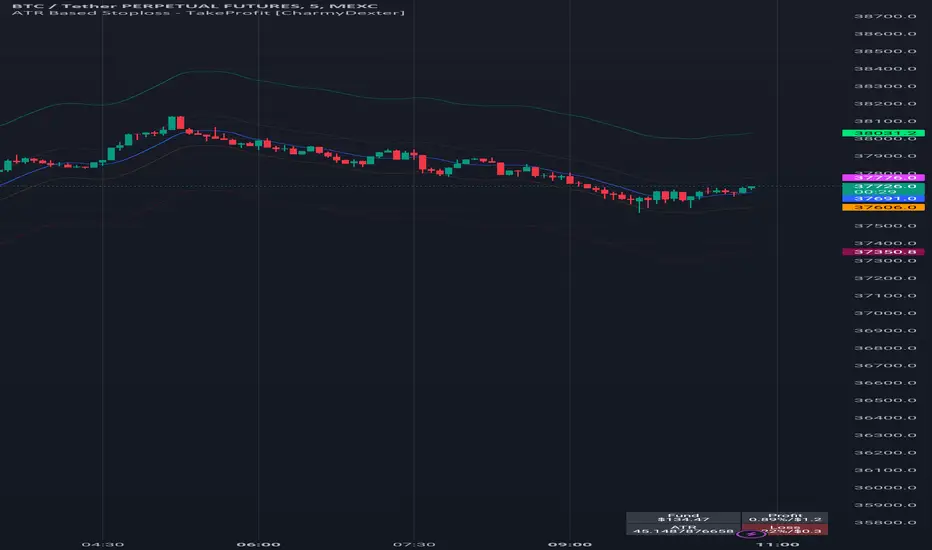
ATR Based Stoploss - TakeProfit [CharmyDexter]
This script combines the power of Average True Range (ATR) and a Moving Average (MA) to dynamically set stop-loss and take-profit levels. It introduces a volatility surge condition and includes a risk management table for comprehensive trade insights.
1) **Originality:**
- This script is original in its approach to combining Average True Range (ATR) with a Moving Average (MA) to create a dynamic stop-loss and take-profit strategy. The addition of a volatility surge condition and the inclusion of a risk management table further contribute to its uniqueness.
2) **Functionality:**
- The script aims to provide traders with a dynamic stop-loss and take-profit strategy based on ATR, incorporating a volatility surge condition and a moving average. The risk management table displays crucial information, including the fund size, potential profit/loss, ATR values, and risk.
3) **Operation:**
- The script uses ATR to calculate volatility, identifying surges in volatility. It adjusts the stop-loss and take-profit levels based on the average of ATR during these surge periods. The moving average acts as a trend indicator, and the script dynamically adjusts stop-loss and take-profit levels accordingly.
4) **Usage:**
- Traders can use this script by applying it to their preferred financial instrument's chart. The script automatically plots the moving average and dynamically adjusts stop-loss and take-profit levels based on ATR and volatility surges. Users can observe the levels on the chart for potential trade management.
5) **Concepts:**
- The script employs concepts of ATR for volatility, moving average for trend identification, and a dynamic adjustment mechanism during volatility surges. Risk management is incorporated by calculating potential profit/loss percentages based on user-defined risk.
6) **Mashup Explanation:**
- The script combines ATR, moving average, and volatility conditions to create a comprehensive strategy. ATR determines the market's volatility, the moving average serves as a trend indicator, and volatility surges trigger dynamic adjustments to stop-loss and take-profit levels. The risk management table enhances the script's utility.
7) **Line Descriptions:**
- Blue Line (Moving Average): Indicates the trend direction.
- Lime Line (Long Take Profit): Represents the level for taking profit in a long position.
- Maroon Line (Short Take Profit): Represents the level for taking profit in a short position.
- Fuchsia Line (Short Stop Loss): Represents the level for setting a stop loss in a short position.
- Orange Line (Long Stop Loss): Represents the level for setting a stop loss in a long position.
8) **Line Usage:**
- Use the blue line for trend identification.
- When taking long positions, the close should be above the blue line.
- For long positions, the lime line is a potential take-profit level, and the orange line is a potential stop-loss level.
- For short positions, the maroon line is a potential take-profit level, and the fuchsia line is a potential stop-loss level.
- The risk management table provides insights into fund size, potential profit/loss, ATR values, and risk.
Note: The profit/loss calculations in this script may not be entirely accurate due to factors like market execution. Market execution may not always occur at the exact levels specified by the script due to slippage or delays in order processing. This can impact the realized profit or loss compared to the calculated levels.
It is crucial to note that this ATR Based Stop-loss - Take-Profit indicator is merely one tool among many that traders can employ to establish trading targets. Additional technical indicators are essential for taking trades and making informed decisions.
Commented-out sections for alerts and shape plotting are provided, allowing for visual and auditory notifications if desired.
It's crucial for traders to be aware of these factors and use the script as a tool within a broader trading strategy. Additionally, regular monitoring and adjustments based on real-time market conditions are recommended to enhance the accuracy of profit/loss assessments.
Anchored Chandelier ExitThe Chandelier Exit is a popular tool among traders used to help determine appropriate stop loss levels. Originally developed by Chuck LeBeau, the Chandelier Exit takes into account market volatility and adjusts the stop loss level dynamically. This indicator builds upon the original Chandelier Exit by allowing the trader to select an anchor date or starting point for the indicator to begin calculating from.
The Original Chandelier Exit
Before we get into the details of the Anchored Chandelier Exit, let's review the original. Essentially a dynamic ATR stop loss, the Chandelier Exit provides a trailing stop that moves higher or lower based on volatility.
The Chandelier Exit is calculated based on the following criteria:
🔶ATR - The ATR is used to measure the volatility of a security over a lookback period. The ATR length determines the number of bars to consider when calculating the average true range. The shorter the length, the more responsive the level will be.
🔶ATR Multiplier - The default multiplier is set to 3. This is used to determine the sensitivity of the Chandelier Exit. The higher the ATR multiplier the wider the stop levels will be. A lower multiplier will tighten stop levels.
🔶Highest / Lowest Points - Determine the highest high (bullish trade) or lowest low (bearish trade) during the lookback period. The default length is 22 bars.
Calculating the Chandelier Exit
Bullish trades - Highest High - ATR * Multiplier
Bearish trades - Lowest Low + ATR * Multiplier
The Anchored Chandelier Exit
The Anchored Chandelier Exit is a new twist on the original, allowing traders to adapt their stop loss levels based on specific market events, levels or bars.
Similar to the original, traders can select the ATR length and multiplier, however, the high or low from which the ATR is subtracted or added is first determined at the anchor bar.
As new bars form, the indicator checks for the previous high/low to be breached. If the high or low is exceeded, the highest/lowest point is updated and the Chandelier Exit is recalculated.
When the indicator is first loaded to your chart, it will ask you to select an anchor bar and choose the bias for the trade.
A bullish (long) bias trade will plot the Chandelier Exit below price action, while a bearish (short) bias trade will plot the Chandelier Exit above price action.
Indicator Features
🔶Custom Start Date
🔶Bullish or Bearish Bias
🔶Selectable ATR Length & Multiplier
🔶Custom Colors
🔶Exit With Close or Wicks
🔶Exit Alerts
With careful parameter optimization, the Anchored Chandelier Exit can be a useful tool for helping traders manage risk based on market volatility.

SuperTrend ToolkitThe SuperTrend Toolkit (Super Kit) introduces a versatile approach to trend analysis by extending the application of the SuperTrend indicator to a wide array of @TradingView's built-in or Community Scripts . This tool facilitates the integration of the SuperTrend algorithm with various indicators, including oscillators, moving averages, overlays, and channels.
Methodology:
The SuperTrend, at its core, calculates a trend-following indicator based on the Average-True-Range (ATR) and price action. It creates dynamic support and resistance levels, adjusting to changing market conditions, and aiding in trend identification.
pine_st(simple float factor = 3., simple int length = 10) =>
float atr = ta.atr(length)
float up = hl2 + factor * atr
up := up < nz(up ) or close > nz(up ) ? up : nz(up )
float lo = hl2 - factor * atr
lo := lo > nz(lo ) or close < nz(lo ) ? lo : nz(lo )
int dir = na
float st = na
if na(atr )
dir := 1
else if st == nz(up )
dir := close > up ? -1 : 1
else
dir := close < lo ? 1 : -1
st := dir == -1 ? lo : up
@TradingView's native SuperTrend lacks the flexibility to incorporate different price sources into its calculation.
Community scripts, addressed the limitation by implementing the option to input different price sources, for example, one of the most popular publications, @KivancOzbilgic's SuperTrend script.
In May 2023, @TradingView introduced an update allowing the passing of another indicator's plot as a source value via the input.source() function. However, the built-in ta.atr function still relied on the chart's price data, limiting the formerly mentioned scripts to the chart's price data alone.
Unique Approach -
This script addresses the aforementioned limitations by processing the data differently.
Firstly we create a User-Defined-Type (UDT) replicating a bar's open, high, low, close (OHLC) values.
type bar
float o = open
float h = high
float l = low
float c = close
We then use this type to store the external input data.
src = input.source(close, "External Source")
bar b = bar.new(
nz(src ) , open 𝘷𝘢𝘭𝘶𝘦
math.max(nz(src ), src), high 𝘷𝘢𝘭𝘶𝘦
math.min(nz(src ), src), low 𝘷𝘢𝘭𝘶𝘦
src ) close 𝘷𝘢𝘭𝘶𝘦
Finally, we pass the data into our custom built SuperTrend with ATR functions to derive the external source's version of the SuperTrend indicator.
supertrend st = b.st(mlt, len)
- Setup Guide -
Utility and Use Cases:
Universal Compatibility - Apply SuperTrend to any built-in indicator or script, expanding its use beyond traditional price data.
- A simple example on one of my own public scripts -
Trend Analysis - Gain additional trend insights into otherwise mainly mean reverting or volume indicators.
- Alerts Setup Guide -
The Super Kit empowers traders and analysts with a tool that adapts the robust SuperTrend algorithm to a myriad of indicators, allowing comprehensive trend analysis and strategy development.

Logical Trading Indicator V.1Features of the Logical Trading Indicator V.1
ATR-Based Trailing Stop Loss
The Logical Trading Indicator V.1 utilizes the Average True Range (ATR) to implement a dynamic trailing stop loss. You can customize the sensitivity of your alerts by adjusting the ATR Multiple and ATR Period settings.
Higher ATR Multiple values create wider stops, while lower values result in tighter stops. This feature ensures that your trades are protected against adverse price movements. For best practice, use higher values on higher timeframes and lower values on lower term timeframes.
Bollinger Bands
The Logical Trading Indicator V.1 includes Bollinger Bands, which can be customized to use either a Simple Moving Average (SMA) or an Exponential Moving Average (EMA) as the basis.
You can adjust the length and standard deviation multiplier of the Bollinger Bands to fine-tune your strategy. The color of the basis line changes to green when price is above and red when price is below the line to represent the trend.
The bands show a range vs a single band that also represents when the price is in overbought and oversold ranges similar to an RSI. These bands also control the take profit signals.
You also have the ability to change the band colors as well as toggle them off, which only affects the view, they are still active which will still fire the take profit signals.
Momentum Indicator
Our indicator offers a momentum filter option that highlights market momentum directly on the candlesticks, identifying periods of bullish, bearish, or consolidation phases. You can enable or disable this filter as needed, providing valuable insights into market conditions.
By default, you will see the candlestick colors represent the momentum direction as green or red, and consolidation periods as white, but the filter on the BUY and SELL signals is not active. The view options and filter can be toggled on and off in the settings.
Buy and Sell Signals
The Logical Trading Indicator V.1 generates buy and sell signals based on a combination of ATR-based filtering, Bollinger Band basis crossover, and optional momentum conditions if selected in the settings. These signals help you make informed decisions about when to enter or exit a trade. You can also enable a consolidation filter to stay out of trades during tight ranges.
Basically a BUY signal fires when the price closes above the basis line, and the price meets or exceeds the ATR multiple from the previous candle length, which is also editable in the settings.
If the momentum filter is engaged, it will not fire BUY signals when in consolidation periods. It works just the opposite for SELL signals.
Take Profit Signals
We've integrated a Take Profit feature that helps you identify points to exit your trades with profits. The indicator marks Long Take Profit when prices close below the upper zone line of the Bollinger Bands after the previous candle closes inside the band, suggesting an optimal point to exit a long trade or consider a short position.
Conversely, Short Take Profit signals appear when prices close above the lower zone after the previous candle closes inside of it, indicating the right time to exit a short trade or contemplate a long position.
Alerts for Informed Trading
The Logical Trading Indicator V.1 comes equipped with alert conditions for buy signals, sell signals, take profit points, and more. Receive real-time notifications to your preferred devices or platforms to stay updated on market movements and trading opportunities.

Standardized SuperTrend Oscillator
The Standardized SuperTrend Oscillator (SSO) is a versatile tool that transforms the SuperTrend indicator into an oscillator, offering both trend-following and mean reversion capabilities. It provides deeper insights into trends by standardizing the SuperTrend with respect to its upper and lower bounds, allowing traders to identify potential reversals and contrarian signals.
Methodology:
Lets begin with describing the SuperTrend indicator, which is the fundamental tool this script is based on.
SuperTrend:
The SuperTrend is calculated based on the average true range (ATR) and multiplier. It identifies the trend direction by placing a line above or below the price. In an uptrend, the line is below the price; in a downtrend, it's above the price.
pine_st(float src = hl2, float factor = 3., simple int len = 10) =>
float atr = ta.atr(len)
float up = src + factor * atr
up := up < nz(up ) or close > nz(up ) ? up : nz(up )
float lo = src - factor * atr
lo := lo > nz(lo ) or close < nz(lo ) ? lo : nz(lo )
int dir = na
float st = na
if na(atr )
dir := 1
else if st == nz(up )
dir := close > up ? -1 : 1
else
dir := close < lo ? 1 : -1
st := dir == -1 ? lo : up
SSO Oscillator:
The SSO is derived from the SuperTrend and the source price. It calculates the standardized difference between the SuperTrend and the source price. The standardization is achieved by dividing this difference by the distance between the upper and lower bounds of the SuperTrend.
float sso = (src - st) / (up - lo)
Components and Features:
SuperTrend of Oscillator - An additional SuperTrend based on the direction and volatility of the oscillator, behaving as the SuperTrend OF the SuperTrend. This provides further trend analysis of the underlying broad trend regime.
Reversion Tracer - The RSI of the direction of the original SuperTrend, providing a dynamic threshold for premium and discount price areas.
float rvt = ta.rsi(dir, len)
Heikin Ashi Transform - An option to apply the Heikin Ashi transform to the source price of the oscillator, providing a smoother visual representation of trends.
Display Modes - Choose between Line mode for a standard oscillator view or Candle mode, displaying the oscillator as Heikin Ashi candles for more in-depth trend analysis.
Contrarian and Reversion Signals:
Contrarian Signals - Based on the SuperTrend of the oscillator, these signals can act as potential buy or sell indications, highlighting potential trend exhaustion or premature reversals.
Reversion Signals - Generated when the oscillator crosses above or below the Reversion Tracer, signaling potential mean reversion opportunities or trend breakouts.
Utility and Use Cases:
Trend Analysis - Utilize the SSO as a trend-following tool with the added benefits of the oscillator's SuperTrend and Heikin Ashi transform.
Valuation Analysis - Leverage the oscillator's reversion signals for identifying potential mean reversion opportunities in the market.
The Standardized SuperTrend Oscillator enhances the capabilities of the SuperTrend indicator, offering a balanced approach to both trend-following and mean reversion strategies. Its customizable options and contrarian signals make it a valuable instrument for traders seeking comprehensive trend analysis and potential reversal signals.

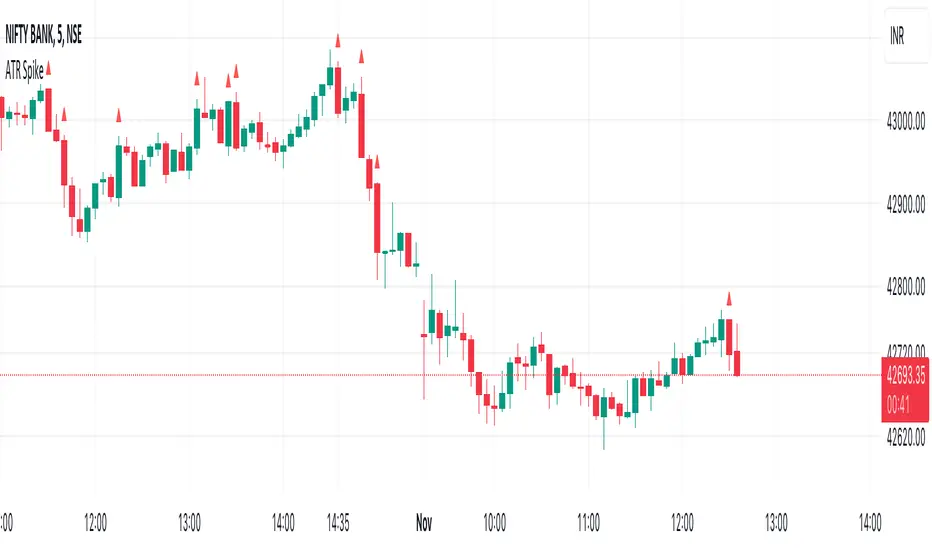
ATR SpikeALWAYS TRADE THE DIRECTION OF THE TREND
This indicator is useful for 5-minute Bank Nifty intraday trading.
It compares the Open-Close value for a 5-minute bar with the current ATR value.
When a bar has higher than the ATR value then it means that the current bar has a higher Open-Close than the ATR.
This means that after a period of dull action, some action has taken place.
And more action will follow in the direction of the immediate trend.
It signals the start of momentum which I look for as a intraday trader.
Feel free to experiment and change values as it suits you.
I use it on Bank Nifty only on 5 minute timeframe with 14 period ATR.
[Spinn] Average True RangeThe "Average True Range" indicator is a popular tool that measures price volatility. In this modified indicator, I present two methods of calculating ATR: the outdated classical one based on RMA (EMA, SMA, WMA), and the modernized one using the Super Smoother filter.
Why has exponential smoothing become outdated?
Exponential smoothing (EMA) has drawbacks, especially when it comes to identifying cyclical components in the data (and RMA is a variant of EMA). EMA creates phase shifts and distortions, making it less predictable and accurate in tracking real price movements. Modern filters, such as Super Smoother, offer a higher degree of adaptability and precision while ensuring significantly less lag, better smoothness, and superior cycle detection.
Why use more contemporary filters like Super Smoother?
The Super Smoother filter combines exponential smoothing and trigonometric functions for more accurate and smooth tracking of price movements. This filter enhances cycle tracking and reduces the lag often found when using EMA. As a result, signals based on Super Smoother are often more precise and representative of real price movements.
Drawbacks of other smoothing filters commonly used with ATR:
SMA. The lag is (N-1)/2, where N = period. This is terrible.
WMA. According to John F. Ehlers, "It appears that the WMA was invented by a trader who did not have a firm grasp of filter theory in hopes of reducing lag". It has been proven that WMA has worse suppression than the equivalent SMA, and WMA has more delay in the passband than the equivalent EMA. In short, WMA has drawbacks but no advantages compared to other popular moving averages.
It is also a good idea to use the median to average the results.
Test, experiment, use!

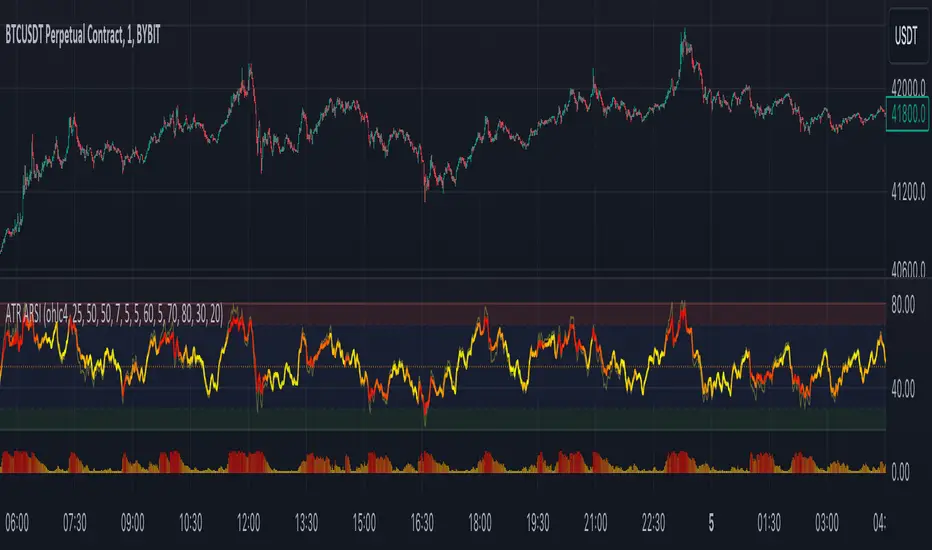
ATR Adaptive RSI OscillatorThe " ATR Adaptive RSI Oscillator " is a versatile technical analysis tool designed to help traders make informed decisions in dynamic market conditions. It combines the Relative Strength Index (RSI) with the Average True Range (ATR) to provide adaptive and responsive insights into price trends.
Key Features :
Adaptive RSI Periods : The indicator introduces the concept of adaptive RSI periods based on the ATR (Average True Range) of the market. When enabled, it dynamically adjusts the RSI calculation period, offering longer periods during high volatility and shorter periods during low volatility. This adaptability enhances the accuracy of RSI signals across varying market conditions.
Volume-Based Smoothing : The indicator includes a smoothing feature that computes a time-decayed weighted moving average of RSI values over the last two bars, using volume-based weights. This approach offers a time-sensitive smoothing effect, reducing noise for a clearer view of trend strength compared to the standard RSI.
Divergence Detection : Traders can enable divergence detection to identify potential reversal points in the market. The indicator highlights regular bullish and bearish divergences, providing valuable insights into market sentiment shifts.
Customizable Parameters : Traders have the flexibility to customize various parameters, including RSI length, adaptive mode, ATR length, and divergence settings, to tailor the indicator to their trading strategy.
Overbought and Oversold Levels : The indicator includes overbought (OB) and oversold (OS) boundary lines that can be adjusted to suit individual preferences. These levels help traders identify potential reversal zones.
The "ATR Adaptive RSI Oscillator" is a powerful tool for traders seeking to adapt their trading strategies to changing market dynamics. Whether you're a trend follower or a contrarian trader, this indicator provides valuable insights to support your decision-making process.
TTP SuperTrend ADXThis indicator uses the strength of the trend from ADX to decide how the SuperTrend (ST) should behave.
Motivation
ST is a great trend following indicator but it's not capable of adapting to the trend strength.
The ADX, Average Directional Index measures the strength of the trend and can be use to dynamically tweak the ST factor so that it's sensitivity can adapt to the trend strength.
Implementation
The indicator calculates a normalised value of the ADX based on the data available in the chart.
Based on these values ST will use different factors to increase or reduce the factor use by ST: expansion or compression.
ST expansion vs compression
Expanding the ST would mean that the stronger a trends get the ST factor will grow causing it to distance further from the price delaying the next ST trend flip.
Compressing the ST would mean that the stronger a trends get the ST factor will shrink causing it to get closer to the price speeding up the next ST trend flip.
Features
- Alerts for trend flip
- Alerts for trend status
- Backtestable stream
- SuperTrend color gets more intense with the strength of the trend

Advanced Weighted Residual Arbitrage AnalyzerThe Advanced Weighted Residual Arbitrage Analyzer is a sophisticated tool designed for traders aiming to exploit price deviations between various asset pairs. By examining the differences in normalized price relations and their weighted residuals, this indicator provides insights into potential arbitrage opportunities in the market.
Key Features:
Multiple Relation Analysis: Analyze up to five different asset relations simultaneously, offering a comprehensive view of potential arbitrage setups.
Normalization Functions: Choose from a variety of normalization techniques like SMA, EMA, WMA, and HMA to ensure accurate comparisons between different price series.
Dynamic Weighting: Residuals are weighted based on their correlation, ensuring that stronger correlations have a more pronounced impact on the analysis. Weighting can be adjusted using several functions including square, sigmoid, and logistic.
Regression Flexibility: Incorporate linear, polynomial, or robust regression to calculate residuals, tailoring the analysis to different market conditions.
Customizable Display: Decide which plots to display for clarity and focus, including normalized relations, weighted residuals, and the difference between the screen relation and the average weighted residual.
Usage Guidelines:
Configure the asset pairs you wish to analyze using the Symbol Relations group in the settings.
Adjust the normalization, volatility, regression, and weighting functions based on your preference and the specific characteristics of the asset pairs.
Monitor the weighted residuals for deviations from the mean. Larger deviations suggest stronger arbitrage opportunities.
Use the difference plot (between the screen relation and average weighted residual) as a quick visual cue for potential trade setups. When this plot deviates significantly from zero, it indicates a possible arbitrage opportunity.
Regularly update and adjust the parameters to account for changing market conditions and ensure the most accurate analysis.
In the Advanced Weighted Residual Arbitrage Analyzer , the value set in Alert Threshold plays a crucial role in delineating a normalized band. This band serves as a guide to identify significant deviations and potential trading opportunities.
When we observe the plots of the green line and the purple line, the Alert Threshold provides a boundary for these plots. The following points explain the significance:
Breach of the Band: When either the green or purple line crosses above or below the Alert Threshold , it indicates a significant deviation from the mean. This breach can be interpreted as a potential trading signal, suggesting a possible arbitrage opportunity.
Convergence to the Mean: If the green line converges with the purple line , it denotes that the price relation has reverted to its mean. This convergence typically suggests that the arbitrage opportunity has been exhausted, and the market dynamics are returning to equilibrium.
Trade Execution: A trader can consider entering a trade when the lines breach the Alert Threshold . The return of the green line to align closely with the purple line can be seen as a signal to exit the trade, capitalizing on the reversion to the mean.
By monitoring these plots in conjunction with the Alert Threshold , traders can gain insights into market imbalances and exploit potential arbitrage opportunities. The convergence and divergence of these lines, relative to the normalized band, serve as valuable visual cues for trade initiation and termination.
When you're analyzing relations between two symbols (for instance, BINANCE:SANDUSDT/BINANCE:NEARUSDT ), you're essentially looking at the price relationship between the two underlying assets. This relationship provides insights into potential imbalances between the assets, which arbitrage traders can exploit.
Breach of the Lower Band: If the purple line touches or crosses below the lower Alert Threshold , it indicates that the first symbol (in our example, SANDUSDT ) is undervalued relative to the second symbol ( NEARUSDT ). In practical terms:
Action: You would consider buying the first symbol ( SANDUSDT ) and selling the second symbol ( NEARUSDT ).
Rationale: The expectation is that the price of the first symbol will rise, or the price of the second symbol will fall, or both, thereby converging back to their historical mean relationship.
Breach of the Upper Band: Conversely, if the difference plot touches or crosses above the upper Alert Threshold , it suggests that the first symbol is overvalued compared to the second. This implies:
Action: You'd consider selling the first symbol ( SANDUSDT ) and buying the second symbol ( NEARUSDT ).
Rationale: The anticipation here is that the price of the first symbol will decrease, or the price of the second will increase, or both, bringing the relationship back to its historical average.
Convergence to the Mean: As mentioned earlier, when the green line aligns closely with the purple line, it's an indication that the assets have returned to their typical price relationship. This serves as a signal for traders to consider closing out their positions, locking in the gains from the arbitrage opportunity.
It's important to note that when you're trading based on symbol relations, you're essentially betting on the relative performance of the two assets. This strategy, often referred to as "pairs trading," seeks to capitalize on price imbalances between related financial instruments. By taking opposing positions in the two symbols, traders aim to profit from the eventual reversion of the price difference to the mean.
