Saty ATR LevelsThis indicator uses the previous period close and +/- 1 ATR to display significant day, multiday, swing, and position trading levels including:
- Trigger clouds for possibly going long/short @ 23.6 fib
- Mid-range level at 61.8 fib
- Full range level at +/- 1 ATR (from previous close)
- Extension level at 161.8 fib
Additionally, a convenient info table is provided that shows trend, range utilization, and numerical long/short values.
This indicator is most beneficial when you combine it with price, volume, and trend analysis. For educational content please check out the indicator website at atrlevels.com.
I am constantly improving this indicator, please use this one if you want to continue to get new features, bug fixes, and support.
ATR

SuperJump Turn Back Bollinger BandThis is a simple indicator using bolinger band return.
After the candle's bolinger band broke out,
Turn back inside BB is the entry point.
Usually there are more than two triangles, so you can wait after ordering a better price.
As you already know about it, it is very dangerous for the bolinger band to enter in the reverse direction when a strong trend is created.
That's why I made the Red Line. It is calculated by ATR and will suggest you an appropriate StopLoss value.

SuperTrend OptimizerHello!
This indicator attempts to optimize Supertrend parameters. To achieve this, 102 parameter combinations are tested concurrently - the top three performers are listed in descending order.
Parameters,
Factor: Changes to this parameter shifts the tested factor range. For instance, increasing the factor measure from 3.00 to 3.01 (+0.01) will remove 3.00 from the tested range - this setting controls the lower threshold of the range. The upper threshold, in all instances, is the lower Factor threshold + 3.3 (i.e. 3.0(lower) - 6.3(upper), 4.0(lower) - 7.3(upper), 2.5(lower) - 5.8(upper))
ATR period: Changes to this parameter shifts the tested ATR period range. For instance, increasing the ATR measure from 10 to 11 (+1) will remove 10 from the tested range - this setting controls the lower threshold of the range. The upper threshold, in all instances, is the lower threshold + 2 (i.e. 10(lower) - 12(upper), 11(lower) - 13(upper), 9(lower), - 11(upper))
The Factor parameter is modifiable to any positive decimal number; the ATR parameter is modifiable to any positive integer. Changing either parameter shifts the tested parameter combination range. Both parameters can be changed in the settings, to which you control the lower threshold of the range. If, for instance, you were to change the Factor measurement from 3.0 to 4.1 (+1.1) the 4.0 Factor measurement, and all Factor measures less than 4.0, will be excluded from the performance test.
Consequently, a Supertrend test will be performed with a Factor of 4.1 and an ATR period of 10 (default). This test repeats at 0.1 Factor intervals and 1.0 ATR intervals.
Therefore, assume you modify the Factor lower threshold to 3.1 and the ATR lower threshold to 10. The indicator will test three Supertrend systems with a Factor of 3.1 and an ATR period of 10.. then 11.. 12, then three systems with a Factor of 3.2 and an ATR period of 10.. then 11.. 12... until (lower Factor threshold + 3.3) and (lower ATR threshold + 2) are tested... which in this example is... a Factor of 6.4 and an ATR period of 12.
The tested Factor range and ATR range are displayed in a bottom right table alongside the top performing parameter combinations.
Of course, you can change the the lower thresholds, which means you can test numerous Supertrend parameter combinations! However, no greater than 102 parameter combinations will be tested simultaneously; the best performing Supertrend parameters are plotted on the chart automatically.
I will be working on this indicator more tomorrow! Let me know if you have questions or anything you would like included!
(I of course added something fun in the script. Be sure to try it with bar replay!)

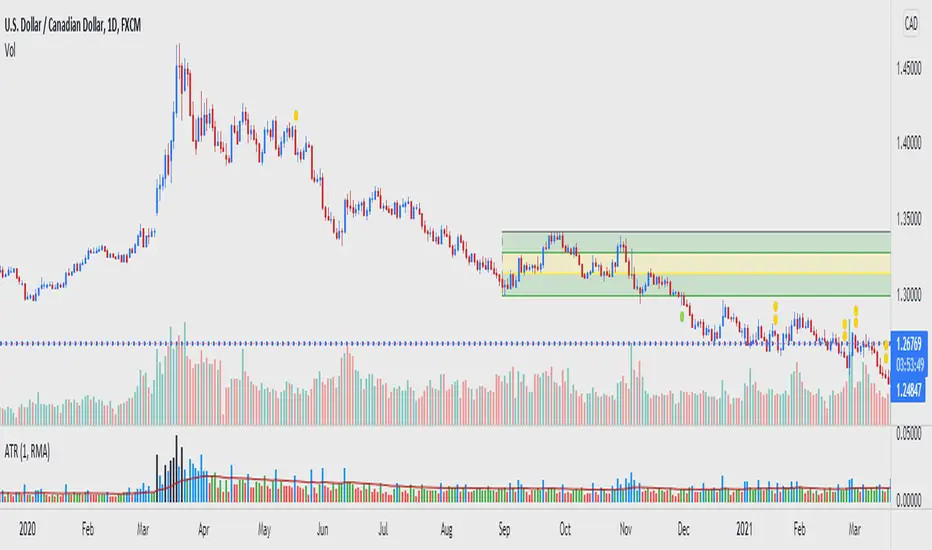
ATR Trading SetupThis simple script base on function of ATR Trailing Stop (aka SuperTrend) to plot Trading Setup on chart with detail as below:
1. Type of Average True Range (ATR)
+ The function calculate ATR may base on 1 of 3 type of Average: RMA, SMA, EMA
2. Trading Setup
2.1 Long setup
+ SuperTrend is upTrend
+ Entry Long at (or below) last value ATR Trailing Stop of Previous Trend (DownTrend)
+ Stop loss at first value ATR Trailing Stop of now Trend (upTrend)
+ Take profit at first value ATR Trailing Stop of Previous Trend (downTrend)
+ Move stop loss follow ATR Trailing Stop (green dot)
2.1 Short setup
+ SuperTrend is downTrend
+ Entry Short at (or above) last value ATR Trailing Stop of Previous Trend (upTrend)
+ Stop loss at first value ATR Trailing Stop of now Trend (downTrend)
+ Take profit at first value ATR Trailing Stop of Previous Trend (upTrend)
+ Move stop loss follow ATR Trailing Stop (red dot)

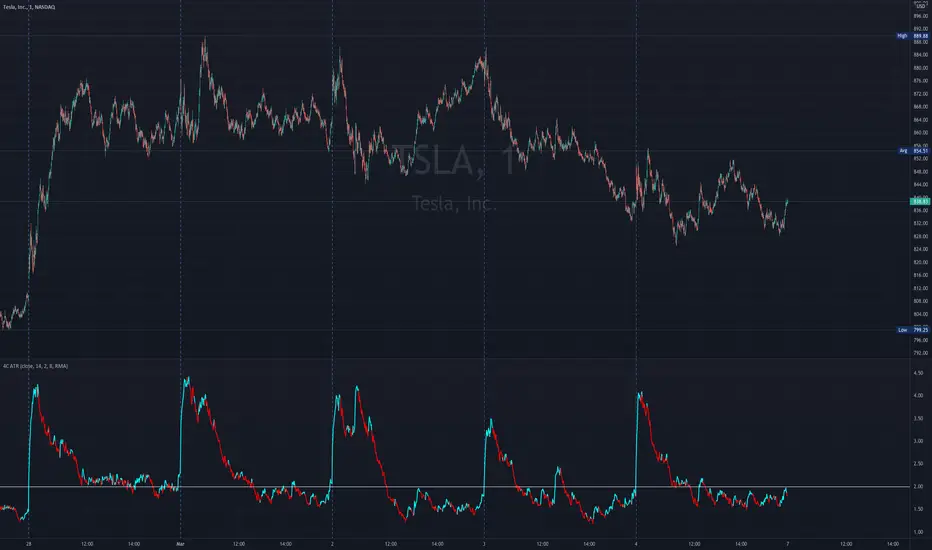
4c ATR ThresholdThe 4C ATR Threshold is a simple indicator that paints the chart background red when the ATR goes below the user defined ATR minimum.
Some trading setups have specific criteria that require a minimum ATR on a certain timeframe for the instrument to be playable.
The painting of the chart background based on the ATR value is useful as a quick visual reference.
The minimum ATR value can be adjusted to any specific level for any timeframe.
If the ATR dips below the user defined minimum, the trader can quickly see that the ATR is below the minimum criteria, and should not trade that instrument (based on their personal trade criteria).
If the background is not painted by the indicator, then the ATR is above the user defined minimum.
Parts of this script used the default/stock Tradingview ATR indicator to build from.
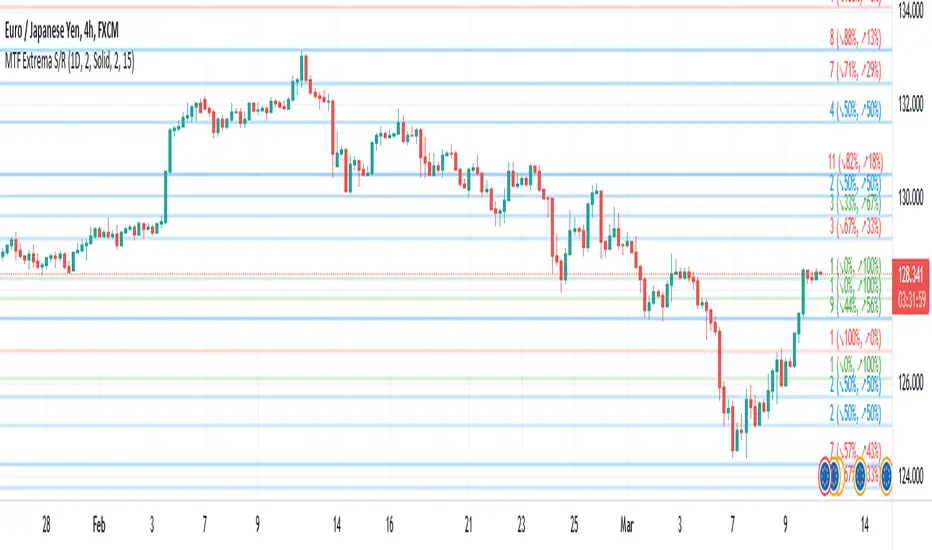
Multi-TimeFrame Extremum Points Support/ResistanceIntroduction
This is my newest Support/Resistance indicator based on the idea of my previous script which had been featured in Editors' Picks .
Everyone seems to have their own idea of how you should measure support and resistance levels. This code finds the exact highest and lowest price points (Extrema) on the chart and then draws the support and resistance levels on them.
In my opinion, the advantage of this method is that the most powerful resistance/support levels which usually cover the supply/demand areas would be formed on these extremum points, as the following facts state.
Facts
1. Support and resistance levels are one of the key concepts used by technical analysts and form the basis of a wide variety of technical analysis tools. Technical analysts use support and resistance levels to identify price points on a chart where the probabilities favor a pause or reversal of a prevailing trend.
2. Supply and demand zones are natural support and resistance levels and a popular analysis technique used in day trading. The zones are the periods of sideways price action that come before explosive price moves. A supply zone forms before a downtrend and a demand zone forms before an uptrend. When the price leaves the supply/demand zone and starts trending, the strong imbalance between buyers and sellers leads to strong and explosive price movements.
3. Based on Dow Theory, trends persist until a clear reversal occurs. A reversal is a change in the price direction of an asset. Reversals typically refer to large price changes, where the trend changes direction.
Challenges
The most challenging part in implementing a S/R indicator which draws all the levels on the chart is the problem of congestion!
But we should notice two other facts:
1. The more times the price tests a support or resistance area, the more significant the level becomes.
2. A previous support level will sometimes become a resistance level when the price attempts to move back up, and conversely, a resistance level will become a support level as the price temporarily falls back.
So, I solved the problem using these two approaches:
Merging nearby levels and showing the role of the levels in colors and numbers
Avoiding many weaker levels by checking higher time frames
Settings and Usage
There are some options in the indicator settings as described below:
Calculations Time Frame: By changing the time frame, user could keep only the stronger S/R levels on the chart.
Level Colors: By default, lowest points (Supports) are green, highest points (Resistances) are red and merged levels are blue. Note that the transparency of the colors would be calculated automatically; The more opaque the color is, the stronger the level is!
Lines Style and Width: The style of the levels could be solid, dashed or dotted and user could also change the lines width in pixels.
Length of the lines: This option is based on the count of bars, but user could simply choose to extend the levels
Merge Nearby Levels: The proximity of the levels would be calculated automatically based on ATR (Average True Range) and the default length of the formula could be changed.
Labels: Each level could have a label consisting the count of merged levels into one, the percentage of merged supports/resistances and the price of the level. Note that if user choose to see the percentage of S/R roles, the color of each label changes automatically based on the main role of corresponding merged level (e.g., a blue level with a red label means that the level more acted as resistance).
I think the users of my previous S/R indicators could check this one
That's it for now! Feel free to send me your thoughts!
4C ATR w/ Reference LineThe 4C ATR is a simple indicator that plots a horizontal line on the ATR indicator, which can be used as a minimum or maximum reference value.
Some trading setups have specific criteria that require a minimum ATR on a certain timeframe for the instrument to be playable. The horizontal line is useful as a quick visual reference, and can be adjusted to any specific level for any timeframe. If the ATR dips below the horizontal line, the trader can quickly see that the ATR is below the minimum criteria, and should not trade that instrument (based on their personal trade criteria).
This indicator also features a color change of the ATR line based on trend direction. If the ATR is trending up, it is painted blue, and if it starts to trend down, it is painted red. It uses a hidden simple moving average of the ATR, and the slope direction of the moving average paints the ATR line. The moving average length can be adjusted, and is set at a length of 8 for default. The ATR is set at a default value of 14.
Parts of this script used the default/stock Tradingview ATR indicator to build off of.
[BA] ATR Stop LineThis indicator helps you to set your stoploss levels by using ATR. Traders often use atr values in order to calculate their stoploss levels.
This indicator does the calculation for you and draw two tiny lines without messing up the chart so that you can easily see your stoploss levels and get an idea about the volatility and risk amount as well.
One line is below the last candle as a long trade stop loss level and the other one is above the last candle as a short trade stop loss level.
Calculation is simple:
For short trades, 2 times ATR added to last price;
For long trades, 2 times ATR subtracted from last price.
You can change ATR length, ATR multiplier and the line length.
Good luck.

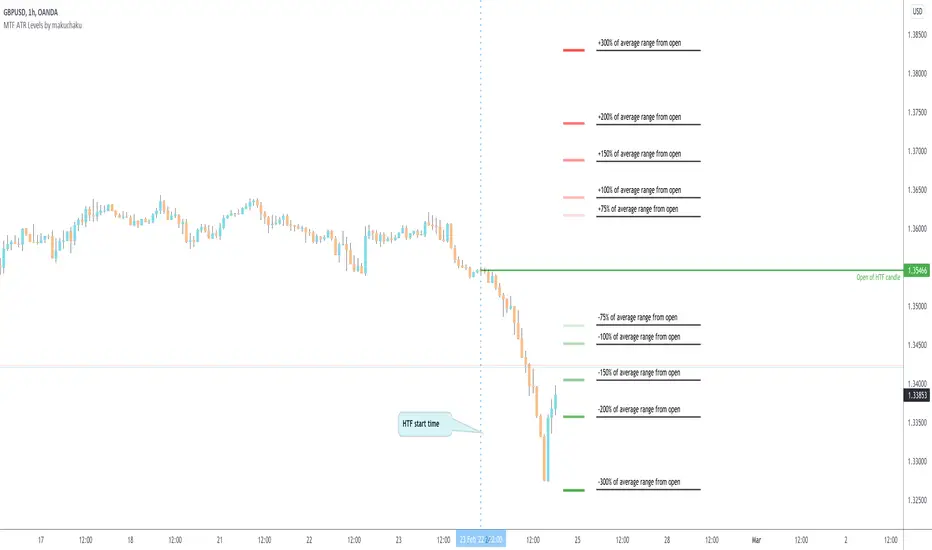
MTF ATR Levels by makuchakuKnowing how big a range one is operating in (from a higher time frame perspective) is very important to understand where the reversals could potentially come from.
This indicator uses the closing price of previous HTF candle and plots its ATR range - and several levels on top of it.
+/- 75%
+/- 100%
+/- 150%
+/- 200%
+/- 300%
Flat Detect By Bollinger BandsThis simple script indicate the potential flat market zones, calculated based on the Bollinger Bands width.
It's showing the Bollinger Bands in red when the market is detected as flat.
You can adjust the Width Threshold with precision on the inputs settings.
Enjoy :)

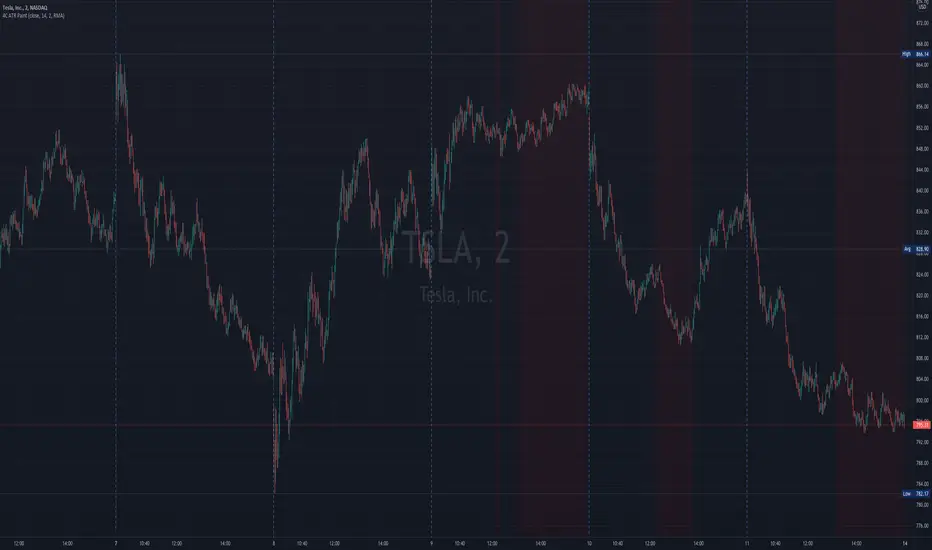
Bar By Bar ATR [upslidedown]After seeing strategy after strategy refer to calculating ATR values using a "calculator" (how barbaric!), I thought I'd take a stab at one possible solution to the "problem" as an overlay indicator on the main chart that replaces traditional standard ATR bands. This indicator presents ATR within a channel with a slick trick: invisible hover-able tooltips for you to know the ATR value for your strategy from bar to bar. Just zoom in and hover over the high ATR range and you'll see take profit and stop loss values for whatever strategy you might be running. I defaulted the indicator to a 1:1.5 ATR standard setup because that is good for many strategies but this is as configurable as you'd like to make it. One notable improvement for this indicator over standard ATR bands is that many existing ATR bands only use integers and this one uses a float value, so you can endlessly customize based on whatever strategy you might be running.
Note: Because labels are limited by default, the best way to historically see ATR values is to use TV's replay feature. I did this on purpose to limit resource usage. One could certainly print more labels but I felt it unnecessary to go beyond the default number of labels.

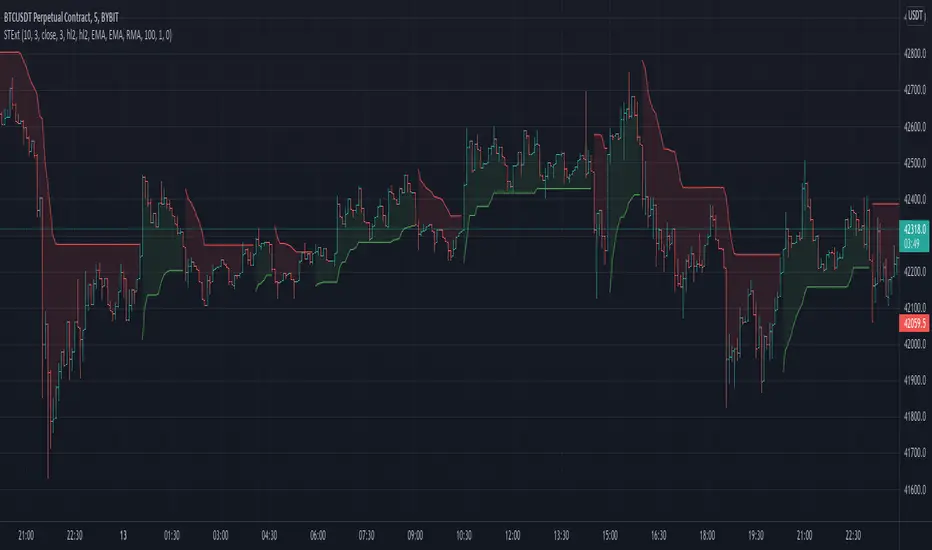
Supertrend Ext1st it exactly looks like the original Supertrend indicator. But if you see the options, you can see it is totally different:
It uses my other indicator inside: Zero Lag Keltner Channels, so you can use smoothed ATR bands for calculation instead of the raw ATR. By default it's length is 1 so it works like the original Supertrend.
You can choose different sources and moving averages for Keltner Channel calculation
It can filter outliers in ATR calculation
The indicator code is in my TAExt library, so it can easily be used in custom strategies.
Average True Range (VStop) Cloud SignalsThis indicator extends the built-in Volatility Stop indicator to a visual signals type indicator based on the crossover of a small VStop value (default 1.5x ATR) and a larger VStop value (default 3x ATR). The two values form a "cloud" with default coloring based on RSI/strength of trend.

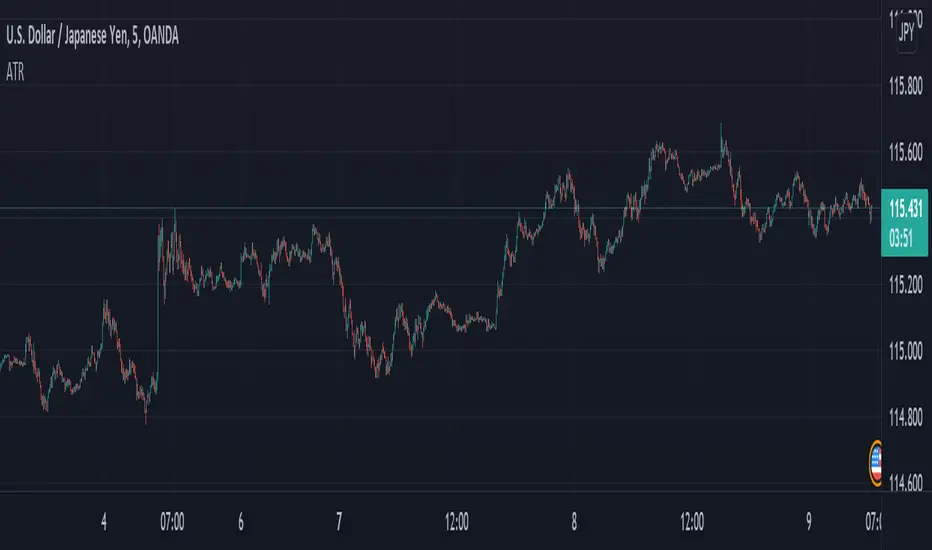
Minimalistic ATRI have a thing for efficiency, as I'm sure many of you do as well. One could say we are minimalist. As such, wasting precious chart space is absolutely unacceptable. Such precious commodity should only be used for things that are pleasing to the eye and mind. This minimalistic ATR filter will give you all the functions a regular ATR provide, without all the clutter of plotting on the chart. Enjoy
The height of cultivation always runs to simplicity.
ATR TREXTry to visualize TREX method.
-4 types of candle based on TR :
1. Spinning ( Candle < 0.8*ATR )
2. Standard ( 0.8*ATR < Candle < 1.2*ATR )
3. Long bar ( 1.2*ATR < Candle < 2.5*ATR )
4. Spike ( 2.5*ATR < Candle )
ATR length is different base on FRACTAL timeframes.
you can now find what is type of candle as colored ATR.
-Time frames :
1 Min
5 Min
15 Min
1 Hour
4 Hour
1 Day
1 Week
1 Month
I am working on TREX method and this indicator will change and improve . (V1.0)
Br
Amin
CHOPperIt is based on the Choppiness Index indicator. It can show you when the market is in range. If the lines are below the lower band, it can be a strong trend, if it is inside the 2 bands, it is considered to be a choppy market, and if it is crossed down the upper band, it can be a developing trend.
This indicator does not show you the trend direction! This may be used as a confirmation indicator.
The improvements this indicator provides over the original:
It uses ATR instead of just TR (if ATR length is 1, it is the original TR)
It uses my ATRWO (ATR Without Outliers) indicator inside, which can remove extreme highs and lows from calculation. You can tune this by the "ATRWO STDev Mult" parameter. Higher value means more outliers are allowed.
It has 2 lines, one uses ATR(WO) (the blue one), which can be similar to the original Choppiness Index, the other uses standard deviation (the teal one).
The 2 lines can be used together, or you can hide one of them.

ATR vs Day Trading Range and PercentageThis indicator displays the Current Daily ATR vs the current Day Range and displays the percentage.
For example if the Daily ATR is $5 and the current range of the day is $10 this would be 200% the original move.
It is color coded (and can be modified) to change color when the Daily range is over 100% the ATR.
The time frame can be changed from Daily just be aware you must be on a lower timeframe then selected. So if you want to compare the current 30 minute ATR to the current 30 minute range you will need to be showing a 30 min chart or lower for it to calculate correctly.

ATR Position Size AutomationAll you have to fill out is your account balance, the % amount of your account you want to risk, and the percentage of ATR you want calculated. If you have 100% it will do a full ATR calculation. So if the ATR is $2 then your risk per share would be $2. If you had 50% in the same example it would be risking $1 per share.
You can also customize what time frame you want the ATR to be calculating off of. Just be aware the calculation will only be right if you are showing a lower time frame on your chart then the one selected on the indicator. (If you are calculating a daily dont be on a weekly chart. You have to be on a Daily or lower)
You can select what boxes you want displayed and if you want the ATR lines on the chart.

Average True Range (ATR) invisible price markers / linesThis script provides the ATR price when added to the top and bottom of the currently hovered candle.
The prices are shown top left next to the indicators' name.
This means you do not have to manually subtract or add ATR to price.
Line opacity allows you to show the lines where the ATR is, however, I recommend to keep this disabled.
Line type allows you to choose where ATR is calculated from (LowHigh or LowHighBody), the second ignoring the wicks, however LH is standard.
I also recommend to keep the other parameters as default.
I hope this indicator provides useful to you and your trading.

Buy / Sell alert indicator [Crypto_BCT]Hello everyone!
I bring to your attention a indicator to determine the point of buy and sell purchase.
It is based on oscillators and a moving average.
It can be used to work with bots, for example 3COMMAS DCA bot.
Signal Condition Settings:
ATR
The current candle is larger than the ATR for this period
EMA
The signal is necessarily below (for buy) and above (for sell) the EMA of the specified period
(Buy) RSI low
The RSI index is below this value
(Sell) RSI High
The RSI index is higher than this value
(Buy) MFI low
The MFI index is below this value
(Sell) MFI High
The MFI index is higher than this value
(Buy) CCI low
CCI index is below this value
(Sell) CCI High
The CCI index is higher than this value
(Buy) Lowest bar from
The closing of the current bar is lower than the closing of the bars back in this range
(Sell) Highest bar from
The closing of the current bar is higher than the closing of bars in this range
(Buy) Lowest EMA bar ago
During a given distance back, the EMA value only decreased
(Sell) Highest EMA bar ago
At a given distance back, the EMA value only increased
I hope it will be useful!

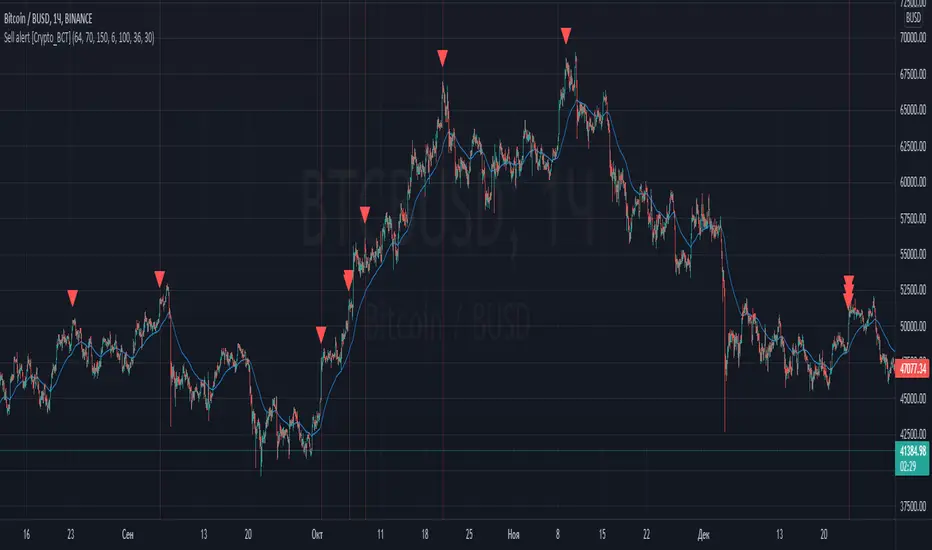
Sell alert [Crypto_BCT]Hello everybody!
I bring to your attention an indicator for determining the point of sell.
It is based on oscillators and a moving average.
Signal Condition Settings:
ATR
The current candle is larger than the ATR for this period
EMA
The signal must be above the EMA of the specified period
MFI High
The MFI index is higher than this value
CCI High
The CCI index is higher than this value
RSI High
The RSI index is higher than this value
Highest bar from
The closing of the current bar is higher than the closing of bars in this range
Highest EMA bar ago
At a given distance back, the EMA value only increased
I hope it will be useful!
Buy alert [Crypto_BCT]Hello everyone!
I bring to your attention a simple indicator to determine the point of purchase.
It is based on oscillators and a moving average.
It can be used to work with bots, for example 3COMMAS DCA bot.
Signal Condition Settings:
ATR
The current candle is larger than the ATR for this period
EMA
The signal is necessarily below the EMA of the specified period
MFI low
The MFI index is below this value
CCI low
CCI index is below this value
RSI low
The RSI index is below this value
Lowest bar from
The closing of the current bar is lower than the closing of the bars back in this range
Lowest EMA bar ago
During a given distance back, the EMA value only decreased
I hope it will be useful!

Trendlines with Breaks [LuxAlgo]The trendlines with breaks indicator return pivot point based trendlines with highlighted breakouts. Users can control the steepness of the trendlines as well as their slope calculation method.
Trendline breakouts occur in real-time and are not subject to backpainting. Trendlines can however be subject to repainting unless turned off from the user settings.
The indicator includes integrated alerts for trendline breakouts.
🔶 USAGE
Any valid trendlines methodology can be used with the indicator, users can identify breakouts in order to infer future price movements.
The calculation method of the slope greatly affects the trendline's behaviors. By default, an average true range is used, returning a more constant slope amongst trendlines. Other methods might return trendlines with significantly different slopes.
Stdev makes use of the standard deviation for the slope calculation, while Linreg makes use of the slope of a linear regression.
The above chart shows the indicator using "Stdev" as a slope calculation method. The chart below makes use of the "Linreg" method.
By default trendlines are subject to backpainting, and as such are offset by length bars in the past. Disabling backpainting will not offset the trendlines.
🔶 SETTINGS
Length: Pivot points period
Slope: Slope steepness, values greater than 1 return a steeper slope. Using a slope of 0 would be equivalent to obtaining levels.
Slope Calculation Method: Determines how the slope is calculated.
Backpaint: Determine whether trendlines are backpainted, that is offset to past.
