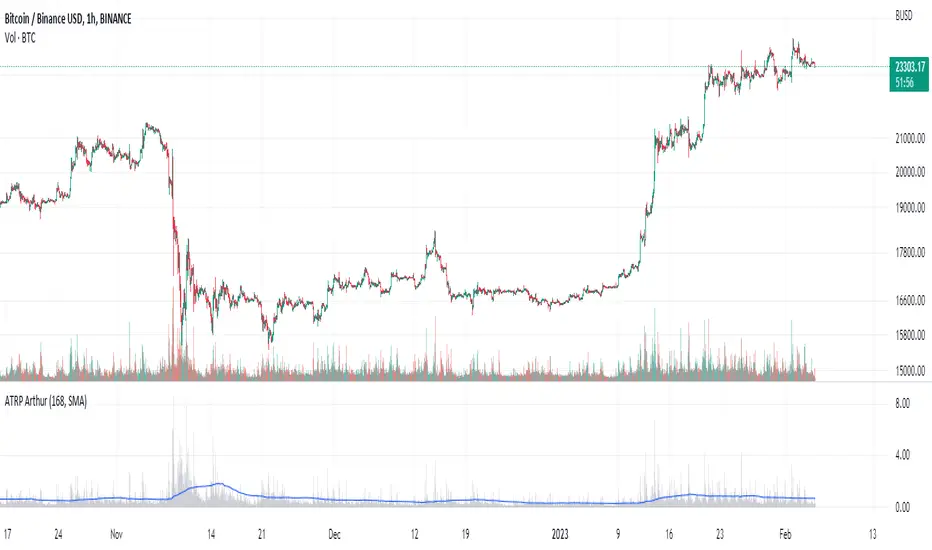
Average True Range PercentWhen writing the Quickfingers Luc base scanner (Marvin) script, I wanted a measure of volatility that would be comparable between charts. The traditional Average True Range (ATR) indicator calculates a discrete number providing the average true range of that chart for a specified number of periods. The ATR is not comparable across different price charts.
Average True Range Percent (ATRP) measures the true range for the period, converts it to a percentage using the average of the period's range ((high + low) / 2) and then smooths the percentage. The ATRP provides a measure of volatility that is comparable between charts showing their relative volatility.
Enjoy.
Average True Range (ATR)
Trail Blaze - (Multi Function Trailing Stop Loss) - [mutantdog]Shorter version:
As the title states, this is a 'Trailing Stop' type indicator, albeit one with a whole bunch of additional functionality, making it far more versatile and customisable than a standard trailing stop.
The main set of features includes:
Three independent trailing types each with their own +/- multipliers:
- Standard % change
- ATR (aka Supertrend)
- IQR (inter-quartile range)
These can be used in isolation or summed together. A subsequent pair of direction specific multipliers are also included.
Two separate custom source inputs are available, both feature the standard options alongside a selection of 'weighted inputs' and the option to use another indicator (selected via 'AUX'):
- 'Centre' determines the value about which the trailing sum will be added to define the stop level.
- 'Trigger' determines the value used for crossing of stops, initiating trend changes and triggering alerts.
A selection of optional filters and moving averages are available for both.
Furthermore there are various useful visualisation options available, including the underlying bands that govern the stop levels. Preset alerts for trend reversals are also included.
This is not really an 'out-of-the-box' indicator. Depending upon the market and timeframe some adjustments will be necessary for it to function in a useful manner, these can be as simple or complex as the feature-set allows. Basic settings are easy to dial in however and the default state is intended as a good starting point. Alternatively with some experimentation, a plethora of unique and creative configurations are possible, making this a great tool for tweaking. Below is a more detailed overview followed by a bunch of simple example settings.
------------------------
Lengthy Version :
DESIGN & CONCEPT
Before we start breaking this down, a little background. This started off as an attempt to improve upon the ever-popular Supertrend indicator. Of course there are many excellent user created variants available utilising some interesting methods to overcome the drawbacks of the basic version. To that end, rather than copying the work of others, the direction here shifted towards a hybrid trailing stop loss with a bunch of additional user customisation options. At some point, a completely different project involving IQR got morphed into this one. After sitting through months of sideways chop (where this proved to be of limited use), at the time of publication the market has began to form some near term trend direction and it appears to be performing well in many different timeframes.
And so with that out of the way...
INPUTS
The standard Supertrend (and most other variants) includes a single source input, as default set to 'hl2' (candle mid-range). This is the centre around which the atr bands are added/subtracted to govern the stop levels. This is not however the value which is used to trigger the trend reversal, that is usually hard-coded to 'close'. For this version both source values are adjustable: labelled 'centre' and 'trigger' respectively.
Each has custom input selectors including the usual options, a selection of 'weighted inputs' and the option to use another indicator (selected from the Aux input). The 'weighted inputs' are those introduced in Weight Gain 4000, for more details please refer to that listing. These should be treated as experimental, however may prove useful in certain configurations. In this case 'hl-oc2' can be considered an estimate of the candle median and may be a good alternative to the default 'centre' setting of 'hl2', in contrast 'cc-ohlc4' can tend to favour the extremes in the trend direction so could be useful as a faster 'trigger' than the default 'close'.
To cap them off both come with a selection of moving average filters (SMA, EMA, WMA, RMA, HMA, VWMA and a simple VWEMA - note: not elastic) aswell as median and mid-range. 'Centre' can also be set to the output of 'trigger' post-filter which can be useful if working with fast/slow crosses as the basis.
DYNAMICS
This is the main section, comprised of three separate factors: 'TSL', 'ATR' and 'IQR'. The first two should be fairly obvious, 'TSL' (trailing stop loss) is simply a percentage of the 'centre' value while 'ATR' (average true range) is the standard RMA-based version as used in Supertrend, Volatility Stop etc.
The third factor is less common however: 'IQR' (inter-quartile range). In case you are unfamiliar the principle here is, for a given dataset, the greatest 25% and smallest 25% of samples are removed. The remainder is then treated as a set and the range is calculated by highest - lowest. This is a commonly used method in statistical analysis, by removing the extremes it is less prone to influence by outliers and gives a good representation of the main dispersion around the median. In practise i have found it can be a good alternative to ATR, translating better across multiple time-frames due to it representing a fraction of the total range rather than an average of per-candle range like ATR. Used in combination with the others it can also add a factor more representative of longer-term/higher-timeframe trend. By discarding outliers it also benefits from not being impacted by brief pumps/volatility, instead responding only to more sustained changes in trend, such as rallies and parabolic moves. In order to give an accurate result the IQR is calculated using a dataset of high, low and hlcc4 values for all bars within the lookback length. Once calculated this value is then halved which, strictly speaking, makes it a semi-interquartile range.
All three of these components can be used individually or summed together to create a hybrid dynamics factor. Furthermore each multiplier can be set to both positive and negative values allowing for some interesting and creative possibilities. An optional smoothing filter can be applied to the sum, this is a basic SWMA-4 which is can reduce the impact of sudden changes but does incur a noticeable lag. Finally, a basic limiter condition has been hard-coded here to prevent the sum total from ever going below zero.
Capping off this section is a pair of direction multipliers. These simply take the prior dynamics sum and allow for further multiplication applied only to one side (uptrend/lo-stop and downtrend/hi-stop). To see why this is useful consider that markets often behave differently in each direction, we've all seen prices steadily climb over several weeks and then abruptly dump in the process of a day or two, shorter time frames are no stranger to this either. A lack of downside liquidity, a panicked market, aggressive shorts. All these things contribute to significant differences in downward price action. This function allows for tighter stops in one direction compared to the other to reflect this imbalance.
VISUALISATIONS
With all of these options and possibilities, some visual aids are useful. Beneath the dynamics' section are several visual options including both sources post-filter and the actual 'bands' created by the dynamics. These are what govern the stop levels and seeing them in full can help to better understand what our various configurations actually do. We can even hide the stop levels altogether and just use the bands, making this a kind of expanded Keltner Channel. Here we can also find colour and opacity settings for everything we've discussed.
EXAMPLES
The obvious first example here is the standard %-change trailing stop loss which, from my experience, tends to be the best suited for lower time frames. Filtering should probably minimal here. In both charts here we use the default config for source inputs, the top is a standard bi-directional setup with 1.5% tsl while the bottom uses a 2.5% tsl with the histop multiplier reduced to 0 resulting in an uptrend only stoploss.
Shown here in grey is the standard Supertrend which uses 'hl2' as centre and 'close' as trigger, ATR(10) multiplied by 3. On top we have the default filtered source config with ATR(8) multiplied by 2 which gives a different yet functionally similar result, below is the same source config instead using IQR(12) multiplied by 2. Notice here the more 'stepped' response from IQR following the central rally, holding back for a while before closing in on price and ultimately initiating reversal much sooner. Unlike ATR, the length parameter for IQR is absolute and can more significantly affect its responsiveness.
Next we focus on the visualisation options, on top we have the default source config with ATR(8) multiplied by 2 and IQR(12) multiplied by 1. Here we have activated the switch to show 'bands', from this we can see the actual summed dynamics and how it influences the stop levels. Below that we have an altogether different config utilising the included filters which are now visible. In this example we have created a basic 8/21 EMA cross and set a 1% TSL, notice the brief fakeout in the middle which ordinarily might indicate a buy signal. Here the TSL functions as an additional requirement which in this case is not met and thus no buy signal is given.
Finally we have a couple of more 'experimental' examples. On top we have Lazybear's 'Variable Moving Average' in white which has been assigned via 'aux' as the centre with no additional filtering, the default config for trigger is used here and a basic TSL of 1.5% added. It's a simple example but it shows how this can be applied to other indicators. At the bottom we return to the default source config, combining a TSL of 8% with IQR(24) multiplied by -2. Note here the negative IQR with greater length which causes the stop to close in on price following significant deviations while otherwise remaining fairly wide. Combining positive and negative multiples of each factor can yield mixed results, some more useful than others depending upon suitable market conditions.
Since this has been quite lengthy, i shall leave it there. Suffice to say that there are plenty more ways to use this besides these examples. Please feel free to share any of your own ideas in the comments below. Enjoy.

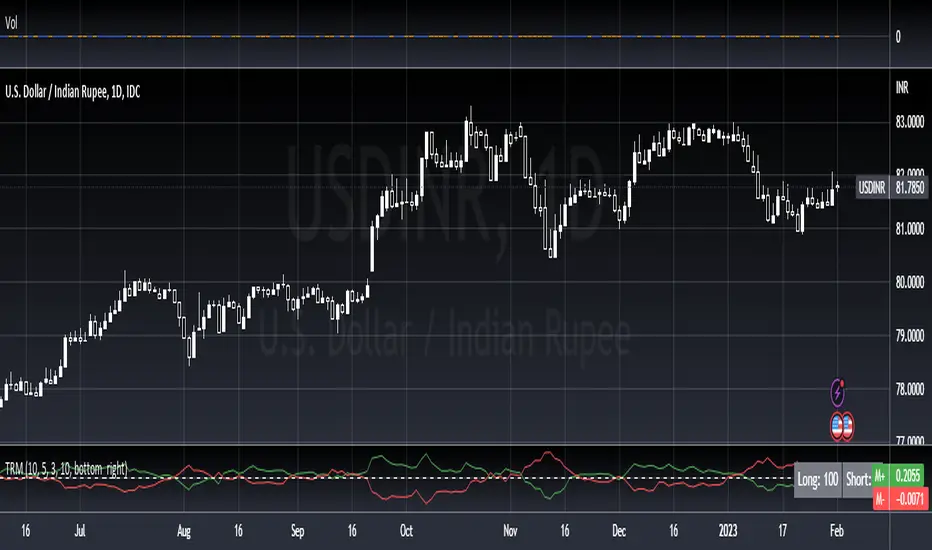
True Range MomentumThe indicator calculates the momentum of bullish and bearish based on the average true range and the highest highs and lowest lows of the historical price.
The indicator displays the strength for either taking a long position, or a short position.
The simplest way to use the indicator is to take a long position when the M+ line crosses above the 0 line. Similarly, to short, the M- line should cross above the 0 line. The exit would be when the respective line crosses below the 0 line.
The contrarian traders should wait for the lines to start rising towards the 0 line and taking an exit. In essence, the line should be going from negative to 0.
The greater the divergence between the M+ and M-, the stronger the trend.
The small table of Long and Short suggests what is in strength. A 100 will show a strong trend in the respective direction. It will be 50-50 when there is no clear direction, ideally identifying a consolidation range.
GKD-C ATR-Adaptive, Smoothed Laguerre RSI [Loxx]Giga Kaleidoscope ATR-Adaptive, Smoothed Laguerre RSI is a Confirmation module included in Loxx's "Giga Kaleidoscope Modularized Trading System".
█ Giga Kaleidoscope Modularized Trading System
What is Loxx's "Giga Kaleidoscope Modularized Trading System"?
The Giga Kaleidoscope Modularized Trading System is a trading system built on the philosophy of the NNFX (No Nonsense Forex) algorithmic trading.
What is an NNFX algorithmic trading strategy?
The NNFX algorithm is built on the principles of trend, momentum, and volatility. There are six core components in the NNFX trading algorithm:
1. Volatility - price volatility; e.g., Average True Range, True Range Double, Close-to-Close, etc.
2. Baseline - a moving average to identify price trend
3. Confirmation 1 - a technical indicator used to identify trends
4. Confirmation 2 - a technical indicator used to identify trends
5. Continuation - a technical indicator used to identify trends
6. Volatility/Volume - a technical indicator used to identify volatility/volume breakouts/breakdown
7. Exit - a technical indicator used to determine when a trend is exhausted
How does Loxx's GKD (Giga Kaleidoscope Modularized Trading System) implement the NNFX algorithm outlined above?
Loxx's GKD v1.0 system has five types of modules (indicators/strategies). These modules are:
1. GKD-BT - Backtesting module (Volatility, Number 1 in the NNFX algorithm)
2. GKD-B - Baseline module (Baseline and Volatility/Volume, Numbers 1 and 2 in the NNFX algorithm)
3. GKD-C - Confirmation 1/2 and Continuation module (Confirmation 1/2 and Continuation, Numbers 3, 4, and 5 in the NNFX algorithm)
4. GKD-V - Volatility/Volume module (Confirmation 1/2, Number 6 in the NNFX algorithm)
5. GKD-E - Exit module (Exit, Number 7 in the NNFX algorithm)
(additional module types will added in future releases)
Each module interacts with every module by passing data between modules. Data is passed between each module as described below:
GKD-B => GKD-V => GKD-C(1) => GKD-C(2) => GKD-C(Continuation) => GKD-E => GKD-BT
That is, the Baseline indicator passes its data to Volatility/Volume. The Volatility/Volume indicator passes its values to the Confirmation 1 indicator. The Confirmation 1 indicator passes its values to the Confirmation 2 indicator. The Confirmation 2 indicator passes its values to the Continuation indicator. The Continuation indicator passes its values to the Exit indicator, and finally, the Exit indicator passes its values to the Backtest strategy.
This chaining of indicators requires that each module conform to Loxx's GKD protocol, therefore allowing for the testing of every possible combination of technical indicators that make up the six components of the NNFX algorithm.
What does the application of the GKD trading system look like?
Example trading system:
Backtest: Strategy with 1-3 take profits, trailing stop loss, multiple types of PnL volatility, and 2 backtesting styles
Baseline: Hull Moving Average as shown on the chart above
Volatility/Volume: Volatility Ratio as shown on the chart above
Confirmation 1: ATR-Adaptive, Smoothed Laguerre RSI as shown on the chart above
Confirmation 2: Williams Percent Range
Continuation: Fisher Transform
Exit: Rex Oscillator
Each GKD indicator is denoted with a module identifier of either: GKD-BT, GKD-B, GKD-C, GKD-V, or GKD-E. This allows traders to understand to which module each indicator belongs and where each indicator fits into the GKD protocol chain.
Giga Kaleidoscope Modularized Trading System Signals (based on the NNFX algorithm)
Standard Entry
1. GKD-C Confirmation 1 Signal
2. GKD-B Baseline agrees
3. Price is within a range of 0.2x Volatility and 1.0x Volatility of the Goldie Locks Mean
4. GKD-C Confirmation 2 agrees
5. GKD-V Volatility/Volume agrees
Baseline Entry
1. GKD-B Baseline signal
2. GKD-C Confirmation 1 agrees
3. Price is within a range of 0.2x Volatility and 1.0x Volatility of the Goldie Locks Mean
4. GKD-C Confirmation 2 agrees
5. GKD-V Volatility/Volume agrees
6. GKD-C Confirmation 1 signal was less than 7 candles prior
Continuation Entry
1. Standard Entry, Baseline Entry, or Pullback; entry triggered previously
2. GKD-B Baseline hasn't crossed since entry signal trigger
3. GKD-C Confirmation Continuation Indicator signals
4. GKD-C Confirmation 1 agrees
5. GKD-B Baseline agrees
6. GKD-C Confirmation 2 agrees
1-Candle Rule Standard Entry
1. GKD-C Confirmation 1 signal
2. GKD-B Baseline agrees
3. Price is within a range of 0.2x Volatility and 1.0x Volatility of the Goldie Locks Mean
Next Candle:
1. Price retraced (Long: close < close or Short: close > close )
2. GKD-B Baseline agrees
3. GKD-C Confirmation 1 agrees
4. GKD-C Confirmation 2 agrees
5. GKD-V Volatility/Volume agrees
1-Candle Rule Baseline Entry
1. GKD-B Baseline signal
2. GKD-C Confirmation 1 agrees
3. Price is within a range of 0.2x Volatility and 1.0x Volatility of the Goldie Locks Mean
4. GKD-C Confirmation 1 signal was less than 7 candles prior
Next Candle:
1. Price retraced (Long: close < close or Short: close > close )
2. GKD-B Baseline agrees
3. GKD-C Confirmation 1 agrees
4. GKD-C Confirmation 2 agrees
5. GKD-V Volatility/Volume Agrees
PullBack Entry
1. GKD-B Baseline signal
2. GKD-C Confirmation 1 agrees
3. Price is beyond 1.0x Volatility of Baseline
Next Candle:
1. Price is within a range of 0.2x Volatility and 1.0x Volatility of the Goldie Locks Mean
3. GKD-C Confirmation 1 agrees
4. GKD-C Confirmation 2 agrees
5. GKD-V Volatility/Volume Agrees
█ ATR-Adaptive, Smoothed Laguerre RSI
What is ATR-Adaptive, Smoothed Laguerre RSI?
ATR-Adaptive, Smoothed Laguerre RSI is an adaptive Laguerre RSI indicator with smoothing to reduce noise. The Laguerre RSI indicator created by John F. Ehlers is described in his book "Cybernetic Analysis for Stocks and Futures". For this version, Instead of using fixed periods for Laguerre RSI calculation, this indicator uses an ATR ( average True Range ) adapting method to adjust the calculation period. This makes the RSI more responsive in some periods (periods of high volatility ), and smoother in order periods (periods of low volatility). There are two signal types: middle and levels.
Requirements
Inputs
Confirmation 1 and Solo Confirmation: GKD-V Volatility / Volume indicator
Confirmation 2: GKD-C Confirmation indicator
Outputs
Confirmation 2 and Solo Confirmation: GKD-E Exit indicator
Confirmation 1: GKD-C Confirmation indicator
Continuation: GKD-E Exit indicator
Additional features will be added in future releases.

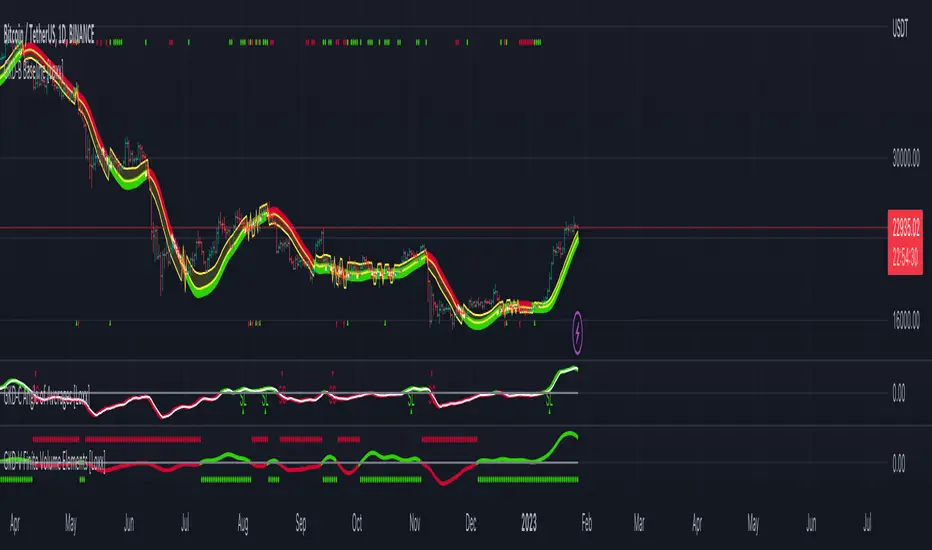
GKD-C Angle of Averages [Loxx]Giga Kaleidoscope Angle of Averages is a Confirmation module included in Loxx's "Giga Kaleidoscope Modularized Trading System".
█ Giga Kaleidoscope Modularized Trading System
What is Loxx's "Giga Kaleidoscope Modularized Trading System"?
The Giga Kaleidoscope Modularized Trading System is a trading system built on the philosophy of the NNFX (No Nonsense Forex) algorithmic trading.
What is an NNFX algorithmic trading strategy?
The NNFX algorithm is built on the principles of trend, momentum, and volatility. There are six core components in the NNFX trading algorithm:
1. Volatility - price volatility; e.g., Average True Range, True Range Double, Close-to-Close, etc.
2. Baseline - a moving average to identify price trend
3. Confirmation 1 - a technical indicator used to identify trends.
4. Confirmation 2 - a technical indicator used to identify trends.
5. Continuation - a technical indicator used to identify trends.
6. Volatility/Volume - a technical indicator used to identify volatility/volume breakouts/breakdown.
7. Exit - a technical indicator used to determine when a trend is exhausted.
How does Loxx's GKD (Giga Kaleidoscope Modularized Trading System) implement the NNFX algorithm outlined above?
Loxx's GKD v1.0 system has five types of modules (indicators/strategies). These modules are:
1. GKD-BT - Backtesting module (Volatility, Number 1 in the NNFX algorithm)
2. GKD-B - Baseline module (Baseline and Volatility/Volume, Numbers 1 and 2 in the NNFX algorithm)
3. GKD-C - Confirmation 1/2 and Continuation module (Confirmation 1/2 and Continuation, Numbers 3, 4, and 5 in the NNFX algorithm)
4. GKD-V - Volatility/Volume module (Confirmation 1/2, Number 6 in the NNFX algorithm)
5. GKD-E - Exit module (Exit, Number 7 in the NNFX algorithm)
(additional module types will added in future releases)
Each module interacts with every module by passing data between modules. Data is passed between each module as described below:
GKD-B => GKD-V => GKD-C(1) => GKD-C(2) => GKD-C(Continuation) => GKD-E => GKD-BT
That is, the Baseline indicator passes its data to Volatility/Volume. The Volatility/Volume indicator passes its values to the Confirmation 1 indicator. The Confirmation 1 indicator passes its values to the Confirmation 2 indicator. The Confirmation 2 indicator passes its values to the Continuation indicator. The Continuation indicator passes its values to the Exit indicator, and finally, the Exit indicator passes its values to the Backtest strategy.
This chaining of indicators requires that each module conform to Loxx's GKD protocol, therefore allowing for the testing of every possible combination of technical indicators that make up the six components of the NNFX algorithm.
What does the application of the GKD trading system look like?
Example trading system:
Backtest: Strategy with 1-3 take profits, trailing stop loss, multiple types of PnL volatility, and 2 backtesting styles
Baseline: Hull Moving Average as shown on the chart above
Volatility/Volume: Average Directional Index (ADX) as shown on the chart above
Confirmation 1: Angle of Averages as shown on the chart above
Confirmation 2: Williams Percent Range
Continuation: Fisher Transform
Exit: Rex Oscillator
Each GKD indicator is denoted with a module identifier of either: GKD-BT, GKD-B, GKD-C, GKD-V, or GKD-E. This allows traders to understand to which module each indicator belongs and where each indicator fits into the GKD protocol chain.
Giga Kaleidoscope Modularized Trading System Signals (based on the NNFX algorithm)
Standard Entry
1. GKD-C Confirmation 1 Signal
2. GKD-B Baseline agrees
3. Price is within a range of 0.2x Volatility and 1.0x Volatility of the Goldie Locks Mean
4. GKD-C Confirmation 2 agrees
5. GKD-V Volatility/Volume agrees
Baseline Entry
1. GKD-B Baseline signal
2. GKD-C Confirmation 1 agrees
3. Price is within a range of 0.2x Volatility and 1.0x Volatility of the Goldie Locks Mean
4. GKD-C Confirmation 2 agrees
5. GKD-V Volatility/Volume agrees
6. GKD-C Confirmation 1 signal was less than 7 candles prior
Continuation Entry
1. Standard Entry, Baseline Entry, or Pullback; entry triggered previously
2. GKD-B Baseline hasn't crossed since entry signal trigger
3. GKD-C Confirmation Continuation Indicator signals
4. GKD-C Confirmation 1 agrees
5. GKD-B Baseline agrees
6. GKD-C Confirmation 2 agrees
1-Candle Rule Standard Entry
1. GKD-C Confirmation 1 signal
2. GKD-B Baseline agrees
3. Price is within a range of 0.2x Volatility and 1.0x Volatility of the Goldie Locks Mean
Next Candle:
1. Price retraced (Long: close < close or Short: close > close )
2. GKD-B Baseline agrees
3. GKD-C Confirmation 1 agrees
4. GKD-C Confirmation 2 agrees
5. GKD-V Volatility/Volume agrees
1-Candle Rule Baseline Entry
1. GKD-B Baseline signal
2. GKD-C Confirmation 1 agrees
3. Price is within a range of 0.2x Volatility and 1.0x Volatility of the Goldie Locks Mean
4. GKD-C Confirmation 1 signal was less than 7 candles prior
Next Candle:
1. Price retraced (Long: close < close or Short: close > close )
2. GKD-B Baseline agrees
3. GKD-C Confirmation 1 agrees
4. GKD-C Confirmation 2 agrees
5. GKD-V Volatility/Volume Agrees
PullBack Entry
1. GKD-B Baseline signal
2. GKD-C Confirmation 1 agrees
3. Price is beyond 1.0x Volatility of Baseline
Next Candle:
1. Price is within a range of 0.2x Volatility and 1.0x Volatility of the Goldie Locks Mean
3. GKD-C Confirmation 1 agrees
4. GKD-C Confirmation 2 agrees
5. GKD-V Volatility/Volume Agrees
█ Angle of Average
What is Angle of Averages?
The problem that people overlook when asking to calculate an angle of an average is simple: data on Y axes of a time series chart is different type from the data on X axis. Since they are completely different, the angle can not be calculated from that data. Unless you make them the compatible. Here is one possible solution: convert time into "pips" by using average true range as a value of a single time bar and that way unifies the values of X and Y axis. Using the ATR for that is an approximation (there is no 100% accurate method to do that), but it is not a bad approximation: at least it is not showing results of > 90 degrees.
This indicator uses the calculation method described above and is extended to be able to 60+ types of moving averages.
You can read about the included moving averages here:
Requirements
Inputs
Confirmation 1 and Solo Confirmation: GKD-V Volatility / Volume indicator
Confirmation 2: GKD-C Confirmation indicator
Outputs
Confirmation 2 and Solo Confirmation: GKD-E Exit indicator
Confirmation 1: GKD-C Confirmation indicator
Continuation: GKD-E Exit indicator
Additional features will be added in future releases.
This indicator is only available to ALGX Trading VIP group members . You can see the Author's Instructions below to get more information on how to get access.
ER-Adaptive ATR Limit Channels w/ States [Loxx]As simple as it gets, channels based on high, low and ATR distances, Shows possible short term support / resistance or can be used as a take profit/stop-loss in some trading systems. It does this by comparing high/low values of price to multiplied by a multiple of ATR to determine when the trend changes. States are included to change the sensitivity to trend changes. 1 is very sensitive, 3 is least sensitive.
This uses Loxx's Expanded Source Types. You can read about them here:
What is ER Adaptive ATR?
Average True Range (ATR) is widely used indicator in many occasions for technical analysis . It is calculated as the RMA of true range. This version adds a "twist": it uses Perry Kaufman's Efficiency Ratio to calculate adaptive true range

Profitable Supertrend v0.1 - AlphaThis a script to try detect the best combination of supertrend parameters in a space of time. Sadly the script is slow. Evaluate all possibilities params is hard for a pinescript and my knowledge too. In some cases, when you want evaluate many time could be the script fails for timeout. Perhaps with time I could enhance. For this problem of speed the calculate of combinatios it's not complete: In factor use a increment of 0.2 in each param (0.1, 0.3, 0.5 ...) in period the increment for each value is 3. The range for factor it's from 3.0 to 12.0. The range of period it's from 10 to 43
My knowledge don't let me go more far. Perhaps with time I can enhance the script.

ATR PivotsThe "ATR Pivots" script is a technical analysis tool designed to help traders identify key levels of support and resistance on a chart. The indicator uses various metrics such as the Average True Range (ATR), Daily True Range ( DTR ), Daily True Range Percentage (DTR%), Average Daily Range (ADR), Previous Day High ( PDH ), and Previous Day Low ( PDL ) to provide a comprehensive picture of the volatility and movement of a security. The script also includes an EMA cloud and 200 EMA for trend identification and a 1-minute ATR scalping strategy for traders to make informed trading decisions.
ATR Detail:-
The ATR is a measure of the volatility of a security over a given period of time. It is calculated by taking the average of the true range (the difference between the high and low of a security) over a set number of periods. The user can input the number of periods (ATR length) to be used for the ATR calculation. The script also allows the user to choose whether to use the current close or not for the calculation. The script calculates various levels of support and resistance based on the relationship between the security's range ( high-low ) and the ATR. The levels are calculated by multiplying the ATR by different Fibonacci ratios (0.236, 0.382, 0.5, 0.618, 0.786, 1.000) and then adding or subtracting the result from the previous close. The script plots these levels on the chart, with the -100 level being the most significant level. The user also has an option to choose whether to plot all Fibonacci levels or not.
DTR and DTR% Detail:-
The Daily True Range Percentage (DTR%) is a metric that measures the daily volatility of a security as a percentage of its previous close. It is calculated by dividing the Daily True Range ( DTR ) by the previous close. DTR is the range between the current period's high and low and gives a measure of the volatility of the security on a daily basis. DTR% can be used as an indicator of the percentage of movement of the security on a daily basis. In this script, DTR% is used in combination with other metrics such as the Average True Range (ATR) and Fibonacci ratios to calculate key levels of support and resistance for the security. The idea behind using DTR% is that it can help traders to better understand the daily volatility of the security and make more informed trading decisions.
For example, if a security has a DTR% of 2%, it suggests that the security has a relatively low level of volatility and is less likely to experience significant price movements on a daily basis. On the other hand, if a security has a DTR% of 10%, it suggests that the security has a relatively high level of volatility and is more likely to experience significant price movements on a daily basis.
ADR:-
The script then calculates the ADR (Average Daily Range) which is the average of the daily range of the security, using the formula (Period High - Period Low) / ATR Length. This gives a measure of the average volatility of the security on a daily basis, which can be useful for determining potential levels of support and resistance .
PDH /PDL:-
The script also calculates PDH (Previous Day High) and PDL (Previous Day Low) which are the High and low of the previous day of the security. This gives a measure of the previous day's volatility and movement, which can be useful for determining potential levels of support and resistance .
EMA Cloud and 200 EMA Detail:-
The EMA cloud is a technical analysis tool that helps traders identify the trend of the market by comparing two different exponential moving averages (EMAs) of different lengths. The cloud is created by plotting the fast EMA and the slow EMA on the chart and filling the space between them. The user can input the length of the fast and slow EMA , and the script will calculate and plot these EMAs on the chart. The space between the two EMAs is then filled with a color that represents the trend, with green indicating a bullish trend and red indicating a bearish trend . Additionally, the script also plots a 200 EMA , which is a commonly used long-term trend indicator. When the fast EMA is above the slow EMA and the 200 EMA , it is considered a bullish signal, indicating an uptrend. When the fast EMA is below the slow EMA and the 200 EMA , it is considered a bearish signal, indicating a downtrend. The EMA cloud and 200 EMA can be used together to help traders identify the overall trend of the market and make more informed trading decisions.
1 Minute ATR Scalping Strategy:-
The script also includes a 1-minute ATR scalping strategy that can be used by traders looking for quick profits in the market. The strategy involves using the ATR levels calculated by the script as well as the EMA cloud and 200 EMA to identify potential buy and sell opportunities. For example, if the 1-minute ATR is above 11 in NIFTY and the EMA cloud is bullish , the strategy suggests buying the security. Similarly, if the 1-minute ATR is above 30 in BANKNIFTY and the EMA cloud is bullish , the strategy suggests buying the security.
Inside Candle:-
The Inside Candle is a price action pattern that occurs when the current candle's high and low are entirely within the range of the previous candle's high and low. This pattern indicates indecision or consolidation in the market and can be a potential sign of a trend reversal. When used in the 15-minute chart, traders can look for Inside Candle patterns that occur at key levels of support or resistance. If the Inside Candle pattern occurs at a key level and the price subsequently breaks out of the range of the Inside Candle, it can be a signal to enter a trade in the direction of the breakout. Traders can also use the Inside Candle pattern to trade in a tight range, or to reduce their exposure to a current trend.
Risk Management:-
As with any trading strategy, it is important to practice proper risk management when using the ATR Pivots script and the 1-minute ATR scalping strategy. This may include setting stop-loss orders, using appropriate position sizing, and diversifying your portfolio. It is also important to note that past performance is not indicative of future results and that the script and strategy provided are for educational purposes only.
In conclusion, the "ATR Pivots" script is a powerful tool that can help traders identify key levels of support and resistance , as well as trend direction. The additional metrics such as DTR , DTR%, ADR, PDH , and PDL provide a more comprehensive picture of the volatility and movement of the security, making it easier for traders to make better trading decisions. The inclusion of the EMA cloud and 200 EMA for trend identification, and the 1-minute ATR scalping strategy for quick profits can further enhance a trader's decision-making process. However, it is important to practice proper risk management and understand that past performance is not indicative of future results.
Special thanks to satymahajan for the idea of clubbing Average True Range with Fibonacci levels.

DTR/ATR Scanner v1.0This indicator allows you to view DTR vs. ATR % for multiple instruments. When colors are Red the instrument is near 90% of its daily ATR.

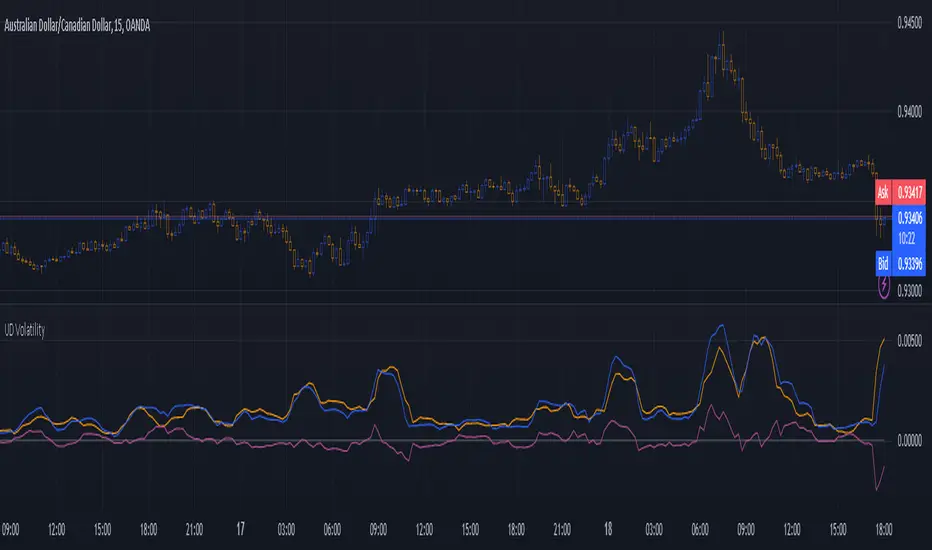
Up Down VolatilityThis is just experimental. I wanted the flexibility in looking at volatility and this indicator gives you several ways to do so.
I haven't figured out the best way to use this yet but I suspect that as a form of entry confirmation indicator would be best.
If you find a way this works well for you please drop me a note. It would nice know someone found a way to use it successfully!
The options available are:
* Your source can be price or the ATR.
* It allows you to separate the volatility of the bearish and bullish candles and even allows you to produce differential.
* You can choose to run the result through any one of many smoothers.
With the above options you can look at:
* The normal volatility. That is not split into bearish and bullish components.
* The bearish and bullish volatility and the difference between them.
* The relative bearish and bullish volatility and the difference between them.
The "The relative bearish and bullish" is each one divided into the source before it was split into Up and Down or low/high divided by close which should make the max value roughly around 1.
The code is structured to easily drop into a bigger system so use it as a lone indicator or add the code to some bigger project you are creating. If you do integrate it into something else then send me a note as it would be nice to know it's being well used.
Enjoy and good luck!
Lots / Leverage / Margin [JoseMetal]============
ENGLISH
============
- Description:
This is a utility indicator, it prints a table with ATR, Volatility, Lotage and Margin for 3 custom timeframes, using the ATR of basis, it calculates volatility (%) and a recommended lotage depending on your risk settings.
A few months ago i fled from crypto exchanges to regulated brokers, and working with lots instead of plain margin was a bit of headache, i also trade with crypto, currencies, metals and indexes, each with different volatility, leverage... so this tool was a MUST for me to code.
So basically, this tool allows to keep the same RISK for every single asset, no matter if they have different volatility.
- Visual:
The indicator shows a table with all the info explained, ATR, Volatility...
For each timeframe it also prints 3 periods, short, long and average, you can show/hide timeframes and the different periods.
- Customization:
Colors in the table are custom, as well as the font size.
The risk management settings start with the margin you want to use as average, then you can customize your asset leverage, the risk (which is a value you HAVE to keep the same for all assets to balance the results correctly) and units per lot.
You can increase/decrease risk if you want to, i personally take DAILY values with a 18-20 risk to trade on a 4H chart.
For the "units per lot" take in mind that usually that value is ONE, but in some assets with really low value like currencies or some crypto your broker can set 1 lot to xxxx units, that's why you have that option.
- Usage and recommendations:
As i said i trade from 4H to daily, that's why my risk setting is 18-20, i use the lots plotted in the table on DAILY.
If you're more a scalper, just adjust the timeframes to your needs :)
Enjoy!
============
INGLÉS
============
- Descripción:
Este es un indicador de utilidad, imprime una tabla con ATR, Volatilidad, Lotaje y Margen para 3 temporalidades personalizadas, usando el ATR de base, calcula la volatilidad (%) y un lotaje recomendado dependiendo de tu configuración de riesgo.
Hace unos meses cambié de intercambios crypto (exchanges) a brokers regulados, y trabajar con lotes en lugar de margen simple era un poco dolor de cabeza, también tradeo con crypto, divisas, metales e índices, cada uno con diferente volatilidad, apalancamiento... así que esta herramienta era IMPRESCINDIBLE para mí de programar.
Básicamente, esta herramienta permite mantener el mismo RIESGO para cada activo, sin importar si tienen diferente volatilidad.
- Visual:
El indicador muestra una tabla con toda la información explicada, ATR, Volatilidad...
Para cada temporalidad también imprime 3 períodos, corto, largo y medio, puedes mostrar/ocultar los marcos temporales y los diferentes periodos.
- Personalización:
Los colores de la tabla son personalizados, así como el tamaño de la fuente.
La configuración de la gestión del riesgo comienza con el margen que deseas utilizar como promedio, a continuación, puedes personalizar el apalancamiento del activo, el riesgo (que es un valor que TIENE que mantener igual para todos los activos para equilibrar los resultados correctamente) y las unidades por lote.
Puedes aumentar/disminuir el riesgo si quieres, yo personalmente tomo valores DIARIOS con un riesgo de 18-20 para operar en un gráfico de 4H.
Para las "unidades por lote" ten en cuenta que normalmente ese valor es UNO, pero en algunos activos con valor realmente bajo como divisas o algunas criptomonedas tu broker puede poner 1 lote a xxxx unidades, por eso agrego esa opción.
- Uso y recomendaciones:
Como dije yo opero de 4H a diario, por eso mi ajuste de riesgo es de 18-20, uso los lotes graficados en la tabla en DIARIO.
Si eres más un scalper, sólo tienes que ajustar las temporalidades a tus necesidades :)
¡Que lo disfrutes!

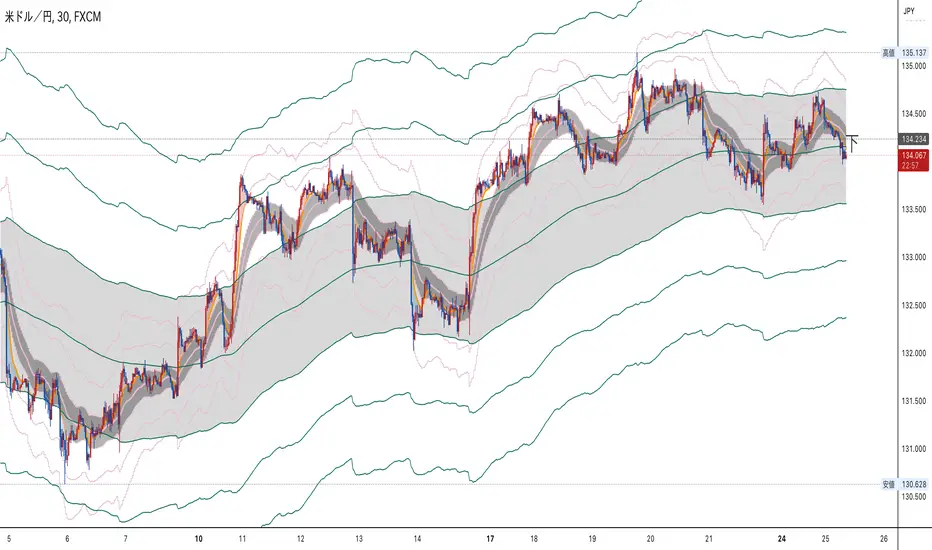
LIZ-ATR-Based EMA EnvelopesThis envelope has an "auto band adjustment function" that reflects the most recent volatility in the band width by ATR.
This makes it easy to handle without the need to change the band width according to the volatility of the stocks to be displayed.
The time periods and colors of each time frame that can be displayed and the central band of the envelope are as follows.
Monthly: 2-year line (light blue)
Weekly: 3-month line (black)
Daily: 1 month line (blue)
4-hourly: 1-week line (green)
1 hour: 24 hour line (purple)
30-minute: 12-hour line (light purple)
15-minute: 4-hour line (orange)
5min:2hr (skin color)
1 minute: 30 minute line (gray-blue)
30 seconds: 10 minute line (blue-purple)
15-seconds: 7.5-minute line (sky blue)
10-seconds: 5-minute line (brown)
5-seconds: 2-minute line (emerald green)
Depending on where the price resides in the band, the following situations can be identified
・When inside the first band: Trendless
・Between the first and second band: Normal trend
・Between the 2nd and 3rd band: Strong trend
・When the third line is exceeded: Overheat condition
The first range is painted in gray and encourages not to follow the trend. In addition, the "up" sign will automatically light up when the price is above this gray zone, the "middle" sign when the price is in the middle of the gray zone, and the "down" sign when the price is below the gray zone.
このエンベロープは直近のボラティリティーをATRによってバンド幅に反映させる、「オートバンド調整機能」を搭載しています。
そのため、表示させる銘柄のボラティリティーに合わせてバンド幅を変更する必要がなく扱いやすいです。
表示できる各時間足と、エンベロープの中心バンドの期間・色は、以下の通りです。
月足:2年線(水色)
週足:3ヶ月線(黒)
日足:1ヶ月線(青)
4時間足:1週間線(緑)
1時間足:24時間線(紫)
30分足:12時間線(薄紫)
15分足:4時間線(オレンジ)
5分足:2時間線(肌色)
1分足:30分線(グレーブルー)
30秒足:10分線(青紫)
15秒足:7.5分線(スカイブルー)
10秒足:5分線(茶色)
5秒足:2分線(エメラルドグリーン)
価格がバンドのどこに存在するかによって以下の状況がわかります。
・1本目のバンド内側にある時:トレンドレス
・1本目から2本目の間にある時:ノーマルトレンド
・2本目から3本目の間にある時:強いトレンド
・3本目をオーバーしている時:過熱状態
1本目の範囲はグレーで塗られ、トレンドフォローしない事を促します。また、このグレーゾーンの上に価格がある時は「上」、中にある時は「中」、下にあるときは「下」の文字サインが自動点灯します。
kaptanFantastik[Take Profit and Stop Loss Finder]Hello all,
It's ATR based active take profit & stop loss finder.
You can set multipliers for taking profit and stop losing and you can change the price source for the calculation. Also, you can change the ATR level.
Defaults are my best settings. 2.2x for taking profit and 1.5x for stop losing. Open price is the source. Also, I think 5 ATR is the best for day and swing trade.
Levels are determined according to the open prices (This is because we can enter the position after our other indicators give the signal following the close price. Yet, you can change it). Since it's active and based on my calculation with ATR values, percentages for the taking profits and stop losing may change. Because of this, you need to note the take profit and stop lose prices after your entry price level is determined by the other indicators for the best success rates.
It can be used in any time frame with the other indicators to determine the best entry points. For example, 3 EMA levels with 5,8 and 13 is good option for the entry. You can enter the position when 5 crosses up 8 and both are above the 13. You can also use custom more advanced buy/sell indicators with this one for entry points.
It can be used with any asset from cryptocurrency to the stocks, from forex to gold etc.
Hint: You can set your levels lower than the take profit prices to maximize the success rate.
Note: Market should be open for the positions.
Example trade on the 5-minute timeline.
The below chart has both my custom indicator and the 3 EMAs mentioned above.
Trade 1: Entry price: 19191, Take Profit: 19276. Profit 0.44%
Trade 2: Entry price: 19189, Take Profit: 193009. Profit 0.625%
Türkçe bilen kullanıcılar için açıklama
Herkese merhabalar,
ATR tabanlı aktif kar al ve zararı durdur bulucu.
Kar almak ve zararı kesmek için çarpanlar belirleyebilir ve hesaplama için fiyat kaynağı değiştirebilirsiniz. Ayrıca, ATR seviyesini de değiştirebilirsiniz.
Varsayılanlar benim en iyi ayarlarım. Kar almak için 2,2 kat ve zararı durdurmak için 1,5 kat. Açılış, fiyat kaynağıdır. Ayrıca, 5 ATR'nin günlük ve kısa vade (swing trade) için en iyisi olduğunu düşünüyorum.
Seviyeler açılış fiyatına göre belirlenir (Çünkü diğer göstergelerimiz kapanış fiyatının ardından sinyal verdikten sonra pozisyona girebiliyoruz. Yine de bunu değiştirebilirsiniz). Aktif olduğu için ve ATR değerleri ile yaptığım hesaplamaya göre kar alma ve zarar kes yüzdeleri değişebilir. Bu nedenle, en iyi başarı oranları için; giriş fiyat seviyeniz diğer göstergeler tarafından belirlendikten sonra kar al ve zararı durdur fiyatlarını not etmeniz gerekir.
En iyi giriş noktalarını belirlemek için diğer göstergelerle herhangi bir zaman diliminde kullanılabilir. Örneğin, 5,8 ve 13 ile 3 EMA seviyesi giriş için iyi bir seçenektir. 5, 8'i geçtiğinde ve her ikisi de 13'ün üzerinde olduğunda pozisyona girebilirsiniz. Giriş noktaları için bununla birlikte daha gelişmiş özel al/sat göstergelerini de kullanabilirsiniz.
Kripto paradan hisse senetlerine, forexten altına vb. her türlü varlıkla kullanılabilir.
İpucu: Başarı oranını en üst düzeye çıkarmak için seviyelerinizi kar alma fiyatlarından daha düşük ayarlayabilirsiniz.
Not: Pozisyonlar için piyasa açık olmalıdır.
5 dakikalık zaman çizilgesinde örnek işlem.
Yukarıdaki örnek grafikte hem özel indikatörüm hem de yukrıda belirtilen 3 EMA var.
İşlem 1: Giriş fiyatı: 19191, Kazanç Al: 19276. Kar %0.44
İşlem 2: Giriş fiyatı: 19189, Kazanç Al: 193009. Kar %0.625

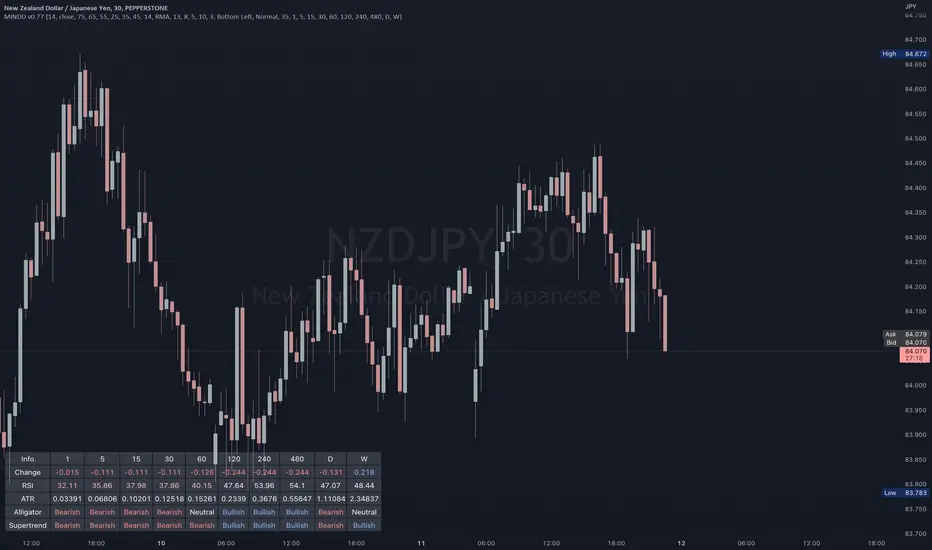
Multi IND Dashboard [Skiploss]Multi IND Dashboard is dashboard combine with price change, RSI, ATR, Alligator and Supertrend. With a maximum of 10 timeframes, I think it's going to make your life easier. In looking at the momentum of each chart.
How it work??
Change :
It is the distance from the close price of previous candlestick and shows the movement value of the candlestick in that timeframe.
RSI :
Default setting are 14 and source close
Value >= 75 : Fill text color maximum overbought
Value >= 65 : Fill text color medium overbought
Value >= 55 : Fill text color minimum overbought
Value >= 45 : Fill text color minimum overbought
Value >= 35 : Fill text color medium overbought
Value >= 25 : Fill text color maximum overbought
ATR :
Default setting are 14 length and RMA smoothing, It like the average swing of the candlesticks.
Alligator :
Default setting are 13, 8 and 5
Bullish status is value lips > teeth and teeth > jaw
Bearish status is value lips < teeth and teeth < jaw
Neutral status status is value lips > teeth and teeth < jaw or lips < teeth and teeth > jaw
Supertrend :
Default setting are 8 and 3.0
Bullish status is uptrend
Bearish status is downtrend
ATR+This is an indicator which uses the ATR (average true range) to calculate take profit levels, stop loss levels, and position sizing.
It acts an ATR indicator, based on concepts found in the No Nonsense Forex (NNFX) trading system.
ATR works by looking at the past N periods (14 by default) to see on average, how many pips or dollars an asset has moved. It is widely used by itself or as part of another indicator.
This script also implements money/risk management to determine:
Take Profit : 1.00x ATR (default)
Stop Loss : 1.50x ATR (default)
Risk : 2% of account size (default)
Position Sizing : How many lots/shares/units you need to achieve the indicated risk
Trade Value : The total cost of the lots/shares/units
This indicator only displays information in the status line. It does not guarantee a successful trade, and is only intended to be used to calculate take profit and stop loss levels, or as a point of reference when entering trades. Always do your own research.

1st Gray Cross Signals ━ Histogram SQZMOM [whvntr][LazyBear]This is the Histogram Version of one of my other indicators named: SQZ Momentum + 1st Gray Cross Signals (with arrows) Which is a modification of "Squeeze Momentum Indicator" by user: "LazyBear". In that indicator of his he described, and suggested, the use of his gray cross signals to find points of interest for trading based on the direction of momentum when the first gray cross appears... I have programmed these points, and highlighted them, for ease of use. The 1st gray cross strategy, he said , is from John F. Carter's book, Chapter 11, "Mastering the Trade".
Here we have the Histogram version, with background highlights only, and nothing on the chart, in true SQZ Momentum style.
Disclaimer: using this indicator, or any indicator anywhere, involves risk when trading and isn't a guarantee of 100% accurate results.

ATR Oscillator - Index (Average True range Oscillator)The purpose of converting the ATR value indicator to an oscillator;
It is known that the ATR value is not between the two specified values. So it is not compressed between 0 and 100 like RSI and %B etc. Therefore, conditions such as "A condition if ATR value is X, B condition if ATR value is Y" cannot be created. In order to create these conditions, the max and min value range of the ATR value must be determined. This indicator converts the ATR values into a percentage number according to the maximum and minimum ATR values in the period you will choose. Max value is 100, min value is 0. The considered ATR value, on the other hand, corresponds to the % of the difference between the max and min value in the selected period.
In this way, conditions such as "If the ATR Oscillator value is greater than 10 or 20 or 30" can now be created, or the value of another indicator can be calculated based on the ATR Oscillator value. For example; Let's say we want the standard deviation of BBand to change according to the value of the ATR Oscillator. If BBand Standard Deviation is 3 if ATRO value is 100, BBand Standard Deviation is 2 if ATRO value is 0, and BBand Standard Deviation is 2.5 when ATRO value is 50;
We can encode it as BBand_Std_Dev=((ATRO*0.01)+2 )
If the ATRO value is between .... and ...., you can make improvements such as plot color X.

Trendly
╭━━━━╮╱╱╱╱╱╱╱╱╭┳╮
┃╭╮╭╮┃╱╱╱╱╱╱╱╱┃┃┃
╰╯┃┃┣┻┳━━┳━╮╭━╯┃┃╭╮╱╭╮
╱╱┃┃┃╭┫┃━┫╭╮┫╭╮┃┃┃┃╱┃┃
╱╱┃┃┃┃┃┃━┫┃┃┃╰╯┃╰┫╰━╯┃
╱╱╰╯╰╯╰━━┻╯╰┻━━┻━┻━╮╭╯
╱╱╱╱╱╱╱╱╱╱╱╱╱╱╱╱╱╭━╯┃
╱╱╱╱╱╱╱╱╱╱╱╱╱╱╱╱╱╰━━╯
About the script:
This script is an easy-to-use trend indicator, which is based on another popular indicator called "Supertrend" . The basic idea is very simple, i.e. to compute Average True Range(ATR) and use that as the basis for trend detection. The key difference lies in a custom trend detection method, that computes trends across different timeframes and projects them in a table view. The script also tries to improve the behaviour of the existing indicator by highlighting flat regions on the chart, indicating sideways market or potential trend reversals.
How to use it:
You can use it just like any other indicator, add it to your chart and start analysing market trends. Results can be interpreted as follows.
Indicator output is currently made up of two main components:
>> Trend Table:
Appears at the bottom right of your screen
Contains trend indicator for 9 different timeframes
Timeframes can be adjusted using indicator settings panel
Green Up Arrow --> Up Trend
Red Down Arrow --> Down Trend
>> Enhanced Supertrend:
Shows up as a line plot on the chart
Green line indicates up trend
Red line indicates down trend
White regions indicates slow moving markets or a potential trend reversal
Indicator can be used on any timeframe, it provides a view of current and historical market trend
Can be used as an indicator for entering/exiting trades
Can be used to build custom trading strategies

BankNifty Dash
This indicator to be used only in BankNifty , shows Values of BankNifty Index & its top constituents.
Dashboard Interpretation :
LTP - Last Traded Price.
D High - Day High.
D Low - Day Low.
I Points - Shows the contribution of top BankNifty constituents according to its weightage.
PH-PL - "PH - PL" means LTP is trading between Previous Days High( PH ) & Previous Days Low( PL ) which indicates Rangebound-ness.
"+ PH" means LTP is trading above Previous Days High( PH ) which indicates Bullish-ness.
"- PL" means LTP is trading below Previous Days Low( PL ) which indicates Bearish-ness.
ATR - Displays the Daily ATR (Average True Range) (14 period).
DTR - Current Day Range.
DTR% - Current Day Range percentage.
( DTR & DTR%, changes colour based on percent value. < 61.8 is green and > 61.8 is red.)
For example if the Daily ATR is 100 and the current range of the day is 200 this would be 200% the original move.
EMA:-
Default value of 5 is used in Fast EMA.
Default value of 21 is used in Slow EMA.
Default value of 200 is used in EMA (Used for trend direction).
User can change values from input section.
If the colour filled between Fast EMA and Slow EMA is green, the market is in a uptrend
If the colour filled between Fast EMA and Slow EMA is red, the market is in a downtrend.
ADR :-
Plots ADR (Average Day Range) zones are used as support and resistance, ADR zones are calculated using a 5 or 10 day period unless you change the settings.
PDH/PDL :-
Plots Previous Day High(PDH) and Previous Day low(PDL).

Remaining ATR [vnhilton]ATR levels can be used on a trading day to look for overextensions beyond the average, where you can look to take profits. Remaining ATR is calculated as the current day range subtracted by the previous day ATR. RATR is then plotted away from the high & low lines. All lines (except for the day open) are dynamic, so RATR lines will move according to how much RATR remains.
Note: This indicator only works on intraday timeframes
(FEATURES)
- Works on either RTH or ETH sessions
- Select Day ATR period, & 3 multipliers that will be applied to RATR values away from respective intraday high & low
- Extend current lines to the right
- Show recent lines only
- Change line style, colours within & out the intraday range, & thickness
- Change label offset, size, & colours within & out the intraday range
- Hide RATR lines & labels when within intraday range
- Plot fill between lines (note: RATR plot fills are from their lines to the intraday high & low, so there'll be overlapping)
To show more lines in the past, go to higher intraday timeframes.
Same chart & timeframe as above but on RTH session only.

Volatility Compression Ratio by M-CarloHello traders. I created this simple indicator to use as a FILTER.
He does not provide any operational signals but tells us if we are in a period of volatility compression or expansion and it can work on all market.
This filter works great for all strategies that work on breakouts
The concept is this: I will enter at breakout of a price level that I consider important, only if there is a volatility compression and not in the case of expansion of volatility.
Technically the calculation is very simple:
Step 1: I calculate the ATR at "x" periods, I set 7 by default because I get better results but you can change it as you like using the "atr length" field. You can also choose whether to calculate the ATR via RMA, SMA or EMA.
Step 2: I Calculate a simple average of the previous ATR over a longer period, longer period than set with the "length multiplier" parameter, which multiplies the "atr length" value by "x" times. Here I set the default 3 but you can change it as you like.
Step 3: I divide the ATR value calculated in step1 by its long-term average calculated in step2, obtaining a value that will oscillate above and below the value of 1
So:
if the indicator is above the value of 1 it means that volatility is expanding
If the indicator is below the value of 1 it means that we are in a period of volatility compression (and as we know volatility explodes sooner or later)
If you have any questions write to me and I hope this filter helps you! Have good Trading!

Position Size and PNL CalculatorPosition Size and PNL Calculator is a Tool indicator which will help trader determine Trading's Position Size base on many risk management method such is Risk Per Trade, Fix Position Size, Fix Initial cost. The stoploss of the order will be set after ATR Stoploss method like my lasted Indicator ATR Stop Loss and Take Profit Finder .
This Tool is using the concept of
- ATR ( Average True Range )
- Risk Reward Ratio (Money Management method)
- Leverage Position Size Calculation
- Leverage PNL Calculation
- Risk Per Trade money management for calculating the size of position base on Account Balance and Risk
How Position Size and PNL Calculator working?
1) The tool will let user Input time and price that trader are entering the order. Then trader have to select the direction of trade, weather it is long position or short position
2) Next It will use entry price to Calculate the Stoploss price buy Calculating its ATR according to the setting then, then The entry price will be plus/mins by ATR*Multiply to get a Stoploss price
3) then we will * Risk Reward Ratio to the distance of stoploss in order to create Takeprofit price
4) After then the tool will simulate and calculate Initial cost/Initial position size base on your setting, and will display Stoploss Price, Take Profit Price, PNL% of Loss if Stoploss is trigger, PNL% of Gain if Take profit is Trigger and current RR/ PNL%
5) User can adjust the leverage and other setting in Indicator setting
How to use Position Size and PNL Calculator
As it was mention, Position Size and PNL Calculator is just a tool that help trader determine Trading's Position Size, PNL and risk management. Trader must use this tool only as a Position Tracking after you help entry order with your our trading strategy

Average True Range Refurbished💡 Objective
This script is a rebuild of the pre-existing ATR indicator, with improvements and fine-tuning.
🪄Improvements
1. Normalization option (range 0 to 100)
2. Optional calculation of the ratio between current volatility and average volatility
3. Optional smoothing
4. Show a moving average
5. Show Bollinger Bands with 3 bands
6. Change bar colors according to ATR and Bollinger Bands
📚 Definition
'The Average True Range (ATR) is a tool used in technical analysis to measure volatility. Unlike many of today's popular indicators, the ATR is not used to indicate the direction of price. Rather, it is a metric used solely to measure volatility, especially volatility caused by price gaps or limit moves.'
(TradingView)
