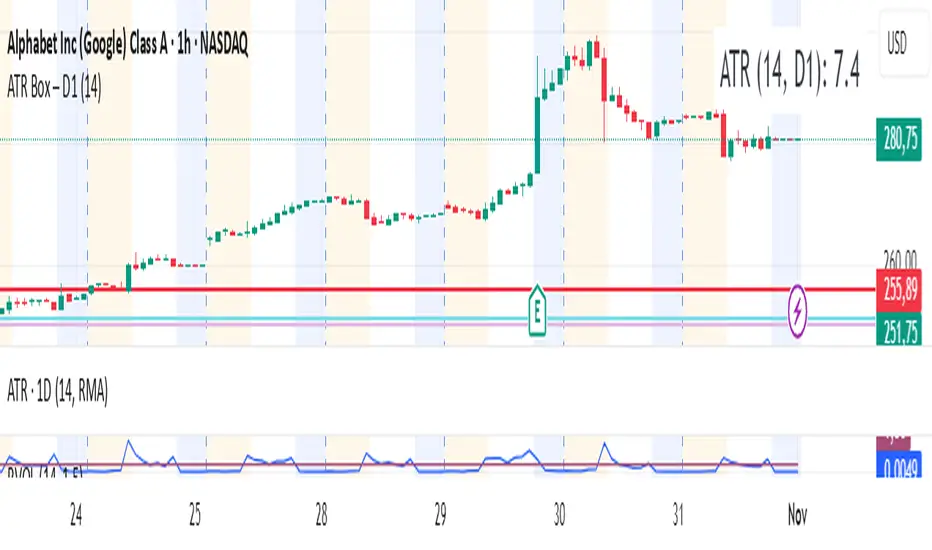
ATR (No Gap) - Advanced Volatility IndicatorA customizable Average True Range indicator that eliminates gap distortion between trading sessions, providing cleaner volatility measurements for intraday and swing traders.
Key Features:
Gap Filtering: Optional toggle to ignore overnight/weekend gaps that distort volatility readings
EMA Smoothing: Defaults to EMA for more responsive volatility tracking (also supports RMA and SMA)
Half ATR Display: Shows 50% ATR value for quick stop-loss and take-profit calculations
Clean Value Table: Real-time values displayed on chart with configurable decimal precision
Flexible Settings: Customize length, smoothing method, and display options
Ideal for:
Setting dynamic stop losses and take profits
Position sizing based on current volatility
Comparing gap vs. no-gap volatility measurements
Trading instruments with large overnight gaps (indices, forex, crypto)
Use this indicator to get a more accurate picture of intraday volatility without the noise from session gaps!
Average True Range (ATR)

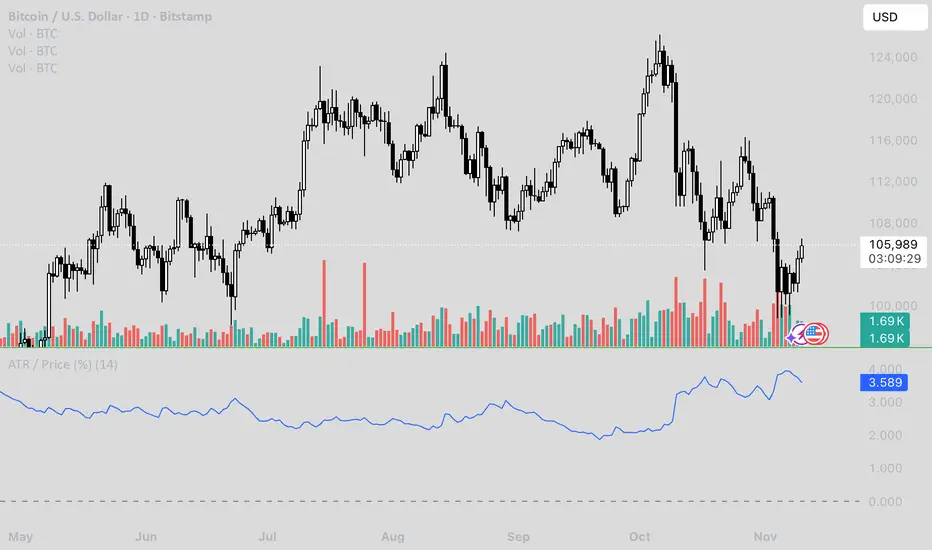
ATR / Price RatioDescription:
This indicator plots the ratio of the Average True Range (ATR) to the current price, showing volatility as a percentage of price rather than in absolute terms. It helps compare volatility across assets and timeframes by normalizing for price level.
A higher ATR/Price ratio means the market is moving a larger percentage of its value each bar (high relative volatility). A lower ratio indicates tighter, quieter price action (low relative volatility).
Traders can use this ratio to:
• Compare volatility between instruments
• Identify shifts into high or low volatility regimes
• Adjust position sizing and stop distances relative to risk
Whale Hunter🇬🇧 English Description
Whale Hunt is a simple yet powerful indicator designed to detect unusually large candles in the market.
It identifies candles exceeding a set volatility threshold based on ATR (Average True Range), marking them as “Whale Candles.”
📈 Features:
Option to include/exclude wicks in calculations
Separate color customization for bullish and bearish candles
Midpoint lines projected forward based on candle size
Adjustable ATR period and multiplier
💡 Use Cases:
Detecting strong market moves
Observing volatility spikes
Identifying liquidity grabs
⚠️ Disclaimer:
This indicator is for educational purposes only and does not constitute financial advice.

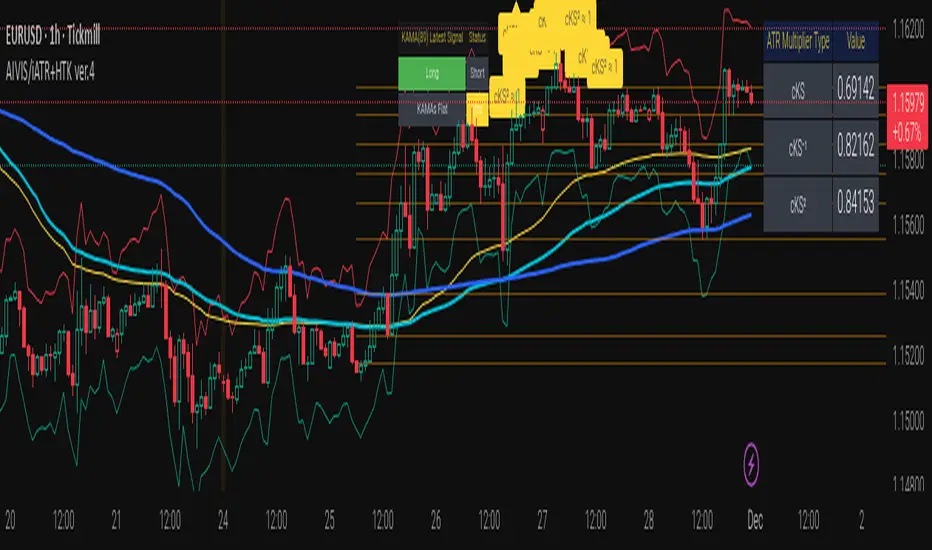
Adaptive CE-VWAP Breakout Framework [KedArc Quant]Description
A structured framework that unites three complementary systems into one charting engine:
Chandelier Exit (CE) – ATR-based trailing logic that defines trend direction, stop placement, and risk/reward overlays.
Swing-Anchored VWAP (SWAV) – a dynamically anchored VWAP that re-starts from each confirmed swing and adapts its smoothness to volatility.
Pivot S/R with Volume Breaks – confirmed horizontal levels with alerts when broken on expanding volume.
This script builds a single workflow for bias → trigger → managementwithout mixing unrelated indicators. Each module is internally linked rather than layered cosmetically, making it a true analytical framework—not.
Acknowledgment
Special thanks to Dynamic Swing Anchored VWAP by Zeiierman, whose swing-anchoring concept inspired a part of the SWAV module’s implementation and adaptation logic.
Support and Resistance Levels with Breaks by LuxAlgo for S/R breakout logic.
How this helps traders
Trend clarity – CE color-codes direction and provides evolving stops.
Context value – SWAV traces adaptive mean paths so traders see where price is heavy or light.
Action filter – Pivot+volume logic highlights true structural breaks, filtering false moves.
Discipline tool – Optional R:R boxes visualize risk and target zones to enforce planning.
Entry / Exit guidelines (for study purposes only)
Bias Use CE direction: green = long bias red = short bias
Entry
1. Breakout method– Trade in CE direction when a pivot level breaks on valid volume.
2. VWAP confirmation– Prefer breaks occurring around the nearest SWAV path (fair-value cross or re-test).
Exit
Stop = CE line / recent swing HL / ATR × (multiplier)
Target = R-multiple × risk (default 2 R)
Optional live update keeps SL/TP aligned with current CE state.
Core formula concepts
ATR Stop: Stop = High/Low – ATR × multiplier
VWAP calc: Σ(price × vol) / Σ(vol) anchored at swing pivot, adapted by APT (Adaptive Price Tracking) ratio ∝ ATR volatility.
Volume oscillator: 100 × (EMA₅ – EMA₁₀)/EMA₁₀; valid break when threshold %.
Input configuration (high-level)
Master Controls
Show CE / SWAV modules Theme & Fill opacity
CE Section
ATR period & multiplier Use Close for extremums
Show buy/sell labels Await bar confirmation
Risk-Reward overlay: R-multiple, Stop basis (CE/Swing/ATR×), Live update toggle
SWAV Section
Swing period Adaptive Price Tracking length Volatility bias (ATR-based adaptation) Line width
Pivot & Volume Breaks
Left/Right bar windows Volume threshold % Show Break labels and alerts
Best timeframes
Intraday: 5 m – 30 m for breakout confirmation
Swing: 1 h – 4 h for trend context
Settings scale with instrument volatility—adjust ATR period and volume threshold to match liquidity.
Glossary
ATR: Average True Range (volatility metric)
CE: Chandelier Exit (trailing stop/trend filter)
SWAV: Swing-Anchored VWAP (anchored mean price path)
Pivot H/L: Confirmed local extrema using left/right bar windows
R-multiple: Profit target as a multiple of initial risk
FAQ
Q: Does it repaint? A: No—pivots wait for confirmation and VWAP updates forward-only.
Q: Can modules be disabled? A: Yes—each section has its own toggle.
Q: Can it trade automatically? A: This is an indicator/study, not an auto-strategy.
Q: Is this financial advice? A: No—educational use only.
Disclaimer
This script is for educational and analytical purposes only.
It is not financial advice. Trading involves risk of loss. Past performance does not guarantee future results. Always apply sound risk management.

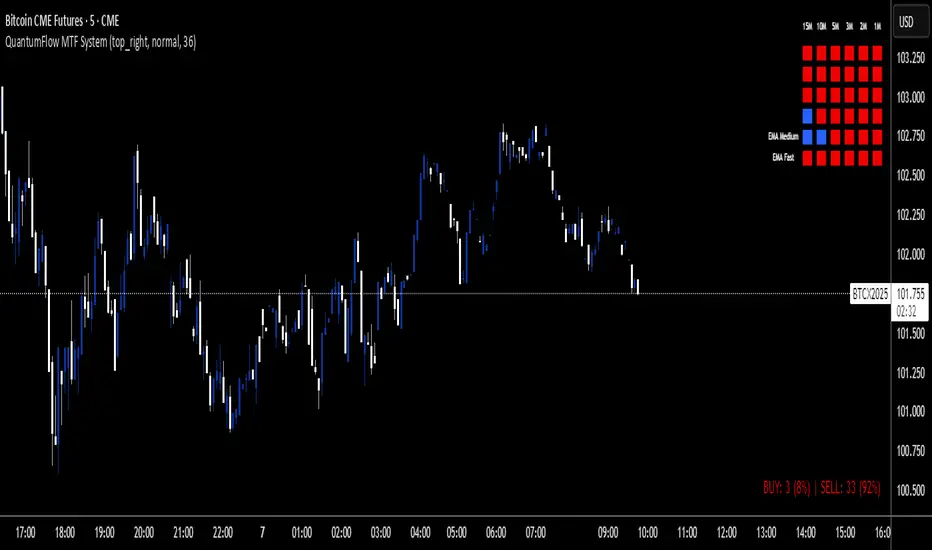
QuantumFlow MTF System Extended
QuantumFlow MTF System Extended
Multi-Timeframe Directional Flow & Volatility Alignment Engine — Higher-Timeframe Edition
The QuantumFlow MTF System Extended is a higher-timeframe analytical framework that expands upon the original QuantumFlow concept.
While the base version focuses on short-term structures (1M – 15M), this edition is designed for traders who need to observe medium- to long-term directional harmony across the 30M, 45M, 1H, 2H, 3H and 4H timeframes.
Its purpose is to provide a structured, non-repainting overview of how momentum and volatility align over broader market horizons — helping traders understand the prevailing directional flow rather than predicting future prices.
Concept
The system aggregates confirmed Supertrend directions from each higher timeframe, converting them into normalized bullish or bearish values.
These values are then processed through dual-layer EMA momentum filters that validate the directional strength of each component.
The resulting matrix displays a precise snapshot of how higher-timeframe market structures are synchronized — serving as a compass of directional alignment rather than a buy/sell signal generator.
A multi-ATR framework defines adaptive volatility zones, allowing each instrument to react proportionally to its intrinsic volatility profile.
This approach smooths sensitivity shifts that often occur between intraday and multi-hour structures, delivering consistent analytical behavior across asset classes.
How It Works
Confirmed Multi-Timeframe Supertrend
Each timeframe produces a close-confirmed Supertrend direction, ensuring signal stability and preventing repainting.
Adaptive Multi-ATR Model
Multiple ATR instances with distinct deviation factors define dynamic volatility thresholds that self-adjust to market conditions.
Dual EMA Momentum Validation
Two independent EMA layers filter and confirm each Supertrend direction, improving directional clarity and reliability.
Flow Totals Engine
The indicator sums all timeframe states into real-time bullish/bearish totals and percentage ratios, clearly visualized within a single panel.
Configurable Alerts (Optional)
Users may set threshold-based alerts when directional alignment reaches specified intensity levels (for example, when all timeframes are synchronized).
Full Customization
All visual elements — colors, text, background, and layout — can be adjusted to match personal preferences or chart themes.
Intended Use and Benefits
Observe how higher-timeframe trends align to reveal medium-term directional bias.
Quantify the balance of bullish vs bearish momentum across multiple timeframes.
Combine with lower-timeframe analysis (e.g. the original QuantumFlow System) to establish multi-layer confirmation between short- and mid-term flows.
Maintain awareness of trend synchronization or divergence without relying on subjective chart interpretation.
This indicator does not provide trading signals, forecasts, or financial advice.
It is an analytical tool intended to assist users in studying market structure and volatility behavior.
Chart Display
QuantumFlow Extended presents a unified dashboard that lists each analyzed timeframe, its active directional state, and the overall flow balance in numeric and percentage form.
It functions seamlessly on all instruments and can be used standalone or alongside the original short-term version.
Access
This is an invite-only indicator.
To request access or additional information, please contact the author privately via the TradingView profile.

ATR SL/TP Precision Zones (Dots)ATR SL/TP Precision Zones (Dots) is a volatility-based tool designed to help traders set accurate Stop Loss and Take Profit levels based on real market volatility — not fixed pips or emotion.
This indicator uses ATR (Average True Range) multiplied by 1.2 to calculate dynamic distance bands.
Instead of drawing a ribbon or channel, it places simple dots above and below each candle:
Upper Dot (Green) → Suggested Take Profit / Price Stretch Zone
Lower Dot (Red) → Suggested Stop Loss Cushion / Support Expansion Zone
Because ATR measures market volatility, these dots expand during high volatility and tighten during slow markets, helping traders avoid stop-loss hunts and premature exits.
Why This Works
Most traders lose because:
They set SL too close → stopped out by noise
They set TP too far → price never reaches it
This tool calibrates those distances automatically based on real price movement behavior.
ATR = volatility
Volatility = market breathing room
This indicator ensures your trade has room to breathe, increasing win consistency.
Best Use Cases
Scalping
Swing trading
Trend continuation entries
Reversal confirmations with support/resistance
Works on Crypto / Forex / Stocks / Futures

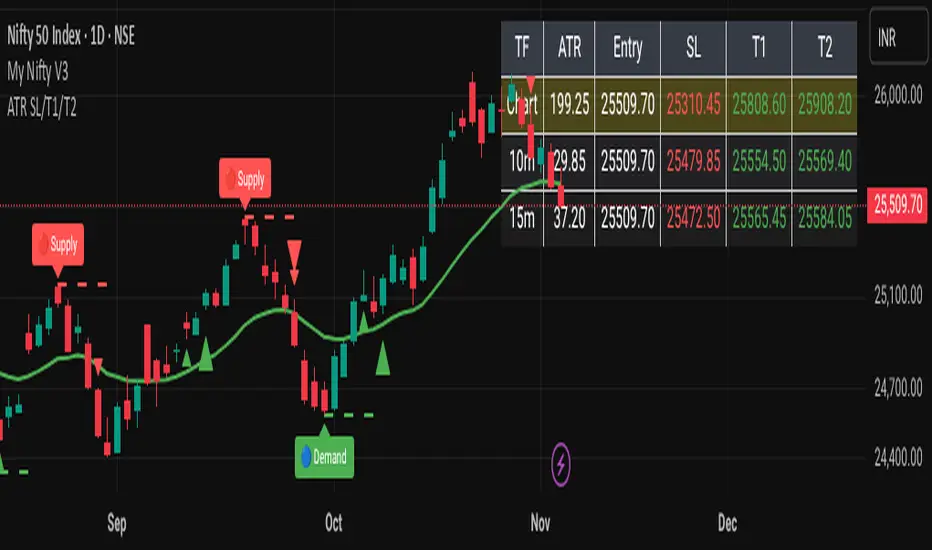
ATR-Based Volatility SL/Target Planner (MTF Table)✅ ATR SL & Target Planner (MTF Table – Chart, 10m, 15m)
This indicator provides a clean multi-timeframe ATR table showing:
✅ ATR (Chart / 10m / 15m)
✅ Entry price (manual or auto)
✅ ATR-based Stop-Loss
✅ Target 1 & Target 2
✅ MTF level comparison
✅ High-contrast color-coded SL (Red) + Targets (Green)
✅ Selected timeframe highlighted automatically
Designed for intraday traders, positional traders, and volatility-based strategies.
✅ How to Use It
✅ 1. Choose Entry Mode
Manual Entry ON → Type your entry price
Manual Entry OFF → Last candle close is used
The script calculates ATR(14) on:
Current chart timeframe
10-minute timeframe
15-minute timeframe
Then it uses standard volatility-based formulas:
Stop-Loss = Entry ± (ATR × SL Multiplier)
Target 1 = Entry ± (ATR × T1 Multiplier)
Target 2 = Entry ± (ATR × T2 Multiplier)
Direction depends on Long/Short mode.
You can switch which ATR timeframe becomes active (affecting plotted lines + alerts).
✅ Why This Indicator Is Useful
This script solves 3 common problems:
✅ 1. “How wide should my stop-loss be?”
ATR automatically adjusts the SL to market volatility.
✅ 2. “Which timeframe ATR should I trust?”
You can compare Chart, 10m, and 15m in one panel.
✅ 3. “The table is too big in other indicators.”
This is compact, clean, color-coded, and readable.
Happy Trading :)
Quantura - Supply & Demand Zone DetectionIntroduction
“Quantura – Supply & Demand Zone Detection” is an advanced indicator designed to automatically detect and visualize institutional supply and demand zones, as well as breaker blocks, directly on the chart. The tool helps traders identify key areas of market imbalance and potential reversal or continuation zones, based on price structure, volume, and ATR dynamics.
Originality & Value
This indicator provides a unique and adaptive method of zone detection that goes beyond simple pivot or candle-based logic. It merges multiple layers of confirmation—volume sensitivity, ATR filters, and swing structure—while dynamically tracking how zones evolve as the market progresses. Unlike traditional supply and demand indicators, this script also detects and plots Breaker Zones when previous imbalances are violated, giving traders an extra layer of market context.
The key values of this tool include:
Automated detection of high-probability supply and demand zones.
Integration of both volume and ATR filters for precision and adaptability.
Dynamic zone merging and updating based on price evolution.
Identification of breaker blocks (invalidated zones) to visualize market structure shifts.
Optional bullish and bearish trade signals when zones are retested.
Clear, visually optimized plotting for efficient chart interpretation.
Functionality & Core Logic
The indicator continuously scans recent price data for swing highs/lows and combines them with optional volume and ATR conditions to validate potential zones.
Demand Zones are formed when price action indicates accumulation or a strong bullish rejection from a low area.
Supply Zones are created when distribution or strong bearish rejection occurs near local highs.
Breaker Blocks appear when existing zones are invalidated by price, helping traders visualize potential market structure shifts.
Bullish and bearish signals appear when price re-enters an active zone or breaks through a breaker block.
Parameters & Customization
Demand Zones / Supply Zones: Enable or disable each individually.
Breaker Zones: Activate breaker block detection for invalidated zones.
Volume Filter: Optional filter to only confirm zones when volume exceeds its long-term average by a user-defined multiplier.
ATR Filter: Optional filter for volatility confirmation, ensuring zones form under strong momentum conditions.
Swing Length: Controls the number of bars used to detect structural pivots.
Sensitivity Controls: Adjustable ATR and volume multipliers to fine-tune detection responsiveness.
Signals: Toggle for on-chart bullish (▲) and bearish (▼) signal plotting when price interacts with zones.
Color Customization: User-defined bullish and bearish colors for both standard and breaker zones.
Core Calculations
Zones are detected using pivot highs and lows with a defined lookback and lookahead period.
Additional filters apply if ATR and volume are enabled, requiring conditions like “ATR > average * multiplier” and “Volume > average * multiplier.”
Detected zones are merged if overlapping, keeping the chart clean and logical.
When price breaks through a zone, the original box is closed, and a new breaker zone is plotted automatically.
Bullish and bearish markers appear when zones are retested from the opposite side.
Visualization & Display
Demand zones are shaded in semi-transparent bullish color (default: blue).
Supply zones are shaded in semi-transparent bearish color (default: red).
Breaker zones appear when previous imbalances are broken, helping to spot structural shifts.
Optional arrows (▲ / ▼) indicate potential buy or sell reactions on zone interaction.
Use Cases
Identify institutional areas of accumulation (demand) or distribution (supply).
Detect potential breakout traps and market structure shifts using breaker zones.
Combine with other tools such as volume profile, EMA, or liquidity indicators for deeper confirmation.
Observe retests and reactions of zones to anticipate possible reversals or continuations.
Apply multi-timeframe analysis to align higher timeframe zones with lower timeframe entries.
Limitations & Recommendations
The indicator does not predict future price movement; it highlights structural imbalances only.
Performance depends on chosen swing length and sensitivity—users should optimize parameters for each market.
Works best in volatile markets where supply and demand imbalances are clearly expressed.
Should be used as part of a broader trading framework, not as a standalone signal generator.
Markets & Timeframes
The “Quantura – Supply & Demand Zone Detection” indicator is suitable for all asset classes including cryptocurrencies, Forex, indices, commodities, and equities. It performs reliably across multiple timeframes, from intraday scalping to higher timeframe swing analysis.
Author & Access
Developed 100% by Quantura. Published as a Open-source script indicator. Access is free.
Important
This description complies with TradingView’s Script Publishing and House Rules. It clearly explains the indicator’s originality, underlying logic, functionality, and intended use without unrealistic claims or performance guarantees.

Quantura - Trendchange ZonesIntroduction
“Quantura – Trendchange Zones” is an advanced technical indicator that identifies and visualizes potential market reversal zones using dynamic RSI-based logic. It highlights areas of overbought and oversold conditions, marking them as visual zones directly on the price chart, and generates corresponding bullish and bearish signals when the RSI exits these extremes. The tool helps traders anticipate possible trend change regions and confirm momentum shifts in a clean, intuitive way.
Originality & Value
Unlike traditional RSI indicators that only show a static oscillator, this tool transforms RSI behavior into on-chart visual zones that represent structural overbought and oversold phases. It converts RSI threshold breaches into price-based regions (boxes) and marks reversal signals at the moment of momentum change.
The indicator’s originality and usefulness come from its:
Direct visualization of RSI overbought and oversold areas as dynamic chart zones.
Automatic detection of potential reversal regions where momentum exhaustion is likely.
Integration of RSI-based signals and visual cues without requiring users to monitor the RSI window.
Adjustable sensitivity for RSI length and upper/lower levels.
Clear color-coded separation of bullish and bearish phases.
Functionality & Core Logic
The indicator continuously monitors RSI values relative to the user-defined thresholds.
When RSI moves above the upper level, an Overbought Zone is created and extends until RSI falls back below that threshold.
When RSI moves below the lower level, an Oversold Zone is generated and extends until RSI returns above that level.
When RSI exits one of these zones, a corresponding Trendchange Signal (▲ bullish or ▼ bearish) appears at the transition point.
Each zone dynamically adjusts its high and low levels during formation, representing the complete range of the exhaustion phase.
Parameters & Customization
RSI Length: Defines the sensitivity of RSI calculation. Shorter lengths make signals more responsive; longer lengths filter noise.
Upper Level / Lower Level: Set thresholds for overbought and oversold conditions (default 70 / 30).
Signals: Toggle on/off for displaying bullish (▲) and bearish (▼) reversal signals.
Zones: Toggle the visualization of shaded RSI-based zones.
Colors: Fully customizable bullish and bearish colors for both signals and zones.
Visualization & Display
Bullish reversal zones (oversold exits) are shaded using the chosen bullish color (default: blue).
Bearish reversal zones (overbought exits) are shaded using the chosen bearish color (default: red).
Each completed zone is outlined and filled with transparent shading for better clarity.
Reversal arrows (▲ for bullish, ▼ for bearish) are displayed at the bar where RSI exits the extreme level.
Clean overlay design ensures compatibility with any chart style or color scheme.
Use Cases
Identify overbought and oversold periods directly on the price chart without switching to the RSI window.
Anticipate potential market reversals or exhaustion points based on RSI momentum shifts.
Combine with trend indicators, moving averages, or volume tools for confirmation.
Apply across multiple timeframes to align short-term reversal signals with higher timeframe momentum.
Use zone width and duration to assess the strength and persistence of overbought/oversold conditions.
Limitations & Recommendations
The indicator is not a standalone trading system but a visual confirmation tool.
False signals may occur in strongly trending markets where RSI remains overextended.
Optimal RSI settings may differ between assets (e.g., crypto vs. equities).
Combining this indicator with additional trend or structure filters can enhance accuracy.
Markets & Timeframes
The “Quantura – Trendchange Zones” indicator works across all markets and timeframes, including cryptocurrencies, Forex, stocks, and commodities. It is suitable for both short-term scalping and long-term swing analysis.
Author & Access
Developed 100% by Quantura. Published as a Open-source script indicator. Access is free.
Important
This description complies with TradingView’s Script Publishing and House Rules. It provides a clear explanation of the indicator’s originality, logic, and function while avoiding unrealistic performance or predictive claims.

Quantura - Fair Value GapIntroduction
“Quantura – Fair Value Gap” is a precision-engineered institutional concept indicator designed to automatically identify, visualize, and manage Fair Value Gaps (FVGs) across any market or timeframe. It enables traders to observe price inefficiencies, potential liquidity voids, and retracement areas that often act as magnets for price rebalancing.
Originality & Value
Unlike many public FVG scripts that only highlight candle gaps, this indicator integrates dynamic filters and adaptive logic to determine the strength and reliability of each gap. It merges overlapping zones intelligently and optionally extends valid imbalances forward for ongoing reference.
Its value lies in:
Dynamic statistical filtering based on gap standard deviation.
Optional volume confirmation for high-confidence FVGs.
Automatic merging of overlapping or adjacent gaps for clean visualization.
Support for both bullish and bearish imbalances.
Signal alerts when gaps are filled or rebalanced by price.
Functionality & Core Logic
Detects Fair Value Gaps by comparing candle-to-candle price displacement.
Applies a Gap Filter (standard deviation-based) to qualify valid gaps.
Optionally validates gaps formed under significant volume conditions.
Draws color-coded boxes to mark bullish (discount) and bearish (premium) inefficiencies.
Monitors each FVG until price fills the gap, at which point the box is visually closed.
Provides optional signal markers (“▲” or “▼”) when rebalancing occurs.
Parameters & Customization
Gap Filter: Sets the minimum statistical deviation required for a valid FVG. Higher values detect fewer, stronger gaps.
Volume Filter: Toggles additional validation using relative volume strength.
Volume Sensitivity: Adjusts how much above-average volume must be present to confirm a gap.
Bullish/Bearish Colors: Customize color schemes for imbalance zones.
Extend Gaps: Optionally extend open gaps forward for better confluence tracking.
Signals: Enables or disables gap-fill signal markers.
Visualization & Display
Bullish FVGs: Appear in blue-tinted boxes, indicating potential demand-side inefficiencies.
Bearish FVGs: Appear in red-tinted boxes, representing potential supply-side inefficiencies.
Overlapping zones are merged automatically to maintain clarity.
Filled gaps remain visible for historical context, allowing for post-event analysis.
Optional signal arrows display when price returns to rebalance an FVG.
Use Cases
Identify institutional inefficiencies and liquidity voids.
Detect premium and discount levels in trending markets.
Combine with market structure or order block indicators for confluence.
Track when price rebalances inefficiencies to refine entry/exit points.
Build FVG-based algorithmic strategies that rely on structural imbalance resolution.
Limitations & Recommendations
The indicator detects structural imbalances but does not predict future direction or guarantee profitability.
Volume filters may behave differently across brokers due to data-source differences.
Use alongside structure or liquidity tools for enhanced decision-making.
Extreme volatility or illiquid assets may generate temporary invalid gaps.
Markets & Timeframes
Compatible with all markets (crypto, forex, equities, indices, futures) and all timeframes. Recommended for multi-timeframe confluence analysis — e.g., detecting higher-timeframe FVGs and refining lower-timeframe entries.
Author & Access
Developed 100% by Quantura. Published as a Open-source script indicator. Access is free.
Compliance Note
This description adheres fully to TradingView’s House Rules and Script Publishing Requirements . It provides a detailed explanation of originality, core logic, limitations, and appropriate use — with no unrealistic or misleading performance claims.

QuantumFlowTraderQuantumFlowTrader
Adaptive Flow Visualizer with Multi-ATR Volatility Engine and Multi-EMA Clouds
Overview
QuantumFlowTrader is an adaptive market flow visualizer that integrates multiple EMA clouds, a session VWAP framework, and a tested multi-ATR volatility engine.
It is built to help traders interpret directional strength, institutional balance, and volatility synchronization across any asset and timeframe available on TradingView.
How It Works
1. Multi-EMA Clouds — Trend Structure and Flow Context
QuantumFlowTrader employs several EMA-based cloud layers to represent short-, medium-, and long-term structure simultaneously.
Each cloud adapts dynamically to price movement, revealing trend alignment and momentum stacking across depths of the market.
When all EMA clouds align in the same direction, the color gradient intensifies (green for bullish, red for bearish).
When structure conflicts, transparency increases, signaling mixed or transitional phases.
This multi-cloud approach allows traders to see structure, flow, and trend shifts at a glance, eliminating guesswork and highlighting transitions between trend and consolidation.
2. Session VWAP — Institutional Equilibrium and Reaction Zones
The Session VWAP represents the real-time mean price that institutional participants often reference.
QuantumFlowTrader enhances it with tested adaptive deviation envelopes, which highlight zones where price frequently reacts or pauses.
These deviation zones dynamically expand or contract with volatility, defining institutional fair-value regions and potential continuation or mean-reversion boundaries.
VWAP color automatically changes based on whether price trades above or below the equilibrium, giving immediate visual feedback on session bias.
3. QuantumFlow ATR Engine — Core Innovation
At the heart of QuantumFlowTrader is its proprietary multi-ATR engine, a deeply tested system that runs multiple ATR calculations and deviation layers at the same time.
Unlike single-metric approaches, this composite engine merges several ATRs with different sensitivities and deviations to identify synchronized volatility alignment.
When all ATR layers align bullish, a green up-arrow appears below the bar.
When all align bearish, a red down-arrow appears above the bar.
This configuration has been tested for many years across market types and volatility regimes.
Its goal is to detect moments when price action, volatility, and structure converge, which historically coincide with the start or continuation of strong directional flows.
This multi-ATR architecture is what makes QuantumFlowTrader genuinely unique among volatility-based systems.
Adaptability Across Assets and Timeframes
QuantumFlowTrader is universally adaptable:
Works effectively on any timeframe, from scalping to swing or position trading.
Performs consistently across Forex, Stocks, Indices, Commodities, and Crypto.
The internal algorithms automatically adjust their sensitivity and scaling to the selected chart’s behavior, ensuring smooth adaptation to different volatility environments.
This makes it suitable for traders who want a consistent analytical framework adaptable to both short-term and long-term contexts.
Customization and Alerts
EMA Clouds: adjust colors, transparency, and visibility for each structural layer.
VWAP Zones: toggle the equilibrium line and deviation visualization.
ATR Arrows: control arrow appearance and size for bullish/bearish events.
Dynamic Scaling: built-in adaptive multiplier auto-balances volatility response.
Built-in alerts:
Buy Condition: all ATR layers bullish and price above VWAP.
Sell Condition: all ATR layers bearish and price below VWAP.
These alerts identify situations where both directional flow and volatility alignment agree.
Originality and Value
QuantumFlowTrader is not a mash-up of public indicators.
Its originality lies in how it integrates:
Multiple EMA clouds for layered structural analysis.
Session VWAP with adaptive deviation zones to reveal institutional equilibrium and price reactions.
A proprietary multi-ATR engine that combines several ATR and deviation configurations simultaneously for volatility confirmation.
Together, these systems produce a unified, adaptive visualization of market structure, volatility, and flow — helping traders stay aligned with dynamic directional conditions while filtering out low-efficiency noise.
Example — Multi-Timeframe Integration (Optional Use)
While QuantumFlowTrader works effectively on any single chart, many traders use a three-screen workflow to synchronize trend, momentum, and execution:
1 Screen: 15-minute, Defines dominant trend direction (multi-EMA cloud + VWAP bias).
2 Screen: 5-minute, Confirms flow alignment and momentum coherence.
3 Screen: 1-minute, Executes entries when ATR arrows appear in the same direction as the 15-minute trend.
Example workflow:
1. Identify overall direction from 15m cloud and VWAP structure.
2. Wait for 5m confirmation.
3. Time entries on 1m using ATR arrows aligned with the higher timeframe.
This structure enhances precision and reduces counter-trend exposure.
Best Practices and Limitations
Always use proper risk management and forward testing before applying live.
Author’s Instructions:
To request access, please contact the author through the TradingView profile.

Simulated Fear & Greed (CNN-calibrated v2)🧭 Fear & Greed Index — TradingView Version (Simulated CNN Model)
🔍 Purpose
The Fear & Greed Index is a sentiment indicator that quantifies market emotion on a scale from 0 to 100, where:
0 represents Extreme Fear (capitulation, oversold conditions), and
100 represents Extreme Greed (euphoria, overbought conditions).
It helps traders assess whether the market is driven by fear (risk aversion) or greed (risk appetite) — giving a high-level view of potential turning points in market sentiment.
⚙️ How It Works in TradingView
Because TradingView cannot directly access CNN’s or alternative external sentiment feeds, this indicator simulates the Fear & Greed Index by analyzing in-chart technical data that reflect investor psychology.
It uses a multi-factor model, converting price and volume signals into a composite sentiment score.
🧩 Components Used (Simulated Metrics)
Category Metric Emotional Interpretation
Volatility ATR (Average True Range) High ATR = Fear, Low ATR = Greed
Momentum RSI + MACD Histogram Rising momentum = Greed, Falling = Fear
Volume Activity Volume Z-Score High positive deviation = Greed, Low = Fear
Trend Context SMA Regime Bias (50/200) Downtrend adds Fear penalty, Uptrend supports Greed
These elements are normalized into a 0–100 scale using percentile ranks (like statistical scoring) and then combined using user-adjustable weights.
⚖️ CNN-Style Calibration
The script follows CNN’s five sentiment bands for clarity:
Range Zone Colour Description
0–25 Extreme Fear 🔴 Red Panic, forced selling, capitulation risk
25–45 Fear 🟠 Orange Uncertainty, hesitation, early accumulation phase
45–55 Neutral ⚪ Gray Balanced sentiment, indecision
55–75 Greed 🟢 Light Green Optimism, trend continuation
75–100 Extreme Greed 💚 Bright Green Euphoria, risk of reversal
This structure aligns visually with CNN’s public gauge, making it easy to interpret.

[FGL] Stochastic ATR Trend IndicatorThis indicator:
Detects trend direction using ATR-based dynamic bands around SMA.
Generates buy/sell signals using Stochastic crossover conditions filtered by trend.
Colors candles to show trend direction.
Plots a visual “trend zone” band on the chart.
INPUT PARAMETERS:
Stochastic Length → Period for the stochastic oscillator.
Smooth K and Smooth D → Smoothing parameters for %K and %D lines.
ATR Length → Period used for SMA-based trend detection.
LOGIC FLOW
Determine trend using long ATR-based SMA channel.
Detect momentum change with Stochastic cross.
Confirm both momentum and price align with trend.
Generate buy/sell signal + change candle color.
STRATEGIC INTERPRETATION
Best use: Trend-following momentum entries.
Avoids: Countertrend false signals by filtering with trend value.
Signals:
Buy: In uptrend + bullish stochastic crossover.
Sell: In downtrend + bearish stochastic crossover.

Integrated Volatility Intelligence System (IVIS) AutoKVolMind™ AutoK — Integrated Volatility Intelligence System (IVIS)
IVIS AutoK
Author: © lfu
Public Description (for publication)
VolMind™ AutoK represents an institutional-grade open-source framework for adaptive volatility intelligence and probabilistic trade management.
This system fuses Kalman-inspired KAMA smoothing, CVD dynamics, Auto K-Means clustering, entropy-based regime analysis, and a Kolmogorov–Smirnov market normality test into a single modular platform.
Key Capabilities:
Adaptive ATR Stop Bands dynamically scale with volatility, entropy, and cluster variance.
Auto KMeans Intelligence automatically selects the optimal cluster count for price structure recognition (3–10 clusters).
Entropy Module quantifies structural uncertainty and information decay within price movement.
KS-Test Integration identifies non-normal distributions, signaling regime divergence and volatility inflection.
CVD Dynamics reveal real-time directional bias via cumulative volume delta.
MSI Composite Signal fuses multi-source indicators (ATR, CVD, entropy, clusters) to model market stress and adaptive risk.
Designed for forward-looking quant traders, IVIS serves as a volatility intelligence backbone for portfolio automation, volatility forecasting, and adaptive stop-loss scaling.
Fully open-source for research and applied strategy development. Not a financial advice. DYOR.
Volume Weighted Average True RangeThis indicator calculates a customizable version of the Average True Range (ATR), a tool for measuring market volatility. It enhances the standard ATR with volume weighting, a dual-smoothing process, normalization, and volatility pivot detection.
Key Features:
Volume Weighting: An option (Volume weighted) allows for volume to be incorporated into the volatility calculation. This provides a measure of "volume-adjusted" volatility that is more responsive to significant market activity.
Dual Smoothing Process: For noise reduction, the indicator employs a two-stage smoothing process. It first calculates a smoothed True Range (TR) over a user-defined period (TR Length) before applying the final ATR moving average (ATR Length & ATR Smooth).
Normalization (Percentage Volatility): An optional 'Normalize' mode calculates the ATR as a percentage of the price. This allows for consistent volatility comparison across different assets and over long time periods.
Volatility Pivot Detection: The indicator includes a built-in pivot detector that identifies significant turning points (highs and lows) in the ATR line itself, signaling potential shifts in volatility.
Note on Confirmation (Lag): Pivot signals are confirmed using a lookback method. A pivot is only plotted after the Pivot Right Bars input has passed. This is essential for ensuring the signal is non-repainting but introduces an inherent lag.
Multi-Timeframe (MTF) Capability:
MTF ATR Line: The ATR line itself can be calculated on a different timeframe, with standard options to handle gaps (Fill Gaps) and prevent repainting (Wait for...).
Limitation: The Pivot detection (Calculate Pivots) is disabled if a Higher Timeframe (HTF) is selected.
Integrated Alerts: Includes alerts that trigger when a new volatility pivot (high or low) is detected in the ATR line.
DISCLAIMER
For Informational/Educational Use Only: This indicator is provided for informational and educational purposes only. It does not constitute financial, investment, or trading advice, nor is it a recommendation to buy or sell any asset.
Use at Your Own Risk: All trading decisions you make based on the information or signals generated by this indicator are made solely at your own risk.
No Guarantee of Performance: Past performance is not an indicator of future results. The author makes no guarantee regarding the accuracy of the signals or future profitability.
No Liability: The author shall not be held liable for any financial losses or damages incurred directly or indirectly from the use of this indicator.
Signals Are Not Recommendations: The alerts and visual signals (e.g., crossovers) generated by this tool are not direct recommendations to buy or sell. They are technical observations for your own analysis and consideration.

QuantumFlow MTF SystemQuantumFlow MTF System © 2025
Multi-Timeframe Directional Flow & Volatility Alignment Engine
QuantumFlow MTF System is designed to synchronize volatility- and trend-based signals from multiple timeframes into a single, structured view of market flow.
Concept
The system evaluates confirmed Supertrend directions from several lower timeframes, then aggregates them into normalized bullish/bearish values. These values are combined with dual-layer EMA momentum filters to verify directional strength. The resulting matrix provides a precise snapshot of alignment across short- to medium-term market structures.
Unlike classical ATR-based systems, QuantumFlow employs multiple ATR layers with multiple deviation factors that have been extensively tested over the years.
This multi-ATR framework acts as an adaptive volatility filter, allowing each asset class to respond dynamically to its intrinsic volatility profile.
The result is a robust and consistent analytical engine capable of adapting to varying market conditions across assets and timeframes.
How It Works
- Confirmed Multi-Timeframe Supertrend:
Each timeframe calculates a close-confirmed Supertrend direction, preventing repainting and ensuring signal reliability.
- Multi-ATR Volatility Model:
Several ATR instances with distinct deviation multipliers define volatility thresholds that adjust sensitivity across market conditions.
- Dual EMA Structure:
Two independent EMA layers act as momentum validators to confirm or filter each Supertrend direction.
- Flow Totals Engine:
The script sums all directional states into a real-time ratio of bullish vs bearish conditions, visualized through color-coded totals.
- Adaptive Alerts:
Optional thresholds allow traders to receive alerts when directional imbalance reaches predefined intensity levels.
Use Cases
- Identify when multiple timeframes align in the same trend direction.
- Quantify the relative dominance of bullish or bearish pressure.
- Filter trades using adaptive multi-ATR volatility filters per asset type.
- Confirm entries by validating multi-timeframe directional consensus.
Chart Display
QuantumFlow displays a structured table showing the state of each analyzed timeframe and the current flow balance. Works seamlessly on any instrument and timeframe.
This invite-only indicator provides a systematic way to analyze directional flow alignment using a multi-ATR volatility engine combined with momentum synchronization across multiple timeframes.
---
Author’s Instructions:
To request access, please contact the author privately through the TradingView profile.
Volatility Resonance CandlesVolatility Resonance Candles visualize the dynamic interaction between price acceleration, volatility, and volume energy.
They’re designed to reveal moments when volatility expansion and directional momentum resonate — often preceding strong directional moves or reversals.
🔬 Concept
Traditional candles display direction and range, but they miss the energetic structure of volatility itself.
This indicator introduces a resonance model, where ATR ratio, price acceleration, and volume intensity combine to form a composite signal.
* ATR Resonance: compares short-term vs. long-term volatility
* Acceleration: captures the rate of price change
* Volume Energy: reinforces the move’s significance
When these components align, the candle color “resonates” — brighter, more intense candles signal stronger volatility–momentum coupling.
⚙️ Features
* Adaptive Scaling
Normalizes energy intensity dynamically across a user-defined lookback period, ensuring consistency in changing market conditions.
* Power-Law Transformation
Optional non-linear scaling (gamma) emphasizes higher-energy events while keeping low-intensity noise visually subdued.
* Divergence Mode
When enabled, colors can invert to highlight energy divergence from candle direction (e.g., bearish pressure during bullish closes).
* Customizable Styling
Full control over bullish/bearish base colors, transparency scaling, and threshold sensitivity.
🧠 Interpretation
* Bright / High-Intensity Candles → Strong alignment of volatility and directional energy.
Often signals the resonant phase of a move — acceleration backed by volatility expansion and volume participation.
* Dim / Low-Intensity Candles → Energy dispersion or consolidation.
These typically mark quiet zones, pauses, or inefficient volatility.
* Opposite-Colored Candles (if divergence mode on) → Potential inflection zones or hidden stress in the trend structure.
⚠️ Disclaimer
This script is for educational purposes only.
It does not constitute financial advice, and past performance is not indicative of future results. Always do your own research and test strategies before making trading decisions.

Volatility Dashboard (ATR-Based)Here's a brief description of what this indicator does:
- This measures volatility of currents based on ATR (Average True Range) and plots them against the smoothed ATR baseline (SMA of ATR for the same periods).
- It categorizes the market as one of the three regimes depending on the above-mentioned ratio:
- High Volatility (ratio > 1.2)
- Normal Volatility (between 0.8 and 1.2),
|- Low Volatility (ratio < 0.8, green)
- For each type of trading regime, Value Area (VA) coverage to use: for example: 60-65% in high vol trade regimes, 70% in normal trade regimes, 80-85% in low trade regimes
* What you’ll see on the chart:
- Compact dashboard in the top-right corner featuring:
- ATR (present, default length 20)
- ATR Avg (ATR baseline)
- The volatility regime identified based on the color-coded background and the coverage recommended for the VA.
Important inputs that can be adjusted:
- ATR Length (default 20) - “High/Low volatility thresholds” (default values: 1.2 – The VA coverage recommendations for each scheme (text) Purpose: - Quickly determine whether volatility is above/below average and adjust the coverage of the Value Area.
If you're using this for the GC1! Use 14 ATR Length, For ES or NQ Use Default Setting(20)

Golden Ladder – Louay Joha (Wave & Gann Hi/Lo + ATR R-Levels)Overview
Golden Ladder is a momentum-and-structure tool that detects three-bar ladder waves and filters them with a Gann Hi/Lo regime guide (SMA-based). When a valid wave aligns with the current Hi/Lo bias and passes optional market filters (ADX, RSI, and proximity to recent extremes), the script prints BUY/SELL n labels (n = wave index) and draws a complete Entry / SL / TP1–TP4 ladder using ATR-based risk units (R) or fixed caps—configured for clarity and consistency. The script also keeps the chart clean: the last trade remains fully drawn while historical groups are trimmed to compact “ENTRY-only” stubs.
Why these components together (originality)
Three-bar ladder captures short-term momentum structure (progressively higher highs/lows for buys; the reverse for sells).
Gann Hi/Lo (SMA of highs/lows with a directional state) acts as a regime filter, reducing counter-trend ladders.
ATR-based R ladder turns signals into an actionable plan: a volatility-aware SL and TP1–TP4 that scale across instruments/timeframes.
Smart Entry filters (ADX strength, RSI extremes, and distance from recent top/bottom using ATR buffers) seek to avoid low-quality, stretched entries.
Slim history keeps only a short ENTRY stub for prior groups, so the signal you just got is always the most readable.
This is not a mere mashup; each layer constrains the others to produce fewer, clearer setups.
How it works (high-level logic)
Regime (Gann Hi/Lo):
Compute SMA(high, HPeriod) and SMA(low, LPeriod).
Direction state HLv flips when the close crosses above/below its track; one unified Hi/Lo guide is plotted.
Ladder signal (structure + confirmation):
BUY ladder: three consecutive green bars with rising highs and rising lows and HLv == +1.
SELL ladder: mirror conditions with HLv == -1.
Signals evaluate intrabar and are controlled by Smart Entry filters (ADX/RSI/extreme checks).
Risk ladder (R-based or capped):
Default: risk = ATR(atr_len) × SL_multiple and TPs in R.
Optional fixed caps by timeframe (e.g., M1/M5) using USD per point.
Longs: SL = entry – risk; TPi = entry + (Ri × risk).
Shorts: SL = entry + risk; TPi = entry – (Ri × risk).
All levels auto-reflow to the right as bars print.
Chart hygiene:
The latest trade shows ENTRY/SL/TP1–TP4 fully.
Older trades are automatically trimmed (only a short ENTRY line remains, with optional label).
Alerts:
BUY – Smart Entry (Tick) & SELL – Smart Entry (Tick) fire on live-qualified signals.
You can connect alerts to your automation, respecting your broker’s risk controls.
Inputs (English summary of UI)
Label settings: label size; ATR-based vs fixed-tick offsets; leader line width/transparency; horizontal label shift.
Gann Hi/Lo: HIGH Period (HPeriod), LOW Period (LPeriod).
Market filters: ADX (length, smoothing, minimum), RSI (length + caps), recent extremes (lookback + ATR buffer).
Entry/SL/TP Levels: TP1–TP4 (R), label right-shift, show last-trade prices on labels.
Fixed SL Caps: per-timeframe caps (M1/M5) via USD per point.
How to use
Apply on your instrument/timeframe; tune H/L periods and filters to your market (e.g., XAUUSD on M1/M5).
Favor signals aligned with the Hi/Lo regime; tighten filters (higher ADX, stricter RSI caps) to reduce noise.
Choose ATR-Risk or fixed caps depending on your preferences.
The drawing policy ensures the most recent trade remains front-and-center.
Notes & limitations
Signals can evaluate intrabar; MA-based context is inherently lagging.
ATR-based ladders adapt to volatility; extreme spikes can widen risk.
This is a technical analysis tool, not financial advice.
ATR x Trend x Volume SignalsATR x Trend x Volume Signals is a multi-factor indicator that combines volatility, trend, and volume analysis into one adaptive framework. It is designed for traders who use technical confluence and prefer clear, rule-based setups.
🎯 Purpose
This tool identifies high-probability market moments when volatility structure (ATR), momentum direction (CCI-based trend logic), and volume expansion all align. It helps filter out noise and focus on clean, actionable trade conditions.
⚙️ Structure
The indicator consists of three main analytical layers:
1️⃣ ATR Trailing Stop – calculates two adaptive ATR lines (fast and slow) that define volatility context, trend bias, and potential reversal points.
2️⃣ Trend Indicator (CCI + ATR) – uses a CCI-based logic combined with ATR smoothing to determine the dominant trend direction and reduce false flips.
3️⃣ Volume Analysis – evaluates volume deviations from their historical average using standard deviation. Bars are highlighted as medium, high, or extra-high volume depending on intensity.
💡 Signal Logic
A Buy Signal (green) appears when all of the following are true:
• The ATR (slow) line is green.
• The Trend Indicator is blue.
• A bullish candle closes above both the ATR (slow) and the Trend Indicator.
• The candle shows medium, high, or extra-high volume.
A Sell Signal (red) appears when:
• The ATR (slow) line is red.
• The Trend Indicator is red.
• A bearish candle closes below both the ATR (slow) and the Trend Indicator.
• The candle shows medium, high, or extra-high volume.
Only one signal can appear per ATR trend phase. A new signal is generated only after the ATR direction changes.
❌ Exit Logic
Exit markers are shown when price crosses the slow ATR line. This behavior simulates a trailing stop exit. The exit is triggered one bar after entry to prevent same-bar exits.
⏰ Session Filter
Signals are generated only between the user-defined session start and end times (default: 14:00–18:00 chart time). This allows the trader to limit signal generation to active trading hours.
💬 Practical Use
It is recommended to trade with a fixed risk-reward ratio such as 1 : 1.5. Stop-loss placement should be beyond the slow ATR line and adjusted gradually as the trade develops.
For better confirmation, the Trend Indicator timeframe should be higher than the chart timeframe (for example: trading on 1 min → set Trend Indicator timeframe to 15 min; trading on 5 min → set to 1 hour).
🧠 Main Features
• Dual ATR volatility structure (fast and slow)
• CCI-based trend direction filtering
• Volume deviation heatmap logic
• Time-restricted signal generation
• Dynamic trailing-stop exit system
• Non-repainting logic
• Fully optimized for Pine Script v6
📊 Usage Tip
Best results are achieved when combining this indicator with additional technical context such as support-resistance, higher-timeframe confirmation, or market structure analysis.
📈 Credits
Inspired by:
• ATR Trailing Stop by Ceyhun
• Trend Magic by Kivanc Ozbilgic
• Heatmap Volume by xdecow

SuperTrend Cyan — Split ST & Triple Bands (A/B/C)SuperTrend Cyan — Split ST & Triple Bands (A/B/C)
✨ Concept:
The SuperTrend Cyan indicator expands the classical SuperTrend logic into a split-line + triple-band visualization for clearer structure and volatility mapping.
Instead of a single ATR-based line, this tool separates SuperTrend direction from volatility envelopes (A/B/C), providing a layered view of both regime and range compression.
✨ The design goal:
Preserve the simplicity of SuperTrend
Add volatility context via multi-band envelopes
Provide a compact MTF (Multi-Timeframe) summary for broader trend alignment
✨ How It Works
1. SuperTrend Core (Active & Opposite Lines)
Uses ATR-based bands (Factor × ATR-Length).
Active SuperTrend is plotted according to current regime.
Opposite SuperTrend (optional) shows potential reversal threshold.
2. Triple Band System (A/B/C)
Each band (A, B, C) scales from the median price (hl2) by different ATR multipliers.
A: Outer band (wider, long-range context)
B: Inner band (mid-range activity)
C: Core band (closest to price, short-term compression)
Smoothness can be controlled with EMA.
Uptrend fills are lime-toned, downtrend fills are red-toned, with adjustable opacity (gap intensity).
3. Automatic Directional Switch
When the regime flips from up → down (or vice versa), the overlay automatically switches between lower and upper bands for a clean transition.
4. Multi-Timeframe SuperTrend Table
Displays SuperTrend direction across 5m, 15m, 1h, 4h, and 1D frames.
Green ▲ = Uptrend, Red ▼ = Downtrend.
Useful for checking cross-timeframe trend alignment.
✨ How to Read It
Green SuperTrend + Lime Bands
- Uptrend regime; volatility expanding upward
Red SuperTrend + Red Bands
- Downtrend regime; volatility expanding downward
Narrow gaps (A–C)
- Low volatility / compression (potential squeeze)
Wide gaps
- High volatility / active trend phase
Opposite ST line close to price
- Early warning for regime transition
✨ Practical Use
Identify trend direction (SuperTrend color & line position).
Assess volatility conditions (band width and gap transparency).
Watch for MTF alignment: consistent up/down signals across 1h–4h–1D = strong structural trend.
Combine with momentum indicators (e.g., RSI, DFI, PCI) for confirmation of trend maturity or exhaustion.
✨ Customization Tips
ST Factor / ATR Length
- Adjust sensitivity of SuperTrend direction changes
Band ATR Length
- Controls overall smoothness of volatility envelopes
Band Multipliers (A/B/C)
- Define how wide each volatility band extends
Gap Opacity
- Affects visual contrast between layers
MTF Table
- Enable/disable multi-timeframe display
✨ Educational Value
This script visualizes the interaction between trend direction (SuperTrend) and volatility envelopes, helping traders understand how price reacts within layered ATR zones.
It also introduces a clean MTF (multi-timeframe) perspective — ideal for discretionary and system traders alike.
✨ Disclaimer
This indicator is provided for educational and research purposes only.
It does not constitute financial advice or a trading signal.
Use at your own discretion and always confirm with additional tools.
───────────────────────────────
📘 한국어 설명 (Korean translation below)
───────────────────────────────
✨개념
SuperTrend Cyan 지표는 기존의 SuperTrend를 확장하여,
추세선 분리(Split Line) + 3중 밴드 시스템(Triple Bands) 으로
시장의 구조적 흐름과 변동성 범위를 동시에 시각화합니다.
단순한 SuperTrend의 강점을 유지하면서도,
ATR 기반의 A/B/C 밴드를 통해 변동성 압축·확장 구간을 직관적으로 파악할 수 있습니다.
✨ 작동 방식
1. SuperTrend 코어 (활성/반대 라인)
ATR×Factor를 기반으로 추세선을 계산합니다.
현재 추세 방향에 따라 활성 라인이 표시되고, “Show Opposite” 옵션을 켜면 반대편 경계선도 함께 보입니다.
2. 트리플 밴드 시스템 (A/B/C)
hl2(중간값)를 기준으로 ATR 배수에 따라 세 개의 밴드를 계산합니다.
A: 외곽 밴드 (가장 넓고 장기 구조 반영)
B: 중간 밴드 (중기적 움직임)
C: 코어 밴드 (가격에 가장 근접, 단기 변동성 반영)
EMA 스무딩으로 부드럽게 조정 가능.
업트렌드 구간은 라임색, 다운트렌드는 빨간색 음영으로 표시됩니다.
3. 자동 전환 시스템
추세가 전환될 때(Up ↔ Down), 밴드 오버레이도 자동으로 교체되어 깔끔한 시각적 구조를 유지합니다.
4. MTF SuperTrend 테이블
5m / 15m / 1h / 4h / 1D 프레임별 SuperTrend 방향을 표시합니다.
초록 ▲ = 상승, 빨강 ▼ = 하락.
복수 타임프레임 정렬 확인용으로 유용합니다.
✨ 해석 방법
초록 SuperTrend + 라임 밴드
- 상승 추세 및 확장 구간
빨강 SuperTrend + 레드 밴드
- 하락 추세 및 확장 구간
밴드 폭이 좁음
- 변동성 축소 (스퀴즈)
밴드 폭이 넓음
- 변동성 확장, 추세 강화
반대선이 근접
- 추세 전환 가능성 높음
✨ 활용 방법
SuperTrend 색상으로 추세 방향을 확인
A/B/C 밴드 폭으로 변동성 수준을 판단
MTF 테이블을 통해 복수 타임프레임 정렬 여부 확인
RSI, DFI, PCI 등 다른 지표와 함께 활용 시, 추세 피로·모멘텀 변화를 조기에 파악 가능
✨ 교육적 가치
이 스크립트는 추세 구조(SuperTrend) 와 변동성 레이어(ATR Bands) 의 상호작용을
시각적으로 학습하기 위한 교육용 지표입니다.
또한, MTF 구조를 통해 시장의 “위계적 정렬(hierarchical alignment)”을 쉽게 인식할 수 있습니다.
✨ 면책
이 지표는 교육 및 연구 목적으로만 제공됩니다.
투자 판단의 책임은 사용자 본인에게 있으며, 본 지표는 매매 신호를 보장하지 않습니다.
