Adaptive Zero Lag EMA v2 (Strategy w/ Backtest Date Range)This is a modified strategy including Date Range Selection for dasanc's incredible "Adaptive Zero Lag EMA v2":
The Original:
Backtest

Fisher Transform Multi-Timeframe (Backtest)This is the Backtest Strategy for mortdiggiddy's "Fisher Transform Multi-Timeframe"
For more details check his study:

[BACKTEST] CMYK-RMI-TRIPLE IIThis is the same previous script but without the calculation of the Deribit index (for BITMEX users for example) that can give problems due to no connection with any of the 6 exchanges. Now use 'close' as source.
Settings for BTCUSD or XBTUSD
Best time frame: 5 minutes

[BACKTEST] CMYK-RMI-TRIPLEScript based on 3 RMI and the opening of long / short 'pyramiding' positions.
XBT:USD on BITMEX or BTC:USD on DERIBIT
Includes the calculation of the DERIBIT Index but can be used for any Crypto, the always overloaded BITMEX or even Forex, ...
Best timeframe: 5 minutes. A 5-minutes chart extended to the minimum is equal to a 1H chart.
¡NO REPAINT! : Alerts 'Once per bar'
It has take profit and it's so good that it doesn`t need Stop Loss
Original idea by MVPMC.

Cyatophilum Ichimoku Small TimeFrames [BACKTEST]A script for daytraders trading small timeframes.
Currently in developpement.
If you want to try it send me a PM, and give a like to receive updates.

Bearish Harami Backtest This is a bearish reversal pattern formed by two candlesticks in which a short
real body is contained within the prior session's long real body. Usually the
second real body is the opposite color of the first real body. The Harami pattern
is the reverse of the Engulfing pattern.
WARNING:
- For purpose educate only
- This script to change bars colors.

Multiple MACD RSI simple strategySimple strategy script I've had for a while but looks like I never published.
Although it is one of my most simple it seems to have the best profitability. It is pretty rough though. the Stoch RSI has only a little weight to the trade trigger. I'll refine it more over time or you can by all means. Basically the Stoch RSI current K line has to be OVER 40 to trigger a SELL. It has no effect on buy side.
The triggers are roughly as follows:
Year - since so many assets have gone 2x, 3x, 10x+ since 2013 having a strategy that earns a 500% return from 2013 to now isn't that good if buy-and-holding would have got you 800%. This eliminates some of that noise and makes it a little easier to quickly gauge success. So buy/sell trigger need a value of greater or equal to 2018 (default)
MACD 1 - First MACD (short) needs to indicate greater than 0 to buy or less than 0 to sell.
MACD 2 - Same as MACD1 but for second MACD set (long)
Uptrend - Latest close + high divided by last periods close + high needs to be grater than 1. So if latest is 34.30 close and 34.60 high and previous interval is 34.80 close and 34.82 high, that is 0.99 and will not trigger a buy trade.
Downtrend - Same thing but close + low and less than 1.
This script/strategy is pretty rough but if there is interest I'll polish it more since it is a pretty solid but simple strategy for most assets.

Cyatophilum Crypto Trader 1H [BACKTEST]A strategy specificaly engineered for trading altcoins.
Crypto pairs configurations already available: ADA/BTC, BNB/BTC, EOS/BTC, ETH/BTC, ICX/BTC, NEO/BTC, TRX/BTC, XLM/BTC, XMR/BTC, XRP/BTC.
Note: You can use this backtest version for finding the best configuration for your pair if it isn't in the list. I will also be there to help you.
How it Works
The strategy is based upon two Exponential Moving Averages, it captures trend reversals, fakeouts, has a stop loss option and more (see the presentation page for input parameters description).
It should be used in 1 Hour timeframe and on any pair of cryptocurrency.
Backtest
The Net Profit (Gross profit - Gross loss) is calculated with a commission of 0.05% on each order.
Each trade is made with 100 % of equity
Get the indicator today!
Purchase on my website : blockchainfiesta.com

RSC Trend Trading Strategy v1.0Ready Set Crypto Trend Trading Back-testing Strategy v1.0
This is a backtesting strategy for those who are familiar with Doc Severson's (Ready Set Crypto) Trend Trading Class offered at Ready Set Crypto . It is published with permission.
I highly recommend that you attend the class to understand this strategy and use this to your advantage. There is way more than just some indicators to utilise this trading strategy successfully.
Please also see the matching indicator for this strategy: Ready Set Crypto Trend Trading Indicator .
Buy and Sell Calls are based on the following:
An Upper Donchian Channel of 20 days (default) or more, used to indicate buy signals
A Lower Donchian Channel of 10 days (default) or more, used to indicate exit signals
A 50 day Simple Moving Average (for entry filtering)
A 200 day Simple Moving Average (for entry filtering)
How to do back-testing with this:
Once you add this strategy to your chart, go to the " Strategy Tester " section at the bottom of the screen to see it's performance.
You will need to configure the strategy (just like you'd configure any indicator) to tailor it to your specific scenarios.
Note following:
TradingView does not support BTC, ETH, etc as currencies, so BTC and other trading pairs are not available for back-testing; You will have to use USD pairs
The backtesting will apply to your chart's time frame (candle times) - use daily time candles as the starting point
You will need to tailor the " Input " and " Properties " options (click on the little gear icon) to adjust to suit your needs/scenarios
The default settings are as follows:
Backtest the current chart/ticker for the period of 2016 to 2020,
With a single position of US$1000 and a 0.1% commission (no pyramiding, i.e. multiple buy entries),
By entering a single position (buy) when the price is above SMA 50 and 200 and a candle high touches DC 20,
And exiting the position when a candle low touches DC 10.
Look under the " Strategy Tester " pane for the back-testing overview, performance and list of trades. Or if you are looking at the Published Idea , the back-testing results are displayed at the bottom of the page.
Please like, Share and Comment, if you like this indicator.
Warning
The Buy and Sell calls are meaningless and must not be auctioned without a thorough understanding of this trading strategy and the full consideration of the entry and exit conditions.
Please use this indicator at your own risk. The publisher does not accept any responsibility for its performance or any implications.

Cyatophilum Bands Pro Trader [ALERTSETUP]A Multi Timeframe Indicator for trading cryptocurrency and other assets
Presentation Page
HOW IT WORKS
The indicator mainly consists of what I call "Cyatophilum Bands", who can be used as either Trend lines or Support/Resistance. The color indicates the current Trend. Buy and Sell signals trigger upon Trend Reversal Breakouts.
These alerts can be used with automated trading systems. They correspond to the big green and red triangles.
For daytraders, there is an option to activate Long and Short signals during a Trend. It can also be used as re-entry points if you missed a major breakout. They correspond to the small triangles.
If you trade BTCUSD, I created an option that will allow you to configure your script on any timeframe from 5M to 1D in one click.
If you do not trade BTCUSD, you can use a custom setup (See the Presentation Page )
This indicators also works on other assets such as Oil Futures or other cryptocurrency pairs such as ETH/BTC.
The script comes with two versions:
The alert Setup is used creating automated alerts
The Backtest Version that will help you see the results on past data. You can choose to enable or disable shorts results.
HOW TO USE
Once I granted you access, you will receive a notification. Add both indicators to the chart. Use the Backtest version to find the best configuration (BTCUSD is already pre-configured. I post configurations on my Discord Server, and you can ask me for help). Then apply this configuration to the Alert Setup script. Finally, create the alerts.
Before you ask, the script does not repaint. I made sure to not use the security function which I know is bugged right now.
Get the indicator today !
Purchase on my website
NOTE
If you purchase the Indicator you will get access to my past indicators as well!

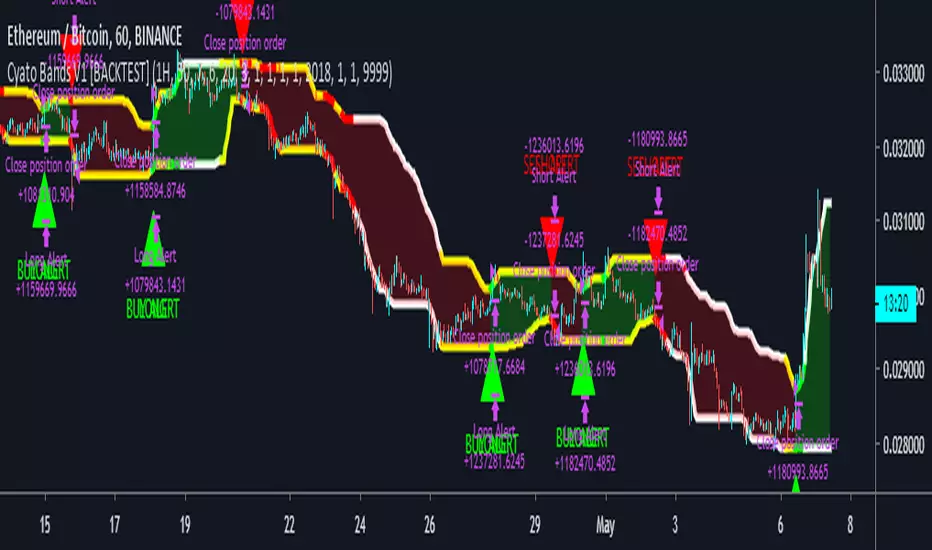
Cyatophilum Bands Pro Trader [BACKTEST]A Multi Timeframe Indicator for trading cryptocurrency and other assets
Presentation Page
HOW IT WORKS
The indicator mainly consists of what I call "Cyatophilum Bands", who can be used as either Trend lines or Support/Resistance. The color indicates the current Trend. Buy and Sell signals trigger upon Trend Reversal Breakouts.
These alerts can be used with automated trading systems. They correspond to the big green and red triangles.
For daytraders, there is an option to activate Long and Short signals during a Trend. It can also be used as re-entry points if you missed a major breakout. They correspond to the small triangles.
If you trade BTCUSD, I created an option that will allow you to configure your script on any timeframe from 5M to 1D in one click.
If you do not trade BTCUSD, you can use a custom setup (See the Presentation Page )
This indicators also works on other assets such as Oil Futures or other cryptocurrency pairs such as ETH/BTC.
The script comes with two versions:
The alert Setup is used creating automated alerts
The Backtest Version that will help you see the results on past data. You can choose to enable or disable shorts results.
HOW TO USE
Once I granted you access, you will receive a notification. Add both indicators to the chart. Use the Backtest version to find the best configuration (BTCUSD is already pre-configured. I post configurations on my Discord Server, and you can ask me for help). Then apply this configuration to the Alert Setup script. Finally, create the alerts.
Before you ask, the script does not repaint. I made sure to not use the security function which I know is bugged right now.
Get the indicator today !
Purchase on my website
NOTE
If you purchase the Indicator you will get access to my past indicators as well!
HMA EABy default, the strategy works best on 1h timeframe. In theory, it should run well on any timeframe, but you will absolutely need to adjust the Hull Resolution. I recommend starting with 4x the current view (aka, if you are using 5m candles, set the resolution to 20min, which is 4 * 5m).
The settings are pretty self explanatory:
Start Month - Month of the year to begin backtest (automatically beings at 1st of month)
Risk Per Trade (%) - How much of your equity to risk on each trade.
Leverage - Amount of buying power/Margin you have available
Loss (pips) - Distance in pips from the entry to place Stop Loss
Profit (pips) - Distance in pips from entry to place target Take Profit
Trigger Trail (%) - Distance in percentage from entry to begin a trailing Stop Loss
Trail Dist. (pips) - Offset distance of trailing Stop Loss
Hull Res. (min) - Length of candle in minutes to use when calculating the HMA
Hull Period (bars) - Smoothing period for HMA

Bullish Engulfing Backtest This is a bullish reversal pattern formed by two candlesticks. Following a downtrend,
the first candlestick is a down candlestick which is followed by an up candlestick
which has a long real body that engulfs or contains the real body of the prior bar.
The Engulfing pattern is the reverse of the Harami pattern.
WARNING:
- For purpose educate only
- This script to change bars colors.

Bearish Engulfing Backtest This is a bearish candlestick reversal pattern formed by two candlesticks.
Following an uptrend, the first candlestick is a up candlestick which is
followed by a down candlestick which has a long real body that engulfs or
contains the real body of the prior bar. The Engulfing pattern is the reverse
of the Harami pattern.
WARNING:
- For purpose educate only
- This script to change bars colors.

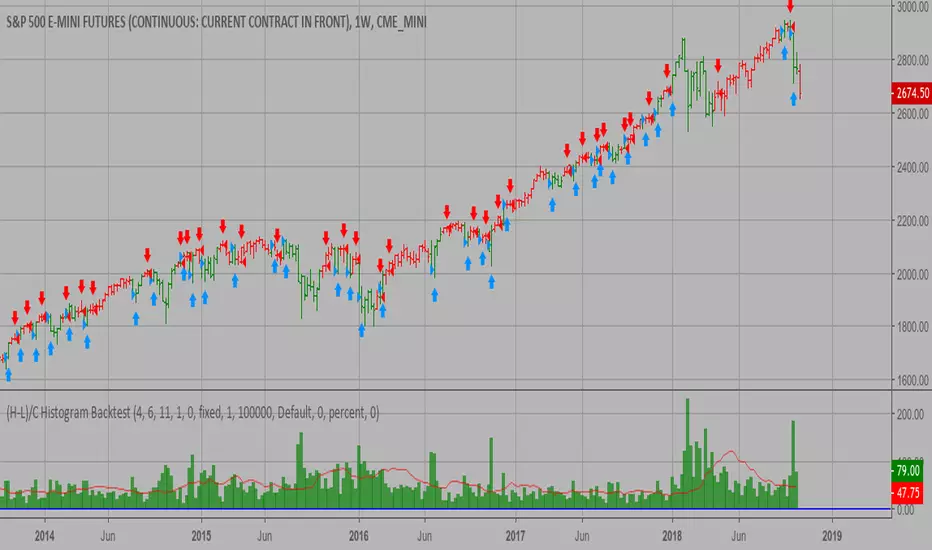
(H-L)/C Histogram Backtest This histogram displays (high-low)/close
Can be applied to any time frame.
WARNING:
- For purpose educate only
- This script to change bars colors.
CMO & WMA Backtest ver 2.0 This indicator plots Chandre Momentum Oscillator and its WMA on the
same chart. This indicator plots the absolute value of CMO.
The CMO is closely related to, yet unique from, other momentum oriented
indicators such as Relative Strength Index, Stochastic, Rate-of-Change,
etc. It is most closely related to Welles Wilder?s RSI, yet it differs
in several ways:
- It uses data for both up days and down days in the numerator, thereby
directly measuring momentum;
- The calculations are applied on unsmoothed data. Therefore, short-term
extreme movements in price are not hidden. Once calculated, smoothing
can be applied to the CMO, if desired;
- The scale is bounded between +100 and -100, thereby allowing you to clearly
see changes in net momentum using the 0 level. The bounded scale also allows
you to conveniently compare values across different securities.

Trend Trader Bands Backtest This is plots the indicator developed by Andrew Abraham
in the Trading the Trend article of TASC September 1998
It was modified, result values wass averages.
And draw two bands above and below TT line.

Cyatophilum Ichimoku Oscillator [BACKTEST][STRATEGY]An Automated Strategy based on Ichimoku Cloud. Works on any timeframe and market.
Backtest is done using the largest period TradingView has to offer for 1H. Net profit is calculated using the Strategy Tester, with only long entries at Green triangles and exits at red triangles. Profit can be greater if you short Sell signals (red triangles). Commission used is 0.05%.
This strategy is on my website. You can get access if you purchase the Cyatophilum Indicators. blockchainfiesta.com
The Alert Setup version is here :
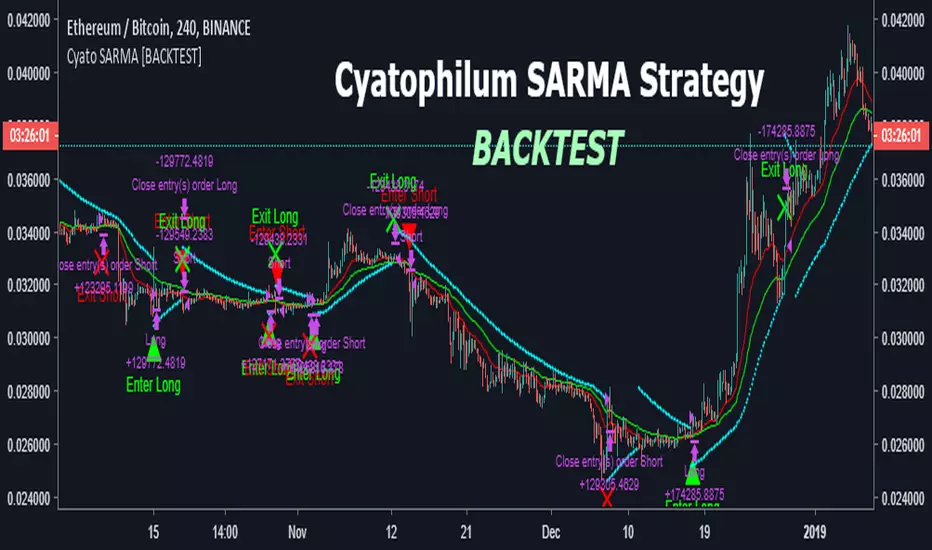
Cyatophilum SAR-MA Strategy [BACKTEST]An Automated Strategy based on Parabolic SAR and EMAs. Works on any timeframe and market.
Backtest is done using the largest period TradingView has to offer for 1H. Net profit is calculated using the Strategy Tester, with only long entries at Green triangles and exits at red triangles. Profit can be greater if you short Sell signals (red triangles). Commission used is 0.05%.
This strategy is going to be on my website later because it was commissioned by a customer and I had to publish it quickly. You can get access if you purchase the Cyatophilum Indicators. blockchainfiesta.com
I will publish an Alert Setup version soon.
Ichimoku Backtest Ichimoku Strategy
You can change long to short in the Input Settings
WARNING:
- For purpose educate only
- This script to change bars colors.

Ergotic MACD Strategy [forked from HPotter]Ergotic MACD Strategy forked from HPotter
In addition to this fine script you will find some additional features:
- Backtester
- Alerts
- Filters: RSI, MFI, Price trend
- Trailing Stop Loss
- Other minor adjustments

Absolute Price Oscillator (APO) Backtest 2.0 The Absolute Price Oscillator displays the difference between two exponential
moving averages of a security's price and is expressed as an absolute value.
How this indicator works
APO crossing above zero is considered bullish, while crossing below zero is bearish.
A positive indicator value indicates an upward movement, while negative readings
signal a downward trend.
Divergences form when a new high or low in price is not confirmed by the Absolute Price
Oscillator (APO). A bullish divergence forms when price make a lower low, but the APO
forms a higher low. This indicates less downward momentum that could foreshadow a bullish
reversal. A bearish divergence forms when price makes a higher high, but the APO forms a
lower high. This shows less upward momentum that could foreshadow a bearish reversal.
You can change long to short in the Input Settings
WARNING:
- For purpose educate only
- This script to change bars colors.
