QFL bull bypassThis bypass indicator triggers plots 1 when the price is above the QFL base.
This can be used as a "bypass" by a consumer indicator that can skip trades when the bypass is triggering.
You can use it for long and short strategies, to prevent using buy or sell signals in areas were the price is either overextended.
QFL works better in 1, 2 or 4 hours timeframes.
Backtest

Inverse Fisher Transform on RSI for backtest w/alertsThis version of the Inverse Fisher Transform on RSI comes with support for
1) Backtesting with Gavin's backtest script
2) Bypass, you can use another indicator to pause buy signals from this indicator. Just create another indicator that plots "1" whenever you want to activate the bypass on the IFTRSI signal.
3) Independent buy and sell level thresholds. Some tokens perform better with a higher sell level, even levels as high as 0.996, sometimes the buy level can also be relaxed to even 0.6 and get incredible results on the 5 minute chart.
4) alerts for Buy and Sell signals
Make sure you add Gavin's backtest and select external signal and this indicator as the source.

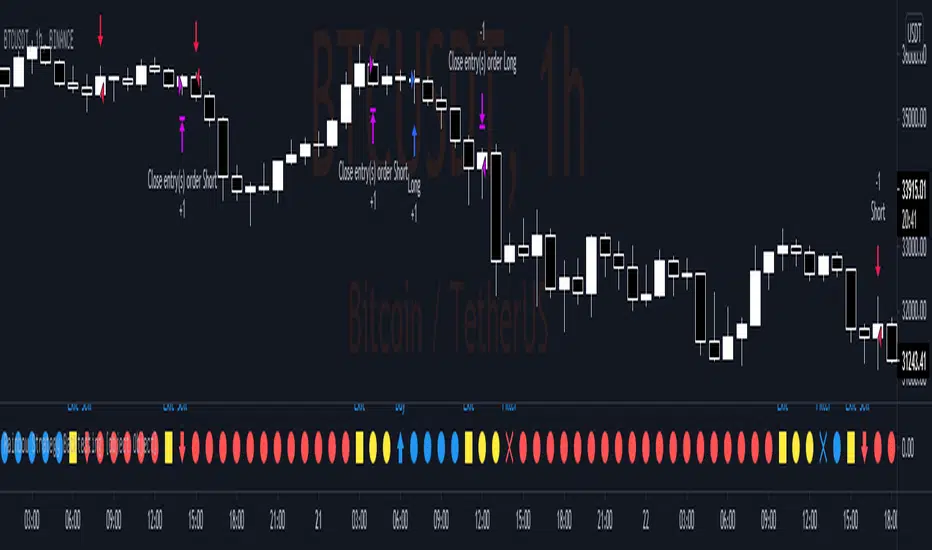
TV signal for DCA backtestThis script allows you to backtest Trading View's "Technical Ratings" (Buy, Strong buy, Sell, Strong Sell) using Gavin's backtest script.
To use it add the backtest script to the chart together with this script and then from the back test settings connect the external indicator. You should select "TV Signal" as the source.
Backtesting works best on the 5m chart, but you can still change this script from its settings to higher timeframes.
Encoding
Buy is 1
Strong Buy is 2
Sell is -1
Strong Sell is -2
In the backtest script you can decide which rating you want to use for open deal and which one for close deal.
For example, if you were backtesting a long bot you could enter a long position when TV signal is Buy (1) and close the deal when TV signal is Sell (-1).
You have the full flexibility to decide which technical rating to use for your backtesting.
Enjoy!

Smart AlertsThis indicator provides back-tested signals and alerts from multiple technical indicators.
No more guessing whether or not you should trust an indicator. See your indicators' past performance at a glance.
No more false alarms. Disable re-painting of signals.
When multiple indicators overlap, a Confluence indicator will print (large triangle). With your settings properly tuned, this will show a HIGH probability of a move.
Current Signal/Alert Options (more to come):
RSI Oversold
RSI Overbought
EMA Crossing Up
EMA Crossing Down
Buy Signal Confluence
Sell Signal Confluence
Instructions:
-Enable/disable individual indicators so you can fine tune one at a time
-Adjust the indicator's settings
-Adjust your trade parameters (Max Wait, Take Profit %). Signals that would have given the desired profit in the time allowed will be painted orange.
-Repeat this process with each indicator until you're satisfied
-Set-up alerts

Smart EMA SignalsThis indicator starts by plotting each time the price action crosses above or below the EMA, of which you can tune the timeframe and duration.
It then takes it a step further and plots whether or not that indicator would have given you a profitable trade, of which you can also tune the parameters (Max wait time, and % Profit).
Once you have your EMA tuned to your liking, set up alerts to notify you of a golden opportunity.

QFL single TF with alertsBacktesting compatible QFL pine script w/alerts
This version of QFL was made based on this one:
From author:
www.tradingview.com
I made the following additions according to my requirements:
- I need to use pine script 4
- I needed to avoid repainting issues so I'm not calling directly security, I'm using the wrapper function.
- There might be still repainting issues when you use "max base age" which uses the function "barssince" so be careful, you can disable it by setting its value to zero.
- Alerts so I can use it for automated trading and bots
- In order to make this signal compatible with the backtest script there's an option provided in the settings. If you enable this option this indicator will plot 1 whenever there's a BUY signal. This will allow the backtest to pick the "QFL Buy" from external indicator so it can perform the backtest.
I recommend some of these settings to start playing with the chart in 15 min / QFL in 1, 2 or 4 hours.
The higher the TF the more conservative.
QFL with 3.5% is pretty popular but you can try higher QFL percentage settings for a more conservative approach.

Rainbow Strategy BacktestingRainbow Strategy Backtesting base on "Rainbow Moving Average" Strategy as below:
1.Rainbow Moving Average setup
- Source: source of 1st MA
- Type: SMA/EMA
- Period: period of 1st MA
- Displacement: period of 2nd MA to 7th MA with source is previous MA
2.Trend Define
- Up Trend: Main MA moving at the top of Rainbow
- Down Trend: Main MA moving at the bottom of Rainbow
- Sideway: Main MA moving between the top and the bottom of Rainbow
3.Signal
- Buy Signal: When Rainbow change to Up Trend.
- Sell Signal: When Rainbow change to Down Trend.
- Exit: When Rainbow change to Sideway.
4.RSI Filter
- "Enable": Only signals have 1st RSI moving between Overbought and Oversold and 2nd RSI moving outside Middle Channel are accepted.
- The filter may help trader avoid bull trap, bear trap and choppy market.
5.Backtesting Infomation
- Ticker: BTCUSDT
- Timeframe: H1
- Rainbow parameter:
+ Source: hlc3
+ Type: SMA
+ Period: 12
+ Displacement: 3
- RSI Filter parameter:
+ Enable
+ 1st RSI filter: period 12, overbought 65, oversold 35
+ 2nd RSI filter: period 9, upper middle 56, lower middle 44
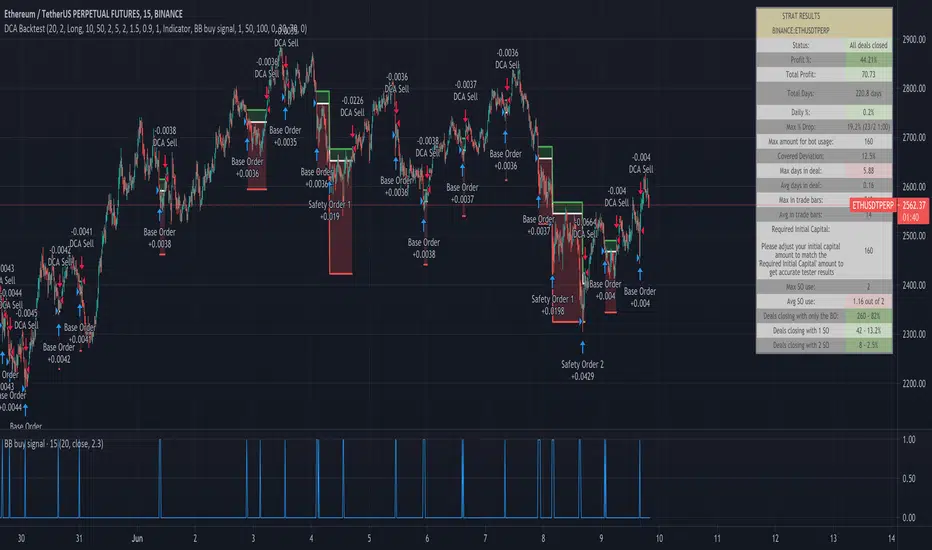
TTP Gavin's DCA BacktestPurpose:
The DCA Backtest script was designed to backtest the performance of any indicator using DCA bots.
"Open Deal ASAP" Deal Start Condition:
This script offers "open deal ASAP" deal start condition which will continuously open new deals. IT will wait for the current deal to close before opening a new one.
"Script" Deal Start Condition:
If you select the "Script" deal start condition we provide Bollinger Bands as an example. You can tweak the BB parameters from the indicator settings menu.
"Indicator" Deal Start Condition:
The third option is "Indicator". For this option to work you must have an indicator that plots a unique value that can be recognised as a BUY signal.
We recommend that your indicator plots 1 when it should buy and 0 when there's no signal.
Once you have in the same chart your indicator and your DCA backtest it's time to hook them up. For that follow these steps:
1) select "Indicator" as deal start condition
2) select your indicator from the list as "deal start source"
3) If you are following our recommendation then use 1 as "deal start value" so it can tell the DCA backtest when to open a deal. Make sure that your indicator only plots 0 or 1 so the DCA backtest can distinguish the BUY signal appropriately.
Limitations:
Each time you make changes and save your external indicator while you are backtesting, you will have to hook up the indicator again with the DCA backtest in the settings.
To avoid this, add as many parameters as you need to change in the external indicator so in that way you won't need to save changes to it and therefore will manage to avoid having to hook up the indicator with the DCA backtest.
Backtest strategy Iris V0.3Backtesting strategy win 2 filters EMA and RSI on diffrent time frames
Recommanded for scalping only (1m Tile frame)

Study Backtester [MS]Backtest your study like a strategy with our Study Backtester. Visualize your script's performance directly on the chart.
Simple to use, copy-paste a few lines of code (shown below) into your script, then set your script as input to the Study Backtester.
Visualize how your script performs against buy-and-hold over time, and get a nice print out of stats.
Settings
Set your buy and sell signal inputs
Add a stop loss
Choose normal or trailing stop loss
Choose the start date and time for backtesting
Set trading commissions
Use leverage or not
Set carry cost for leveraged trades
Version 1
Only supports buy-sell-buy-sell alternating signals. Any non-alternating signals will be ignored.
Testing begins with 1 share of the asset at your first buy signal.
Things To Note
This cannot enter or exit mid-candle. With the exception of the stop loss feature, which will calculate exits at the exact stop price.
Stops are not treated as stop-orders, but as market-exists at the stop (or trailing stop) price.
This DOES NOT take into account any loss of funds due to liquidation if price goes against you in a margin position.
Short positions are not currently supported.
Only `study` scripts are supported
How To Use
1) Add the following to the bottom your study's code.
//------------------------------------------------------------------------------
// FOR BACKTESTER
plot(buy ? 1 : sell ? -1 : na, title="Signals", display=display.none, editable=false)
2) Make sure `buy` and `sell` variables are assigned appropriately according to your strategy.
3) Add both your study and this script to your chart.
4) Set the "Signals Plot" setting of this script to: : Signals
5) Adjust this script's settings (start date, commission, stoploss, etc) as necessary.
PM us with any questions about this script.

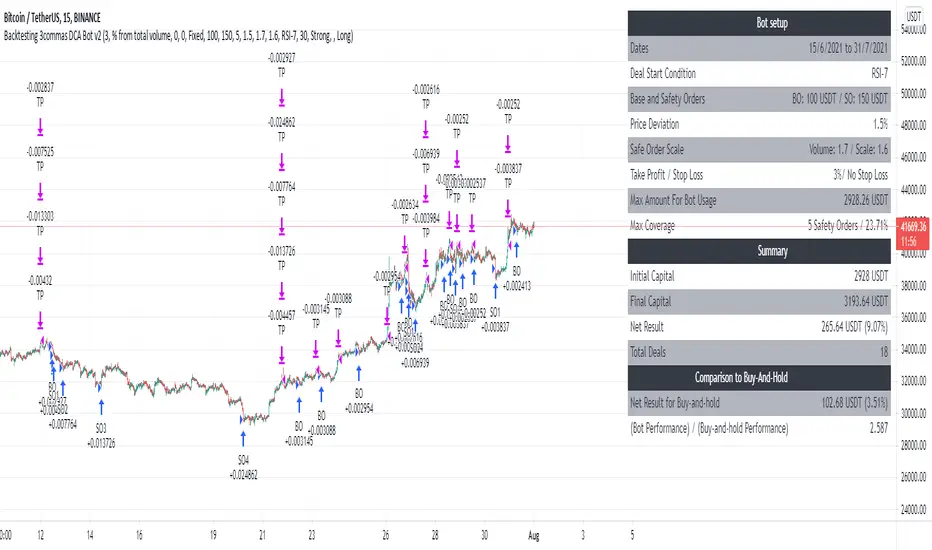
Backtesting 3commas DCA Bot v2Updating previously published simulated 3commas DCA logic with a sexier insert and more meaningful default parameters.
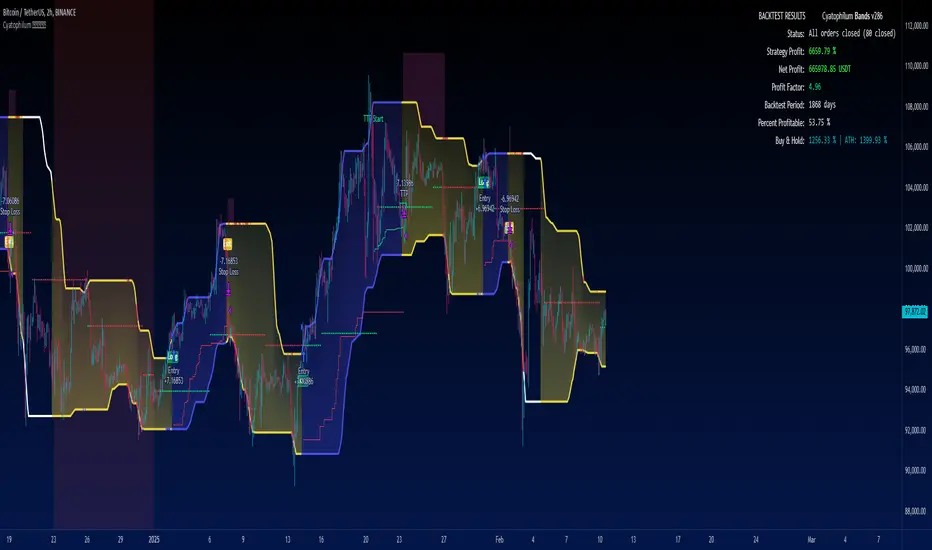
Cyatophilum Bands Definitive Edition█ OVERVIEW
A Swing Trade indicator providing backtest and alerts which can be used as a long, short or reversal strategy.
Its main goal is to catch breakouts and huge moves, and to try and beat the Buy & Hold Return.
█ CONCEPTS
The strategy consists of a unique custom indicator that works like this:
A Smoothed Donchian Channel combined with a consolidation check will trigger an entry.
The entry is then guided by a faster channel used as a trailing stop.
█ HOW TO USE
The most effective way to use this indicator is on high timeframes, from 2H to 1D.
The recommended pairs are trending pairs with consolidation areas. Yes, I'm especially looking at crypto.
The first appproach would be to catch long and short breakouts, and ride the trend using the trailing stop.
Adjust the Bands wisely to trigger entries at the right time.
The second approach is to go longs only, and try to beat the Buy & Hold return.
For this, click "Go long" and use an order size of 100% equity. Then adjust the Bands, trailing stop and chart timeframe.
The Buy & Hold comparator will come handy when backtesting.
█ INDICATOR SETTINGS
Strategy Direction
Choose wether to go long only, short only or both directions.
Bands Configuration
The bands lookback, smoothing and consolidation % are used to change the behavior of the bands. More info in the settings tooltips.
Trailing Stop
The "speed" of the trailing stop can be configured, allowing more or less room for the price to move before exiting.
Volume Condition
In addition to the consolidation condition, you can add a volume check to your entry. Is the volume rising or not? Useful in most scenarios.
Exit Alert Type
If you want to receive alerts during bars or prefer to ignore wicks.
Backtest Settings
This is where you choose the backtest period which is also used to calculate the B&H return.
Graphics
The configuration panel with all the indicator settings backtest info.
The buy & Hold Comparator is an additional panel that turns green when the strategy's return is greater than the Buy & Hold return.
Note: The Strategy Return is the strategy netprofit + the strategy openprofit.
█ ALERTS
Configure your alert messages for all events in the indicator settings.
Then click "Add Alert". In the popup window, select the option "alert() function calls only", give the alert a name and you are good to go!
█ BACKTEST RESULTS
The backtest settings used in this snapshot are the following:
Initial Capital: 10 000$
Order size: 100% equity (It indeed compounds and this is intended since the main goal of the strategy is to compare to Buy & Hold return)
Commission: 0.1%
Slippage : 10 ticks
The Indicator settings used for this are shown in the main chart above.
3Commas Bollinger StrategyThis strategy is intended for use as a way of backtesting various parameters available on 3commas.io composite bot using a bollinger band type trading strategy. While it's primary intention is to provide users a way of backtesting bot parameters, it can also be used to trigger a deal start by either using the {{strategy.open.alert_message}} field in your alert and providing the bot details in the configuration screen for the strategy or by including the usual deal start message provided by 3commas. You can find more information about how to do this from help.3commas.io
The primary inputs for the strategy are:
// USER INPUTS
Short MA Window - The length of the Short moving average
Long MA Window - The length of the Long moving average
Upper Band Offset - The offset to use for the upper bollinger offset
Lower Band Offset - The offset to use for the lower bollinger offset
Long Stop Loss % - The stop loss percentage to test
Long Take Profit % - The Take profit percentage to test
Initial SO Deviation % - The price deviation percentage required to place to first safety order
Safety Order Vol Step % - The volume scale to test
3Commas Bot ID - (self explanatory)
Bot Email Token - Found in the deal start message for your bot (see link in previous section for details)
3Commas Bot Trading Pair - The pair to include for composite bot start deals (should match format of 3commas, not TradingView IE. USDT_BTC not BTCUSDT)
Start Date, Month, Year and End Date, Month and Year all apply to the backtesting window. By default it will use as much data as it can given the current period select (there is less historical data available for periods below 1H) back as far as 2016 (there appears to be no historical data on Trading view much before this). If you would like to test a different period of time, just change these values accordingly.
Known Issues
Currently there are a couple of issues with this strategy that you should be aware of. I may fix them at some point in the future but they don't really bug me so this is more for informational purposes than a promise that they may one day be fixed.
Does not test trailing take profit
Number of safety orders and Safety Order Step Scale are currently not user configurable (must edit source code)
Using the user configuration to generate deal start message assumes you are triggering a composite bot, not a simple bot.

Combo Backtest 123 Reversal & MASS Index This is combo strategies for get a cumulative signal.
First strategy
This System was created from the Book "How I Tripled My Money In The
Futures Market" by Ulf Jensen, Page 183. This is reverse type of strategies.
The strategy buys at market, if close price is higher than the previous close
during 2 days and the meaning of 9-days Stochastic Slow Oscillator is lower than 50.
The strategy sells at market, if close price is lower than the previous close price
during 2 days and the meaning of 9-days Stochastic Fast Oscillator is higher than 50.
Second strategy
The Mass Index was designed to identify trend reversals by measuring
the narrowing and widening of the range between the high and low prices.
As this range widens, the Mass Index increases; as the range narrows
the Mass Index decreases.
The Mass Index was developed by Donald Dorsey.
WARNING:
- For purpose educate only
- This script to change bars colors.

RSI-VWAP Indicator %█ OVERALL
Simple and effective script that, as you already know, uses vwap as source of the rsi, and with good results as long as the market has no long-term downtrend.
RsiVwap = rsi (vwap (close), Length)
The default settings are for BTC in a 30 minute time frame. For other pairs and time frames you just have to play with the settings.
█ FEATURES
• The option to start trading from a certain date has been added.
• To make the profit more progressive, a percentage of your equity is used for entries and a percentage of your position is used for closings.
• The option to trade in Spot mode has been added, since, for the TradingView backtest, the money is infinite and if you do not limit it somehow,
it would offer you much better profits than the live trading.
QuantityOnLong = Spot ? (EquityPercent / 100) * ((strategy.equity / close) - strategy.position_size) : (EquityPercent / 100) * (strategy.equity / close)
• The option to stop the system when the drawdown exceeds the fixed limit has been added.
Drawdown, as you already know, is a very important measure of risk in trading systems.
The maximum drawdown will tell us what the maximum loss of a trading system has been during a period. This maximum loss is determined by:
strategy.risk.max_drawdown(Risk, strategy.percent_of_equity)
• Leverage plotted on labels added.
█ ALERTS
To enjoy the benefits of automatic trading, TradingView alerts can be used as direct buy-sell orders on spot, or long-close orders with leverage.
Currently there are Chrome extensions that act as a bridge between TradingView and your Exchange or Broker.
This is an example of syntax for this type of extensions. Copy and paste a message like this into the alert window:
{{strategy.order.action}} @ {{strategy.order.price}} | e = {{exchange}} a = account s = {{ticker}} b = {{strategy.order.action}} {{strategy.order.alert_message}}
█ NOTE
Certain Risks of Live Algorithmic Trading You Should Know:
• Backtesting cannot assure actual results.
• The relevant market might fail or behave unexpectedly.
• Your broker may experience failures in its infrastructure, fail to execute your orders in a correct or timely fashion or reject your orders.
• The system you use for generating trading orders, communicating those orders to your broker, and receiving queries and trading results from your broker may fail.
• Time lag at various point in live trading might cause unexpected behavior.
• The systems of third parties in addition to those of the provider from which we obtain various services, your broker, and the applicable securities market may fail or malfunction.
█ THANKS
Thanks to TradingView, its Pine code, its community and especially those Pine wizards who post their ideas that helps us to learn.
If the world is heading toward a equitable new world economic order, let's get rich first ...
Happy trading!

Ultimate Strategy TemplateHello Traders
As most of you know, I'm a member of the PineCoders community and I sometimes take freelance pine coding jobs for TradingView users.
Off the top of my head, users often want to:
- convert an indicator into a strategy, so as to get the backtesting statistics from TradingView
- add alerts to their indicator/strategy
- develop a generic strategy template which can be plugged into (almost) any indicator
My gift for the community today is my Ultimate Strategy Template
Step 1: Create your connector
Adapt your indicator with only 2 lines of code and then connect it to this strategy template.
For doing so:
1) Find in your indicator where are the conditions printing the long/buy and short/sell signals.
2) Create an additional plot as below
I'm giving an example with a Two moving averages cross.
Please replicate the same methodology for your indicator wether it's a MACD, ZigZag, Pivots, higher-highs, lower-lows or whatever indicator with clear buy and sell conditions
//@version=4
study(title='Moving Average Cross', shorttitle='Moving Average Cross', overlay=true, precision=6, max_labels_count=500, max_lines_count=500)
type_ma1 = input(title="MA1 type", defval="SMA", options= )
length_ma1 = input(10, title = " MA1 length", type=input.integer)
type_ma2 = input(title="MA2 type", defval="SMA", options= )
length_ma2 = input(100, title = " MA2 length", type=input.integer)
// MA
f_ma(smoothing, src, length) =>
iff(smoothing == "RMA", rma(src, length),
iff(smoothing == "SMA", sma(src, length),
iff(smoothing == "EMA", ema(src, length), src)))
MA1 = f_ma(type_ma1, close, length_ma1)
MA2 = f_ma(type_ma2, close, length_ma2)
// buy and sell conditions
buy = crossover(MA1, MA2)
sell = crossunder(MA1, MA2)
plot(MA1, color=color_ma1, title="Plot MA1", linewidth=3)
plot(MA2, color=color_ma2, title="Plot MA2", linewidth=3)
plotshape(buy, title='LONG SIGNAL', style=shape.circle, location=location.belowbar, color=color_ma1, size=size.normal)
plotshape(sell, title='SHORT SIGNAL', style=shape.circle, location=location.abovebar, color=color_ma2, size=size.normal)
/////////////////////////// SIGNAL FOR STRATEGY /////////////////////////
Signal = buy ? 1 : sell ? -1 : 0
plot(Signal, title="🔌Connector🔌", transp=100)
Basically, I identified my buy, sell conditions in the code and added this at the bottom of my indicator code
Signal = buy ? 1 : sell ? -1 : 0
plot(Signal, title="🔌Connector🔌", transp=100)
Important Notes
🔥 The Strategy Template expects the value to be exactly 1 for the bullish signal , and -1 for the bearish signal
Now you can connect your indicator to the Strategy Template using the method below or that one
Step 2: Connect the connector
1) Add your updated indicator to a TradingView chart
2) Add the Strategy Template as well to the SAME chart
3) Open the Strategy Template settings and in the Data Source field select your 🔌Connector🔌 (which comes from your indicator)
From then, you should start seeing the signals and plenty of other stuff on your chart
🔥 Note that whenever you'll update your indicator values, the strategy statistics and visual on your chart will update in real-time
Settings
- Color Candles : Color the candles based on the trade state (bullish, bearish, neutral)
- Close positions at market at the end of each session : useful for everything but cryptocurrencies
- Session time ranges : Take the signals from a starting time to an ending time
- Close Direction : Choose to close only the longs, shorts, or both
- Date Filter : Take the signals from a starting date to an ending date
- Set the maximum losing streak length with an input
- Set the maximum winning streak length with an input
- Set the maximum consecutive days with a loss
- Set the maximum drawdown (in % of strategy equity)
- Set the maximum intraday loss in percentage
- Limit the number of trades per day
- Limit the number of trades per week
- Stop-loss: None or Percentage or Trailing Stop Percentage or ATR
- Take-Profit: None or Percentage or ATR
- Risk-Reward based on ATR multiple for the Stop-Loss and Take-Profit
This script is open-source so feel free to use it, and optimize it as you want
Alerts
Maybe you didn't know it but alerts are available on strategy scripts.
I added them in this template - that's cool because:
- if you don't know how to code, now you can connect your indicator and get alerts
- you have now a cool template showing you how to create alerts for strategy scripts
Source: www.tradingview.com
I hope you'll like it, use it, optimize it and most importantly....make some optimizations to your indicators thanks to this Strategy template
Special Thanks
Special thanks to @JosKodify as I borrowed a few risk management snippets from his website: kodify.net
Additional features
I thought of plenty of extra filters that I'll add later on this week on this strategy template
Best
Dave

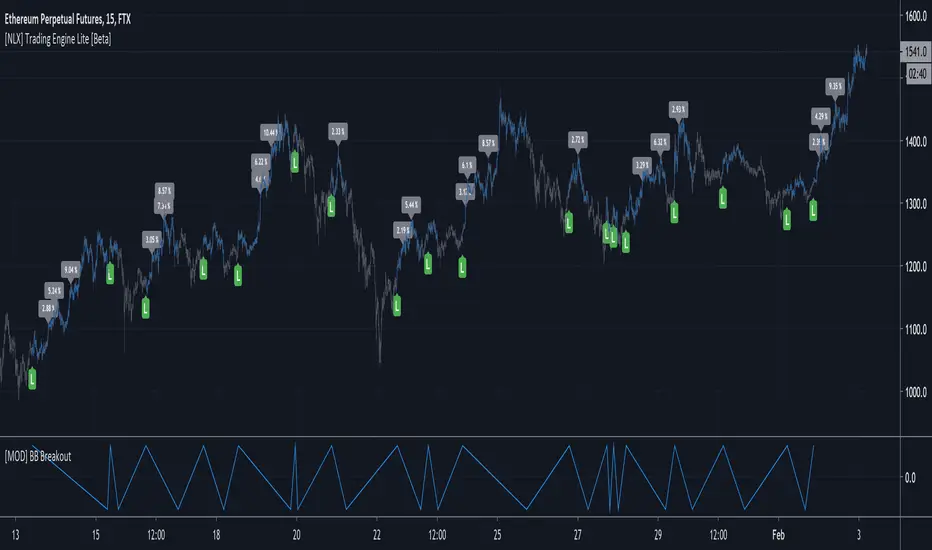
[NLX] Trading Engine (Backtest+Alerts) [Beta]This is a different version of my backtest module, which will be a fully featured alert and backtest tool.
The new strategy alerts will be integrated so we don't require 2 different scripts anymore. All in one.
There are no stop mechanism in this version. The entry and exit signal has to come from your indicator (you can set the signal values yourself).
It also integrates a ProfitView Alert Builder. This is an early beta and the alerts are not working yet!
Stay tuned for more updates!
Combo Backtest 123 Reversal & Line Regression Intercept This is combo strategies for get a cumulative signal.
First strategy
This System was created from the Book "How I Tripled My Money In The
Futures Market" by Ulf Jensen, Page 183. This is reverse type of strategies.
The strategy buys at market, if close price is higher than the previous close
during 2 days and the meaning of 9-days Stochastic Slow Oscillator is lower than 50.
The strategy sells at market, if close price is lower than the previous close price
during 2 days and the meaning of 9-days Stochastic Fast Oscillator is higher than 50.
Second strategy
Linear Regression Intercept is one of the indicators calculated by using the
Linear Regression technique. Linear regression indicates the value of the Y
(generally the price) when the value of X (the time series) is 0. Linear
Regression Intercept is used along with the Linear Regression Slope to create
the Linear Regression Line. The Linear Regression Intercept along with the Slope
creates the Regression line.
WARNING:
- For purpose educate only
- This script to change bars colors.

Combo Backtest 123 Reversal & Laguerre-based RSI This is combo strategies for get a cumulative signal.
First strategy
This System was created from the Book "How I Tripled My Money In The
Futures Market" by Ulf Jensen, Page 183. This is reverse type of strategies.
The strategy buys at market, if close price is higher than the previous close
during 2 days and the meaning of 9-days Stochastic Slow Oscillator is lower than 50.
The strategy sells at market, if close price is lower than the previous close price
during 2 days and the meaning of 9-days Stochastic Fast Oscillator is higher than 50.
Second strategy
This is RSI indicator which is more sesitive to price changes.
It is based upon a modern math tool - Laguerre transform filter.
With help of Laguerre filter one becomes able to create superior
indicators using very short data lengths as well. The use of shorter
data lengths means you can make the indicators more responsive to
changes in the price.
WARNING:
- For purpose educate only
- This script to change bars colors.

SmoothOps v1 - StrategyThe purpose of this script was to fine tune an indicator on BTCUSDT. I think the results speak for themselves.
This is a script that uses the MACD to predict future price movement. The original MACD signal lags too much for my taste so I went searching for something that could give signals sooner. I decided a smooth macd would help filter out noise and grabbing the highest values and lowest values over the past number of bars. I spent several days backtesting different settings and combinations of signals to arrive at what you see now. This strategy has been fine tuned for BTC/USDT on Binance, so I suggest you only use it for that. Any other coin/pair and exchange will need a new backtest since the data will be different. This is not a generalized indicator like everything else. It's specifically good at one thing: prediction BTCUSDT on Binance.
Use this in combination with the Study version so you can visually see what is happening when you change settings.
How to use:
Use only on BTCUSDT Binance
Set the preset to the timeframe you want. I HIGHLY suggest only using the 1h timeframe. It gives the best profit over time
Set the preset to custom if you want to try using your own settings.
You can change the source input if you want. ohlc4 usually works best for 1h
Change the date range if you want to do a specific timeframe.
Change the stop loss % if you want, but I didn't find much of a difference when using it on 1h

MACD With Trend Filter: Visual Backtest Module TemplateSample Strategy: MACD Crossover with trend filter options
MA Filter : Price Close Above MA, Search for Buy, Price Close Below MA, Search for Sell
ADX Filter : Take trade only when ADX is above certain treshold
MACD Signal : MACD Cross above signal line while under 0 line indicate Buy Signal
MACD Cross below signal line while above 0 line indicate Sell Signal
-----------------------------
Using Alert Module:
Enable Alert --> Enable TV's alert and plot signal to chart
Alert Type --> Set to take Buy only, Sell only or Both alert
----------------------------
Using Backtest Module:
Enable Backtest --> Enable Backtest simulation
Backtest Type --> Set to take Buy only, Sell only or Both
SL Type -->
ATR : Set SL in ATR times Multiplier below/above entry price
Fixed : Set SL in fixed point below entry point (in 'Dollar'). e.g. for Stocks -> 0.5 equals to 50cent while for EURUSD currency -> 0.005 equal to 50 pips
HiLo Bar : Set SL at highest/lowest wick of previous bar plus/minus Fixed point. e.g. EURUSD HiLo=3 and Fixed Point = 0.0005, buy trade will place SL 5 Pips below lowest of previous 3 bar
SL ATR Period --> Set Lookback Period used for SL's ATR calculation
SL ATR Multi --> Set ATR Multiplier for SL
SL Fixed --> Set Fixed Level for SL (Use when SL Type is either Fixed or HiLo Bar)
SL Bar --> Set Number of previous bar to check for SL placement
TP RR Ratio --> Set TP based on RR multiplier. e.g. 2 means TP level will be twice further from entry point compared to Entry-SL distance.
Notes: The point is for preliminary testing, so it only supports 1 trade at a time and no Trailing Stop
----------------------------
Disclaimer:
This script main objective is to create my personal indicator template so that i just have to modify the indicator module for preliminary testing in future.
Testing Alert Module so i can re-use it as template in future study/indicator
Testing Visual Backtest Module so i can re-use it as template in future study/indicator
i believe using Strategy function is a better approach for this but the entry/exit level seems to be hit n miss (at least for me, still trying to figure what i did wrong)
also, i rather code the strategy in other platform where i can use the more accurate tick data if i want to validate backtest statistics.
My study scripts was built only to test/visualize an idea to see its viability and if it can be used to optimize existing strategy.
credit: ADX code are originally from "ADX and DI" by @BeikabuOyaji although i re-wrote so i can have cleaner read and use RMA instead of SMA

Phenom 5.3.1This has been a private script until now. I will be sharing it in order to get some feedback until it is ready to be made "invite only"
WHAT IT IS:
This is a scalping method (mostly) that works on nearly all markets and timeframes. THIS IS A BACKTEST SCRIPT! PLAN ACCORDINGLY!
HOW IT WORKS:
This script uses common indicators (5) in non-standard ways. When combined together, they can give fairly accurate results (40-65%) with acceptable Profit Factor ratings (1.7-3+).
This uses CCI, Moving Average, Stochastic, PSAR, and Bollinger Bands.
With these we have 4 base strategies usable.
Each indicator can be disabled (one at a time).
Each indicator has a SL method (stackable).
Each indicator has a TP method (stackable).
BEST RESULTS:
I have received best results as a scalper on 5min or 1HR timeframes. Mostly used on Index CFD's and CRYPTO markets.
NOT RESPONSIBLE FOR MISUSE OR LOST FUNDS! D.Y.O.R

Combo Backtest 123 Reversal & Volume SMA This is combo strategies for get a cumulative signal.
First strategy
This System was created from the Book "How I Tripled My Money In The
Futures Market" by Ulf Jensen, Page 183. This is reverse type of strategies.
The strategy buys at market, if close price is higher than the previous close
during 2 days and the meaning of 9-days Stochastic Slow Oscillator is lower than 50.
The strategy sells at market, if close price is lower than the previous close price
during 2 days and the meaning of 9-days Stochastic Fast Oscillator is higher than 50.
Second strategy
Volume and SMA
WARNING:
- For purpose educate only
- This script to change bars colors.
