RSI with Bollinger Bands Binary system by Hashtag_binaryRSI with Bollinger Bands is binary options high/low trading system based on the volatility.
- Time frame 30min - 1H
- Expiry time 2 candles
- Markets: Forex currency pairs majors: EUR/USD, USD/CHF, GBP/USD, AUD/USD, NZD/USD, EUR/JPY, USD/JPY, AUD/JPY
Rules for RSI with Bollinger Bands Binary system
- Do not start before the economic news
- We wait for the price to eitherhit the lower bollinger band or the upper bollinger band and the moment this happens we take the trade immediatly.
Buy Put:
If the price touches the lower Bollinger band we and RSI is below the 30 we take a put.
Buy Call:
If the price touches the upper Bollinger band we and RSI is above the 70 we take a call.
Binaryoption

MACD Binary Strategy by Hashtag_binary MACD Binary Options Strategy is an trend momentum system, It's based on the double MACD in the sub window below the chart.
- Markets: Stocks, Indicies, Metals, Forex. This binary strategy works good on the Indicies ( S&P 500, DAX, FTSE, ).
- MACD Binary System il also good as trading system for to trade.
- Time Frame 30 min or higher ( best 4H).
- Expires Time 3 bars after. (90 min, 180 min, 720 min, 3 daily).
Rules MACD Binary Options Strategy
Buy Call:
- EMA 6 over EMA 13;
- MACD ( 5, 15, 1) crosses upward MACD ( 12,26,1 );
- MACD (5,15, 1) over level 0.
Buy Put:
- EMA 6 under EMA 13;
- MACD ( 5, 15, 1) crosses downward MACD ( 12,26,1 );
- MACD (5,15, 1) under level 0.
The same conditions for entry trade.
Exit position options:
- When MACD (5, 15, 1,) crosses in opposite direction MACD (12,26,1);
- When exponential moving average crosses in opposite direction;
- Make profit with ratio 1:3 stop loss.
- Initial stop loss at the previous swing.

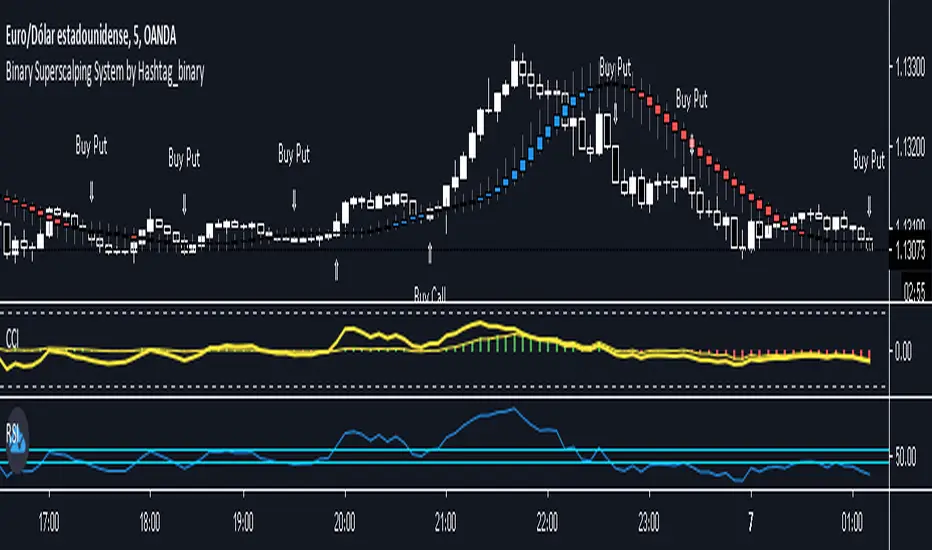
Binary Superscalping System by Hashtag_binaryBinary Superscalping Systyemis a trend momentum strategy designed for scalping and trading with binary options. This trading system is very accurate with the 80% profitable trades.
- Markets: Forex (EUR/USD, GBP/USD, AUD/USD, USD/CHF, USD/CAD, NZF/USD, USD/JPY,) Indicies (S&P500, Dow Jones, DAX, FTSE100) and Gold.
- Time Frame 5 min, 15min, 30min.
- Expiry Time (4-6 candles).
Buy Call or Buy:
- Trend CCI (170) crossed the zero line upwards (green bar >0);
- Entry CCI (34) crosses upward the zero line ;
- RSI (Relative Strength Index) indicator value is greater than 55 level;
- Heiken Ashi Smoothed indicator is color blue (optional).
Buy Put or Sell
- Trend CCI (170) crossed the zero line downwards (red bar <0);
- Entry CCI (34) crosses downward the zero line ;
- RSI indicator value is lower than 45 level;
- Heiken Ashi Smoothed indicator is color red (optiona).
Exit position for Scalping options:
- Entry CCI (34) crosses in opposite direction trend CCI (170),
- Profit Target:5 min time frame 7-10 pips, 15 min time frame (9-14 pips), 30 min time frame (15- 18 pips).
- Make Profit at fibopivot levels.
- Initial stop loss on the previous swing.
ADX signal Binary Options System by Hashtag_binary ADX signal Binary Options System is amanual trading system trend-momentum high/low. This system is still really interesting to use for binary options and trading without binary.
- Time Frame 15 min or higher.
- Expiry time 2-4 candles.
- Markets: Forex (Currency pairs: Majors; Index: S&P 500, Dow Jones, DAX, FTSE).
Trading rules ADX signal Binary Options System
Buy call:
1. The Moving Average line (14) is above others two Moving Averages (60 and 100 red and magenta line).
2. The TrendSignal Bar first subwindow indicator with bar green.
3. Stochastic is above 50 level.
4 If the previous conditions are agree when appear ADX green arrow you can enter buy call.
Buy Put:
1. The Moving Average line (14) is below others two Moving Averages (60 and 100 red and magenta line).
2. The TrendSignal Bar first subwindow indicator with bar red.
3. Stochastic is below 50 level.
4. If the previous conditions are agree when appear ADX red arrow you can enter buy put.
Exit position for trading without binary
Time Frame H1 and 30 min place trailing stop 15 or 20 pips, 4H time frame place trailing stop 30-40 pips depends by currency pairs.
Initial stop loss on the previous swing High/Low.

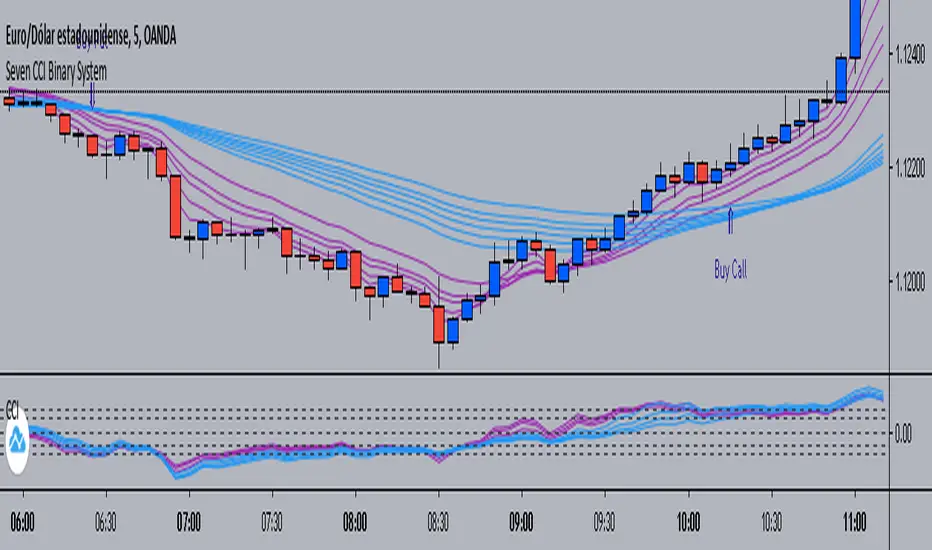
Seven CCI Binary System by Hashtag_binarySeven CCI binary system is trend-momentum strategy based on CCI and exponential moving averages. This trading system is also good for scalping and intraday trading.
Rules for Binary Options:
- Time Frame 5 min or 15 min.
- Expiry time 4-5 candles.
- Trades only in trend.
Buy Call:
- EMA's lines color magenta above EMA's lines color blue;
- CCI lines color magenta are above CCI lines color blue and zero level.
- When thes conditions are agree buy call at opening of the next bar.
Buy Put:
- EMA's lines color magenta below EMA's lines color blue;
- CCI lines color magenta are below CCI lines color blue and zero level.
- When thes conditions are agree buy put at opening of the next bar.
Scalping:
-Time Frame 5 min, 15min.
- Currency Pairs: EUR/USD, GBP/USD, AUD/USD, USD/CHF, USD/JPY.
- The rules for buy and sell are the same.
- When the price is within the bundle of the moving averages do not trade.
Exit position
- Make Profit on the pivot points levels or with fast profit target.
- Initial stop loss on the previous swing price.
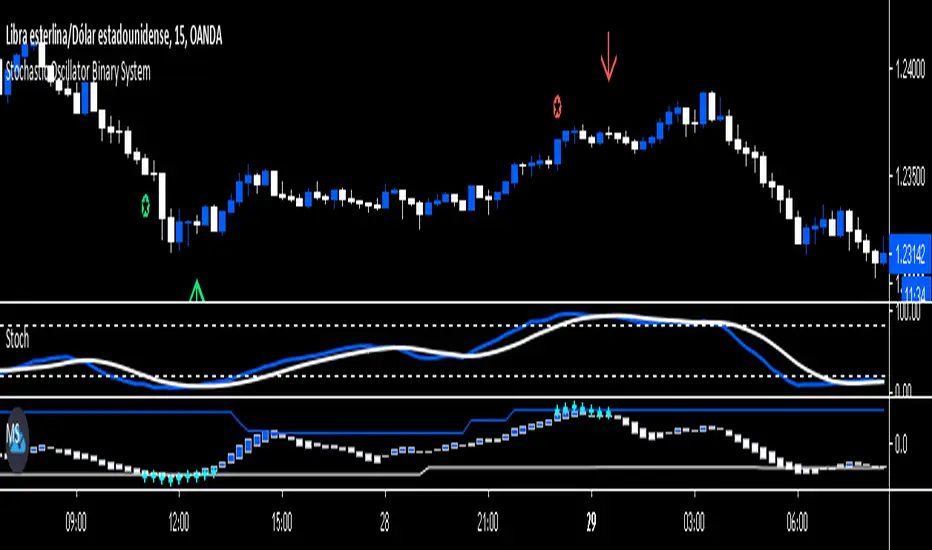
Stochastic Oscillator Binary System by Hashtag_binaryRules
- Time Frame 1 min.
- Expires Time 3 min or 15 min (the best option).
- Markets: Forex (only volatile currency pair), Futures.
- Sessions: London and New York.
Call
- Heiken Ashi Dodger blue;
-Stochastic Oscillator cross upward from oversold Zone (conservative trade, aggressive trade: Stochastic Oscillator cross upward ).
-Matrix three square dodger blue.
Put
- Heiken Ashi white;
- Stochastic Oscillator cross downward from overbougth Zone (conservative trade, aggressive trade: Stochastic Oscillator cross downward ).
- Matrix three square withe.
This Binary System is also good for trade scalping. The same rule for entry with conservative trade:
Exit position options
- For Buy close position when the stochastic line touches 80 levels,
- For Sell close positions when stochastic line touches 20 levels.
- Initial Stop loss on the previous swing.
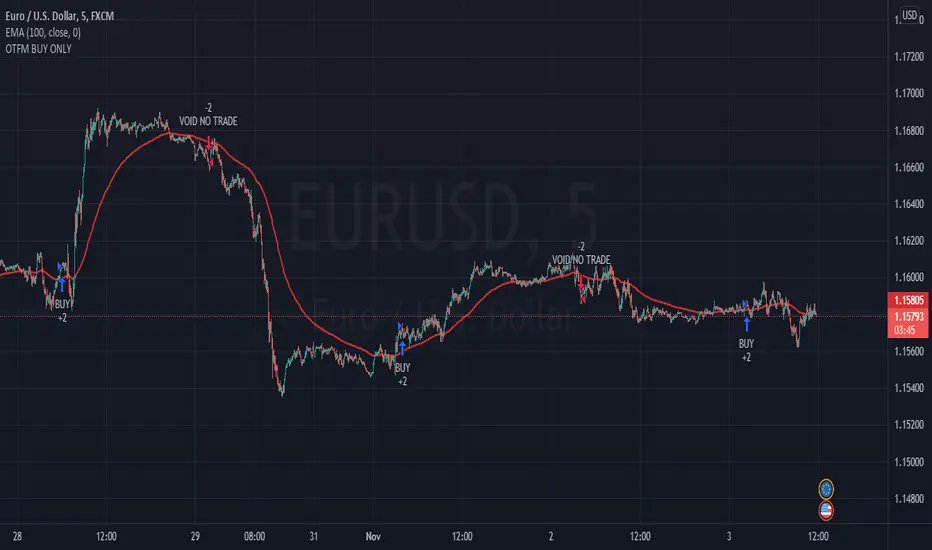
OTFMWHAT TYPE OF MARKET TO USE?
OTFM mainly uses for any forex pairs typically for scalping or Options with short-term expiry time such as hourly expiration.
HOW IT WORKS?
OTFM indicator uses a combination of moving averages and trend analysis to trigger a BUY (blue arrow pointing up) or a SELL (red arrow pointing down) signal. When certain condition is met, it will immediately pop up an alert signal for you to take. It will trigger with all types of market condition. There is no repaint since it is based of the previous closed candle.
HOW TO USE?
When the signal triggers a “BUY” or “SELL” you want to wait for that candle to close and then you enter the next candle as your entry. If you’re trading binary options, you want to take the OTM (Out the Money) contracts for low risk/ high reward and take profits once the market is going in your direction. This indicator works best when you scalp and not hold till expiry. You want to leave room for your hourly expiration typically within one hour or 2 hour. This will avoid any market reversal if it decides to go South. You can turn on push notification on your phone so you won’t have to miss any signals.
This indicator is a monthly subscription. If you’re interested in a one week free trial for testing. PM me to access the OTFM.
Price Power for Binary Option (BO) by MrTuanDoanIdea was developed from Price's Power (inno14).
This indicator is only used for Binary Option (BO).
Rules for Signal Candle:
- Close to Bollinger's Band
- Price Power is losing its strength (compare with previous powers)
- Price Power is about crossing down/up middle line
- DMI Extension show SELL signal
How to enter:
- Enter the next candle.
- Expiration: the length of current time frame.
- Rollover once if needed
Note:
- Always use it as an extra confirmations from your setup
- Always use it with risk management
Good luck and happy trading.

Rainbow Gator - EMAs strategy for Binary OptionThis is an EMAs indicator for Binary Option or Scalping Alert designed for lower Time Frame Trend (2-5minutes).
Although you will find it a useful tool for higher time frames as well.
The Alerts are generated when the fast EMA cross over/under other slower EMAs, you then have the chance to wait for the pullback during the new trend then enter for trend momentum (follow the trend).
Beware when the trend is close to EMA200.
You must draw your SRT (Support-Resistance-Trendline) before looking for setups.
Good luck.
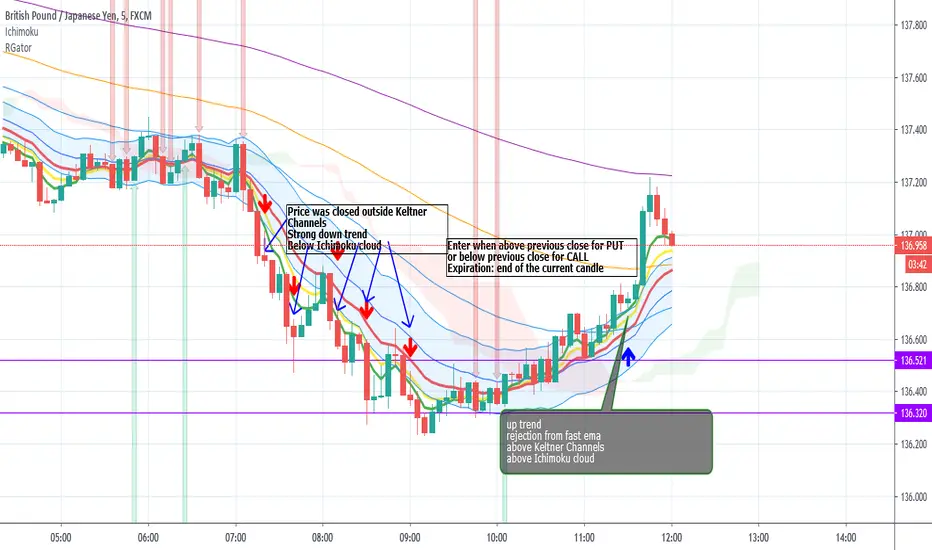
EMA200 with alerts before touchingInitial version: provide alert when price is in range before it touches ema.
Used for Binary Option to enter rejection from EMA200.
Why Jason200?
It's a legitimate request from Jason Estudillo.

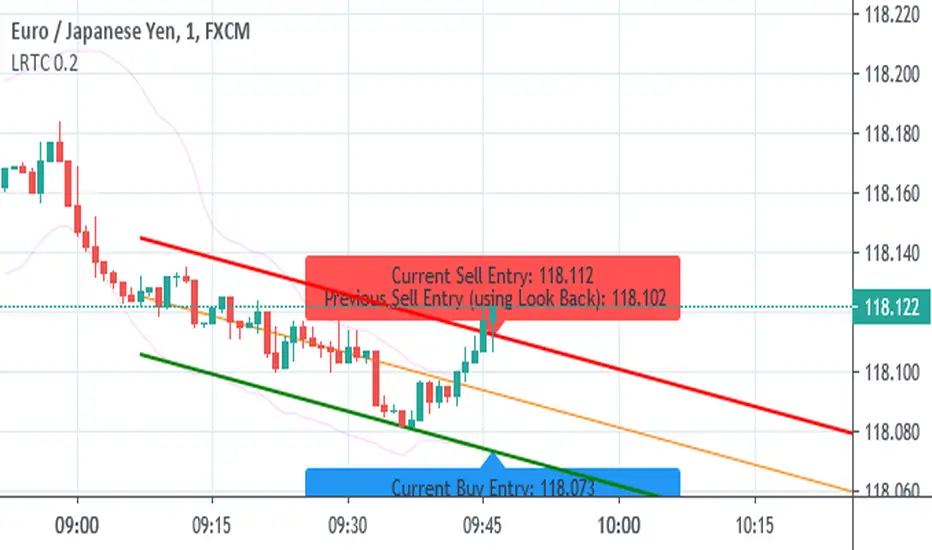
Linear Regression Trend Channel with Entries & AlertsPlease Use this Indicator If you understand the risk posed by linear regression trend channel
Features
Provides trend channel (best value for period is 40 on 5 minute timeframe
Provides BUY/SELL entries based on current channel
Provides custom color for channel
Best used with MattyPips strategy indicators
Risks : Please note, this script is the likes of Bollinger bands and poses a risk of falling in a trend range.
Entries may keep running on the same direction while the market is moving.
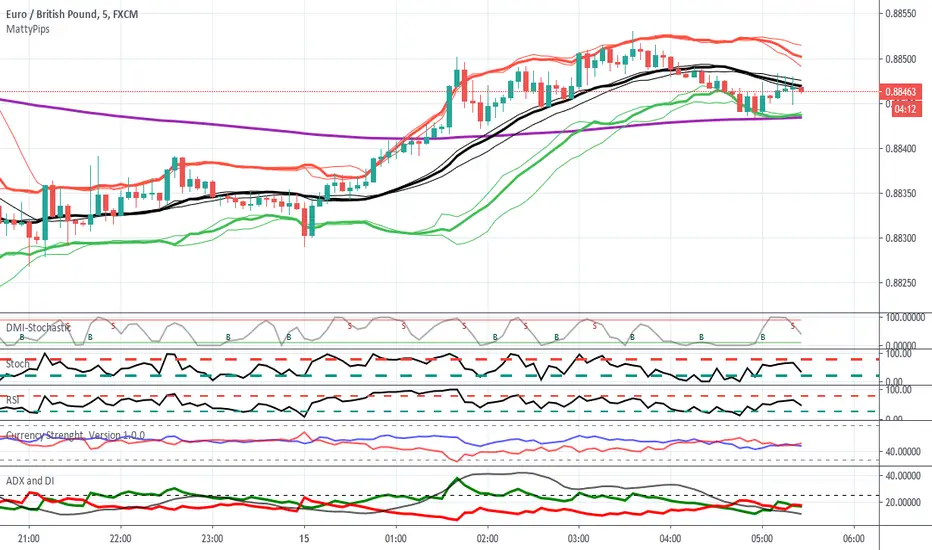
MattyPips Strategy with Alerts For education purpose.
Applied only for Matty Pips Strategy.
Arrow will appear when
DMI + Stoch + RSI are in the same OB/OS.
PowerBot Binary Backtest FrameworkHello Traders,
This is the backtest framework for testing the Powerbot algorithm before activating alerts which can be used for precise Trading.
Powerbot can be used across any timeframe and across any expiration based on the performance
This backtest comes with some features to help traders make a decision on the following:
When using the indicator itself.
1. We use our proprietary algorithm - "Powerbot binary algorithm script", which is Public but can only be accessed based on request. If you would like to use the algorithm please ensure you have tested different assets and varying expiration for your trades through the backtest - if you don't know how to do that please contact us by sending a message.
EXPLORE YOUR OPTIONS FOR TRADING THROUGH VARIED ITERATION.
2. You can choose any expiration time by changing the expiration time period from the 'settings' button, this will display new results. example; on a 5 minutes chart timeframe, 6 bars would be 30 minutes, which means 5 minutes times 6, which is 30 and minutes because your timeframe is set to minutes. Another example is that on a 1-hour timeframe, 12 bars would be 12 hours, given 1 * 12 is 12hours, because your timeframe is set to hours.
3. You can choose the trading session you want, please note that we have included the three most active sessions - ASIAN, EU/UK, & US Session, by default, the scripts checks for performance on 24/7, which means it does not omit trades outside of the trading session. The Tradingview time is in UTC (or GMT -4). The best times to trade are during sessions most active times.
This backtesting indicator is free to add to the chart if you would like to use the algorithm during your trading session you need to contact us. After which you can use the algorithm for as long as you want.
Please note that no signal can work in all timeframe across all markets that is why backtesting to search for algorithms with at least 50% performance ratio is excellent for trading. All you need is to diversify alerts across to assets or more to rake in profits.
If you require assistance in understanding what session would work best, you can send us a message to work through the process together.
Thank you for you support. This script is free to use to see potential of the indicator itself.
We are NOT allowed to advertise any script on sale based on tradingview house rules.
Wishing you all the best.

BO - CCI Arrow with AlertBO - CCI Arrow with Alert base on CCI indicator to get signal for trade Binary Option.
Rules of BO - CCI Arrow with Alert below:
A. Setup Menu
1. cciLength:
* Default CCI lenght = 14
2. Linear Regression Length:
* Periods to calculate Linear Regression of CCI,
* Default value = 5
3. Extreme Level:
* Default top extreme level = 100
* Default bottom extreme level = -100
4. Filter Length:
* Periods to define highest or lowest Linear Regression
* Default value = 6
B. Rule Of Alert Bar
1. Put Alert Bar
* Current Linear Regression Line created temporrary peak
* Peak of Linear Regression Line greater than Top Extreme Level (100)
* Previous Linear Regression is highest of Filter Length (6)
* Previous Linear Regression is greater than previous peak of Linear Regression Line
* Current price greater than previous low
* CCI(14) less than Linear Regression Line
2. Call Alert Bar
* Current Linear Regression Line created temporrary bottom
* Bottom of Linear Regression Line less than Bottom Extreme Level (-100)
* Previous Linear Regression is lowest of Filter Length (6)
* Previous Linear Regression is less than previous bottom of Linear Regression Line
* Current price less than previous lhigh
* CCI(14) greater than Linear Regression Line
B. Rule Of Entry Bar and Epiry.
1. Put Entry with expiry 3 bars:
* After Put Alert Bar close with signal confirmed, put Arrow appear, and after 3 bars, result label will appear to show win trade, loss trade or draw trade
2. Call Entry with expiry 3 bars:
* After Call Alert Bar close with signal confirmed, call Arrow appear, and after 3 bars, result label will appear to show win trade, loss trade or draw trade.
3. While 1 trade is opening no more any signal
C. Popup Alert/Mobile Alert
1. Signal alert: Put Alert or Call Alert will send to mobile or show popup on chart
2. Put Alert: only Put Alert will send to mobile or show popup on chart
3. Call Alert: only Call Alert will send to mobile or show popup on chart

BO - RSI - M5 BacktestingBO - RSI - M5 Backtesting -Rule of Strategy
A. Data
1. Chart M5 IDC
2. Symbol: EURJPY
B. Indicator
1. RSI
2. Length: 12 (adjustable)
3. Extreme Top: 75 (adjustable)
4. Extreme Bottom: 25 (adjustable)
C. Rule of Signal
1. Put Signal
* Rsi create a temporary peak over Extreme Top
row61: peak_rsi= rsi >rsi and rsi >rsi and rsi rsi_top
2. Call Signal
* Rsi create a temporary bottom under Extreme Bottom
row62: bott_rsi= rsi rsi and rsi

BO - Bar's direction Signal - BacktestingBO - Bar's direction Signal - Backtesting Options:
A. Factors Calculate probability of x bars same direction
1. Periods Counting: Data to count From day/month/year To day/month/year
2. Trading Time: only cases occurred in trading time were counted.
B. Timezone
1. Trading time depend on Time zone and specified chart.
2. Enable Highlight Trading Time to check your period time is correct
C. Date Backtesting
* Only cases occurred in Date Backtesting were reported.
D. Setup Options & Rule
1. Reversal after 2 bars same direction
* Probability of 3 bars same direction < 50
* 2 bars same direction is start of series
2. Reversal after 3 bars same direction
* Probability of 4 bars same direction < 50
* 3 bars same direction is start of series
3. Reversal after 4 bars same direction
* Probability of 4 bars same direction < 50
* 3 bars same direction is start of series
4. Reversal after 5 bars same direction
* Probability of 5 bars same direction < 50
* 4 bars same direction is start of series
5. Reversal after 6 bars same direction
* Probability of 6 bars same direction < 50
* 5 bars same direction is start of series

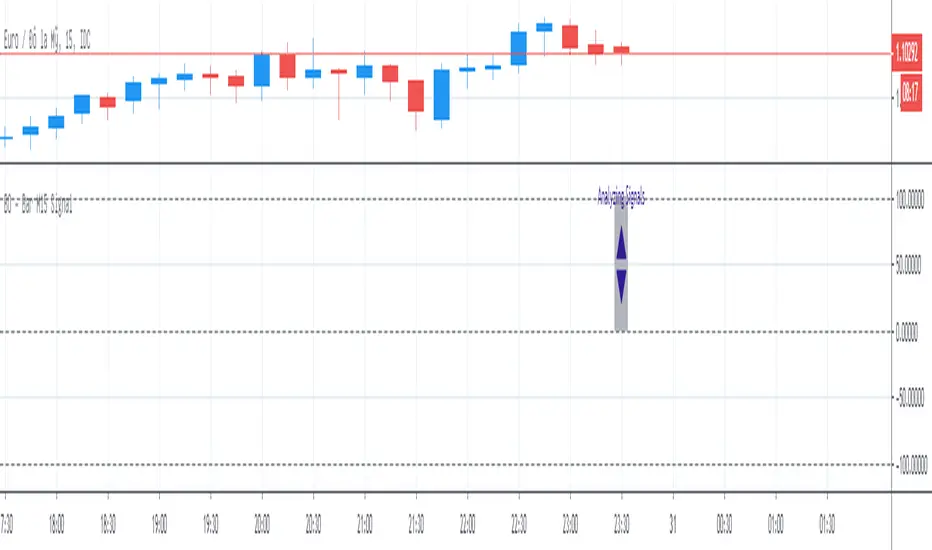
BO - Bar M15 2/3 SignalBO - Bar M15 2/3 Signal show the signal to trade Binary Option with rule below:
A. Indicator
* Bollinger Band (20,2): avoid waterfall
B. Rule of Signal
1. Rule1: Split Bar M15 to 3 part and load them on M5 chart (recommend use M5 IDC chart)
2. Rule 2: Delay 10' after bar M15 open => wait for price's pattern
3. Rule 3: Put Signal row 30-32
* Delay 10' after bar M15 open.
* Direction of 1/3 and 2/3 Bar M15 is upward
* close of 2/3 Bar M15 below upper band Bb(20,2) on M5 chart => avoid strong buy
4. Rule 4: Call Signal row 36-38
* Delay 10' after bar M15 open.
* Direction of 1/3 and 2/3 Bar M15 is downward
* close of 2/3 Bar M15 above lower band Bb(20,2) on M5 chart => avoid strong sell
C. Recommend Expiry time: Bar M15 close
* We try to catch the shadow of Bar M15 but dont trade when price run on the upper or lower band of BB(20,2,M5)

BO - Bar M15 Signal* This script show the signal base on volatility of previous bar M15 to trade Binary Option.
* Rule of Signal is below:
A. Rule 1: Wait for prices created temporary peak and bottom
Row 18: 10 minutes till close
B. Rule 2: Reversal previous bar's direction
1. Put Signal - Row 22 - 25:
- Delay 5' after bar M15 open
- previous bar's direction is upward
- price less than previous close
- temporary bottom greater than previous open
2. Call Signal - Row 29 - 32:
- Delay 5' after bar M15 open
- previous bar's direction is downward
- price greater than previous close
- temporary peak less than previous open
C. Rule 3: Follow previous bar's direction
1. Put Signal - Row 37 - 40:
- Delay 5' after bar M15 open
- previous bar's direction is downward
- price greater than previous open
- temporary peak less than previous peak
2. Call Signal - Row 43 - 46:
- Delay 5' after bar M15 open
- previous bar's direction is upward
- price less than previous open
- temporary bottom greater than previous bottom
yutas_BOindicator_β1_simpleVer.1.0
・High-low sign indicator for binary option only. (β_simple version)
・Signs are displayed where repulsion is likely to occur on special oscillators.
・You can expect a rebound in the next candle after you sign.
・The filter can be in a certain numerical range.
・We recommend cross-yen for currency pairs.
・バイナリーオプション専用ハイローサインインジケーター。 (ベータシンプルバージョン)
・特殊なオシレーターでの反発しやすい所にサインを表示します。
・サインが出た次のローソクでの反発が期待できます。
・フィルターとして一定数値範囲内という条件も可能。
・通貨ペアはクロス円がオススメです。

10X Trading System10X Trading System (Non Repaint)
TradingView Account Needed: Free
Not satisfied with your trading results so far? This may help:
The 10X Trading System helps you identify tops, bottoms and market direction — quickly and accurately.
The strategy behind its accuracy is the fact that it combines price action and multiple market timing algorithms to determine these significant turning points in the markets.
That way, you can be sure you have the best chance to get the best entry and exit points with perfect timing, and hopefully extract more profits from the markets than anybody else.
Once the 10X Trading system has spotted a possible top or bottom, it clearly displays these Buy or Sell alerts on your charts… showing you exactly where this may occur.
You can activate alerts to never miss a signal.
How to use the signals and alerts:
10X Trading System automatically analyze price action and multiple market timing algorithms to give you a signal when there's a good trade.
Works on all markets on all time frames so it's suitable for binary, scalping, day and swing trading.
10X Trading System allow you to get the best entry and exit points with perfect timing.
If you want more details, the link is in the signature.
Disclaimer:
Past performance is not indicative of future performance. No representation is being made that any results discussed within the service and its related media content will be achieved. All opinions, news, research, analyses, prices or other information is provided as general market commentary and not as investment advice. TradingWalk, their members, shareholders, employees, agents, representatives and resellers do not warrant the completeness, accuracy or timeliness of the information supplied, and they shall not be liable for any loss or damages, consequential or otherwise, which may arise from the use or reliance of the TradingWalk service and its content. © 2019 TradingWalk.
TradingWalk indicators are built for TradingView. TradingWalk is on no way a part of TradingView.
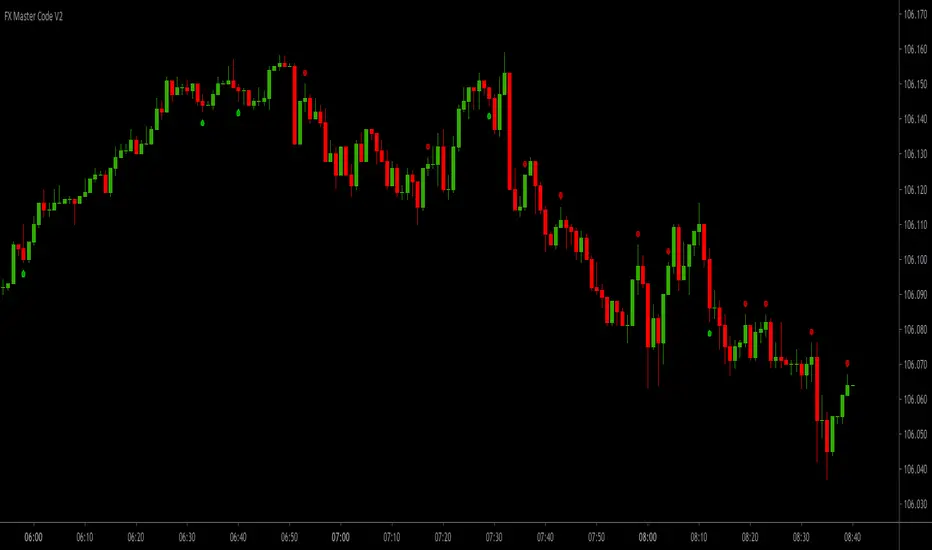
FX Master Code V2FX Master Code V2 (Non Repaint)
TradingView Account Needed: Free
Are you making the making the kind of results you want from trading right now?
Well, if the answer's no, then read this!
Even if you're a complete beginner in trading or an experienced trader, you can use these signals and alerts to start making great results.
The main goal of trading the 1-minute time frame is to make a profit through buying or selling currency pairs by holding a position for a very short period of time, and closing it for a profit.
FX Master Code will give you signals based on my proven and profitable 1-minute trading strategy.
You should be aware that this strategy will demand a certain amount of time and concentration. If you are not able to dedicate at least one hour a day to trade this strategy, then trading the 1-minute chart might not be the best strategy for you.
This is a day trading strategy suitable scalpers and binary options traders, as it involves opening a buy or sell position, gaining a few pips, and then closing the position 3 candlesticks after the signal (3 minute expiration time for binary options).
The exiting aspect of this is quantity. It is not unusual for traders to place more than +10 trades a day (and the more trades you place, the higher returns you can make).
Why not try FX Master Code and see if this system works for you?
The essence of the system will not allow for high losses. We will help you with risk management, use the best-practice risk and trade management for successful trading we give you with FX Master Code.
FX Master Code can be an extremely effective and profitable strategy – even for those who are beginners or use it purely as a supplementary strategy.
What is even better, using this strategy you are rewarded for quantitative work – the more trading you perform, the higher returns you can make.
If you want more details, the link is in the signature.
Disclaimer:
Past performance is not indicative of future performance. No representation is being made that any results discussed within the service and its related media content will be achieved. All opinions, news, research, analyses, prices or other information is provided as general market commentary and not as investment advice. TradingWalk, their members, shareholders, employees, agents, representatives and resellers do not warrant the completeness, accuracy or timeliness of the information supplied, and they shall not be liable for any loss or damages, consequential or otherwise, which may arise from the use or reliance of the TradingWalk service and its content. © 2019 TradingWalk.
TradingWalk indicators are built for TradingView. TradingWalk is on no way a part of TradingView.
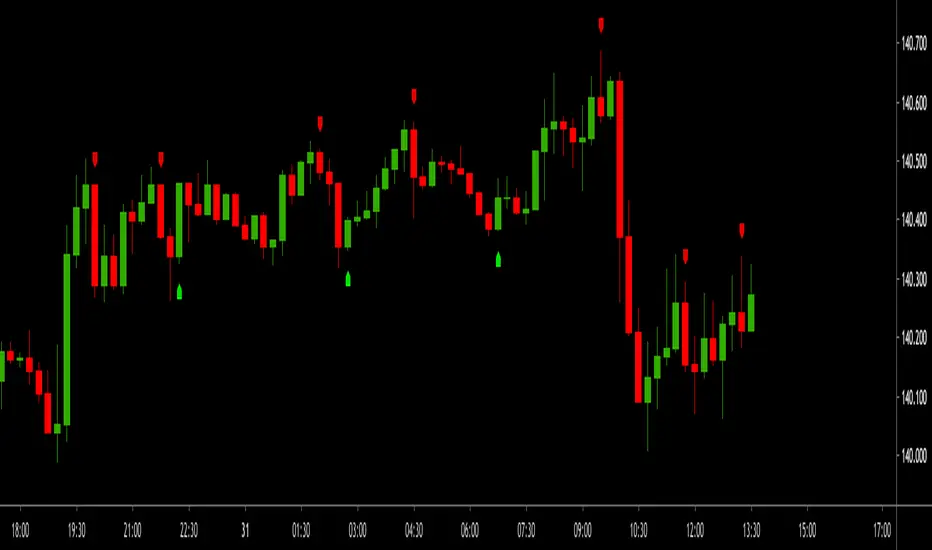
Acmillions88 Binary Prediction 1For those who followed me, I have good news for you.
I went into binary options.
The key to binary options is to predict the next candle,
here's a script with high success rate.
Tested on EURUSD 1min.
When the green or red line didn't touch any candle body for a period of time,
then it touches a candle's body.
If the candle is green, a red one is coming soon,
most likely is the next one.
If the candle is red, a green one is coming soon,
most likely is the next one.
Important to note that when the line crosses the body of the candle, it has to be slanted,
meaning the line has to be going up or down.
Please don't ask me why and how it works. Its a secret.
Cheers.
