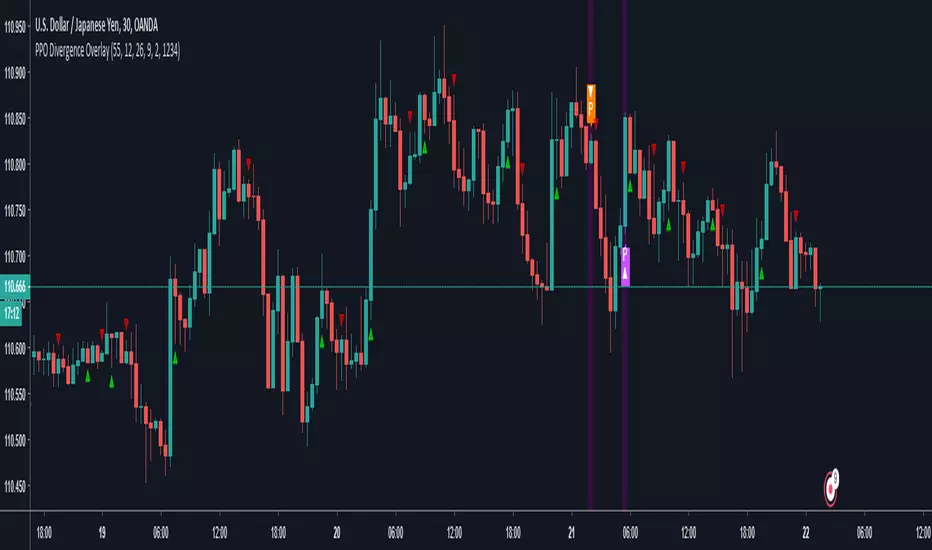
Divergence With OverlaysThis is a nice script
Modification request by @emanuel.
Great thanks to
This script creates mixed alerts and removes any repaints by using v3
signal manipulation is also edited from the offset
Binaryoption
Trend Hunter [forex and binary]This is an amazing script for scalp trading.
It is basically self-explanatory. Just search, add to chart and start using as per the arrows.
Feel free to comment and ask anything
You can also use the binary options methods
DO NOT
dont enable forex together with direction. Only one of them should be turned on
Best Practice
enable one option at a time on the list
forex
binary
direction

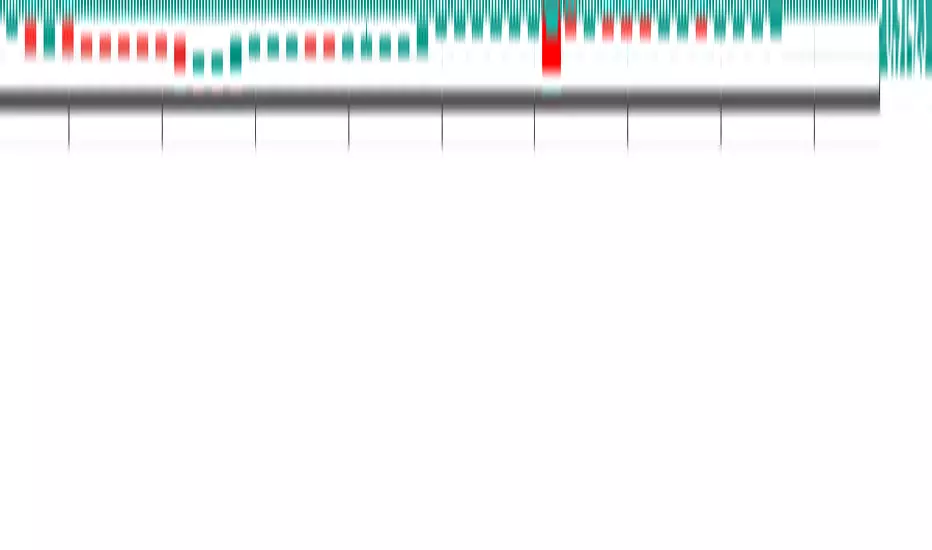
Binary Options TrendOnly for trading binary options.
Use 5 sec candles in your options trading software (IQ Option, Expert Option etc.)
Win more than 60% of trades.
Recommended Timeframe : 1 min
Long : When the color is darker green
Short : When the color is darker red
Reviews and Suggestions are welcome.
Feedback Appreciated.
Thank you.

ANB AI Alert (my ANN)Hi guy
This is a high level trend predicting study. It is modified from the strategy by sirlof.
Feel free to use it as you like.
::USAGE only on 15 minutes
1. add the study in your chart
2. create an alert on the right
3. select ANB AI Alert (my ANN)(0,1D)
4. select the option you wish
5. select once per bar close alert
6. you can select email alert which i usually like
7. once the trade is alerted, execute your trade
TP: DYNAMIC (read more)
SL: null
Setting TP and SL: this is in consideration with the daily volatility and sessions
USDCAD TP 400 points, no stop loss.
To maximize profit, use trailing stops. most trades are 500 to 1800 points

Cryptotrader ExstremeIndicator which helps with the longterm trading of cryptocurreny, to find entry points.
Its also great for binary with an ideal bank management stragety.
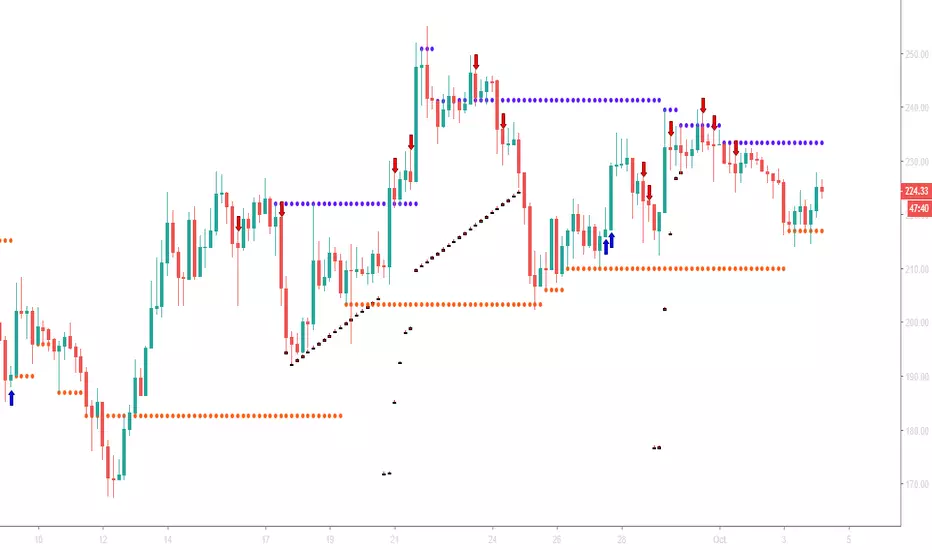
TradeMiner S9This is the first TradingView indicator EVER to include dynamic support and resistance lines from upper or lower diagonal highs and lows in real-time.
Note: This indicator has been built using Pinescript V2
Like and Share for access and more awesome indicators!
A blue arrow appears only in a red bar and under these conditions:
Closing Score Trigger (CS < 50)
On Balance Volume, Accumulation/Distribution, and Chaikin Money Flow Combination (OBV/AD /CMF > 0)
Chaikin Money Flow (CMF <-0.05)
A blue horizontal line will be drawn when CMF > 0.05 indicates a sale of the position.
A red arrow appears only in a green bar and under these conditions:
Closing Score Trigger (CS > 50)
On Balance Volume, Accumulation/Distribution, and Chaikin Money Flow Combination (OBV/AD/CMF < 0)
Chaikin Money Flow (CMF > 0.05)
A red horizontal line will be drawn when CMF <-0.05 indicates a sale of the position.
A new condition called " leaniency " has been added that allows all these conditions to be fulfilled within multiple bars so that the occurrence occurs more frequently. This will result in more signals appearing. Setting leniency to " 1 " means that all four conditions must occur in a single bar, while " 5 " means that all four conditions must occur within 5 bars.
Find lifetime access to the indicator here: www.kenzing.com
BTC
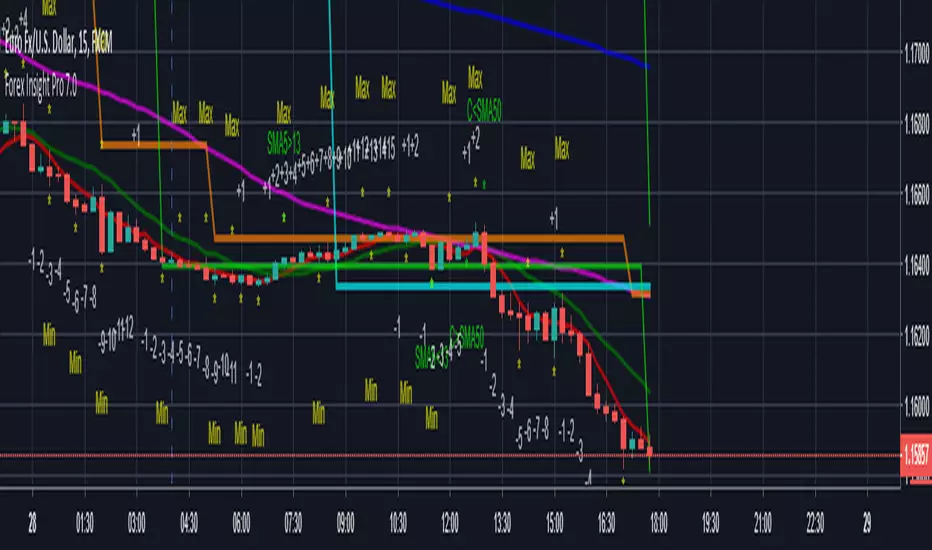
Forex Insight Pro 7.0Forex Insight Pro 7.0 for TradingView gives you abilities to see the stories hiding in the graphs of the markets. It marks and reminds you about important parameters that are happening on the graph so that you will not forget to consider them before placing orders. These parameters include:
Automatic CC(X) counting that compare the close of the right price bar to that of left price bar in a group of X consecutive bars such as CC(5,9) of a group of 5 bars will compare the close price of the right bar to the left bar (ignoring 3 bars in the middle). If the right bar closed higher, the count positive number would be printed above the bar. If the left bar closed higher, the count negative number would be printed below the bar. Nine consecutive series of up counts will define the lowest price as CC(5,9) support line and nine consecutive series of down counts will define the highest price as CC(5,9) resistance line. The count numbers and support / resistance lines are automatically printed on the graph if enabled.
Show a set of simple moving average lines such as SMA5, SMA13, SMA50, SMA200, SMA800, if enabled. The color of SMA50 line (which is the same as the the middle line of Bollinger band (50,2) can be set to change based on increasing/decreasing values of itself, or of the MACD(12,26,9).
Show Bollinger bands (50,2), if enabled.
Show the high and low levels of the previous day, if enabled.
Show the important time areas for Forex trading during Asian, London, and New York sessions, if enabled.
Automatic printing of the events happening in the graph to remind the readers of parameters under considerations (if enabled) including:
- Print "SMA5>13" and "SMA5<13" for SMA5 crossed above and below SMA13.
- Print "SMA50>200" and SMA50<200" for SMA50 crossed above and below SMA200.
- Print "Max" and "Min" for local maximum and local minimum bars.
- Print "C75" and "C25" for the bars that closed above 75% and closed below 25% of its ranges.
- Print "C>SMA50" and "C30" and "RSI<70" for RSI(14) that crossed above 30 % and below 70 %.
- Print "MACD>0" and "MACD<0" for MACD(12,26,9) that crossed above and below zero.
- Print "MACD>Sig" and "MACD
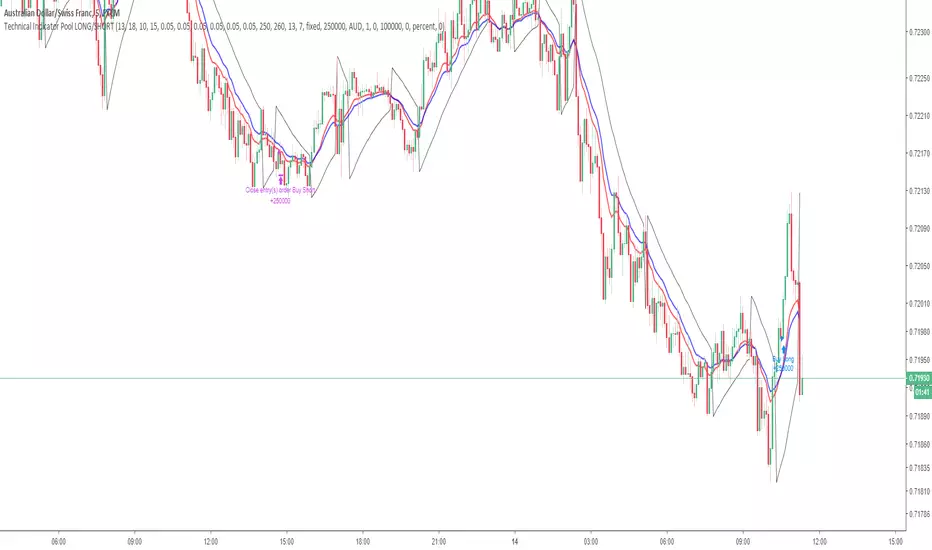
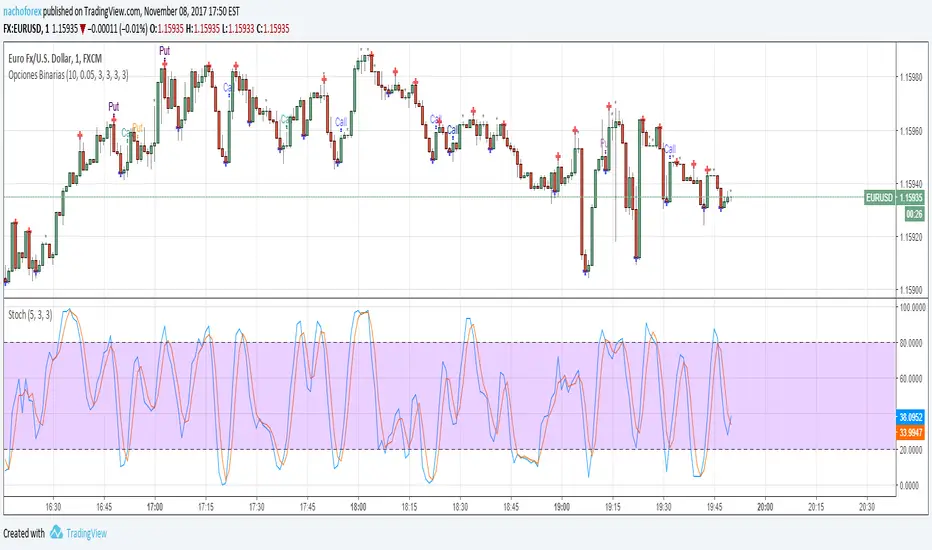
Technical Indicator PoolThis is for Bundle holders who want to use the Technical Indicator Pool for scalping binary options.
Understanding the Technical Indicator Pool
The Technical Indicator Pool is a strategy that operates on the premise that when many technical indicators project the same sentiment, they are concurrently more precise. The technical indicator pool contains five indicators
1. Small MACD Moving Average (SFMA) (10,15)
2. Large MACD Moving Average (LFMA) (13,18)
3. Parabolic Stop and Reverse (PSAR) (0.05, 0.05, 0.05)
4. Relative Strength Index (RSI) (14, 70, 30)
5. H/L Pivot (13)
When all five indicators project the same sentiment within a defined period (known as BarPeriod), an order is placed in the direction of sentiment.
Note:
Due to the nature of the indicator pool, such as the moving averages within the MACD and RSI as well as the High/Low Pivot, false positives may occur before the bar has closed within the time stamp.
This point of reference is to be used in combination with an arsenal of trading tools and should not be used as direct investment advice.
Option strategies should always include stop losses.
This strategy operates using a lot size of 2.5.
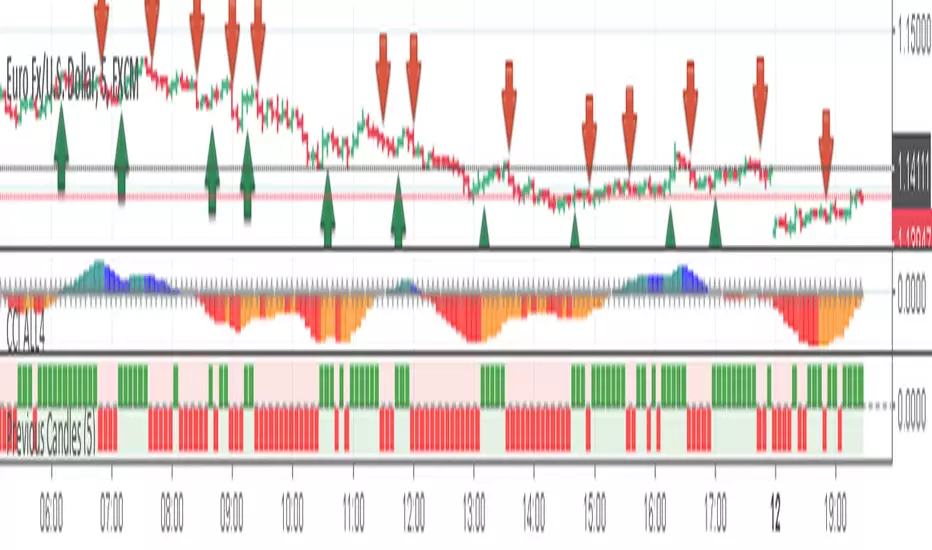
Previous CandlesThis is an indicator based on the average of the maximum and minimum of the past candle, and there is another strategy that makes the filter, it is very good for binary options, if you combine our indicator CCI and All4 it gets even better!
Currency: Any pair.
TimeFrame: 5m
Execute order: You can enter 1 minute or 5 minutes.
In the graph below the ICC, you can see the green and red squares, it works as follows.
Before giving any input you have to enter the change of a color.
Example: It was red and now it's green, so you could give the entry, but you must have at least 3 squares of red before, if only 1 squared has appeared, the hit percentage will be low!
The CCI indicator is for confirmation.
Any doubt I am available!
Note: This indicator does not make magic nor is it a holy grall, it is only an indicator to aid in binary operations!
OPTION COMBOA Combination of various Oscillators ie RSI, Stochastics, CCI and then Murrey filter to give more accurate signals to trade.
It is coded for Alerts, so you can do the manual Alerts setup.

Abramov_V4First of all for binary options
Multi currency
Timeframe 5 minutes +
Volatility - not lower than average
This indicator includes:
1. Bollinger waves of 3 levels - on / off
2. Moving averages 2 pieces - on / off
3. Price channel - on / off
4. Day and resistance level support - on / off
5. Main support and resistance level for 120 minutes - on / off
6. Areas of RSI overbought / oversold in the form of arrows.
Any of the indicators is configurable.
The optimal settings are set by default.
This indicator is suitable for several strategies.
Access on request.
When working with this indicator, it is necessary to avoid news and sudden jumps in the market

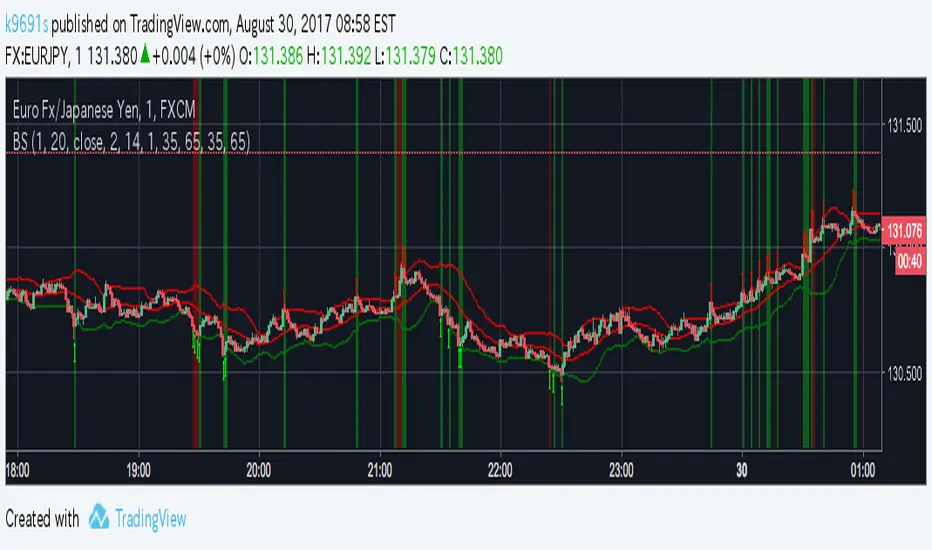
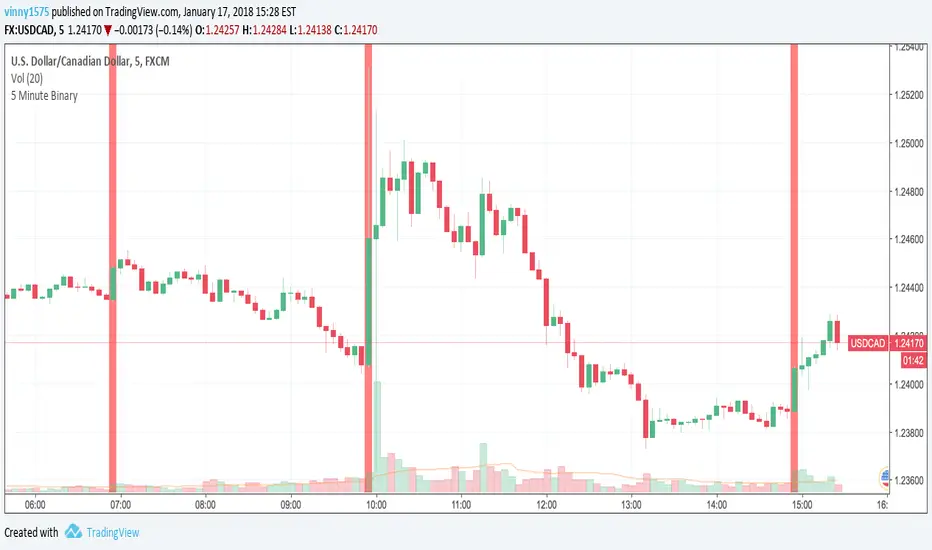
PROFIT_CANDLE_BillionWay_ExclusiveBinaryOptionAndForexHere is the spectacular working Binary option script with Alert condition enabled code.
Tested this with 1min and 5min and proven to be 80% ITM 8 win to loss out of 10 trades.One can use this for Binary option trading for some good win rates.
This is the upgraded version of Read through this before using this updated version.
How it works and How to use this :
1.This can be applied for any time frame ,Best works in 30min ,1hr,1D,W,M -- For BinaryOption 1minchart ,5minchart with 1-2min expiry,5-10min expiry works best.
2.Only Look for the Blue handle to appear in the chart once you see the candle as soon as Enter "CALL in Binary option" ,Now you can enable the Tradingview Alert after the setting so that you get alert and trade (Put option logic not included ,This is only work for Call ,But it can be used for any forex,equity ,currency market)
3.As soon as you sea the blue candle forming Enter Buy (If you see the black candle after the candle made huge high avoid entering the trade at very high level price) and expiry time should be 1-2min for 1min chart, 5 to 10min for 5min chart ,Normally 1plus times of chart frame time.
4.If it is forex or equity Cover the the trade after 2to3 candle for quick profit or keep it for 15-20 candles for good profits ,This gives some false signal as well so this might work only 80%.Be cautious risking your money .
Test it and provide your feedback in the comment section ,Invited user will be given access,Do not comment grant access in comment section ,Send me pvt message in Tradingview.
How to enable the alert
1.First choose the timeframe in which u want to get the alert for example EURJPY 1min chart
2.Go to Tools(Right top corner in Tradingview) Click on the Alerts and then click on the SetAlerts or press Alt+A
3.Now in the "Condition" Choose PROFIT_CANDLE_BillionWay_ExclusiveBinaryOptionAndForex
4.Choose the frequency one per bar and choose other option if you wish and then click on create
--> If you are pro member you can set 10 alerts for various time frame or for 10 differrent currency pair which will alert on live time to enter call
if you atleast get 3call in an hour from each script in 10script ,30calls you would trade in an hour and if the win rate is 70% you would go with good money every time.
Please post your valuable feedback so that it will help others too. Happy Trading Happy Earning.
Published on 12-08-2018 12PM
Here is the spectacular working Binary option script with Alert condition enabled code.
Tested this with 1min and 5min and proven to be 80% ITM 8 win to loss out of 10 trades.One can use this for Binary option trading for some good win rates.
This is the upgraded version of Read through this before using this updated version.
How it works and How to use this :
1.This can be applied for any time frame ,Best works in 30min ,1hr,1D,W,M -- For BinaryOption 1minchart ,5minchart with 1-2min expiry,5-10min expiry works best.
2.Only Look for the Blue handle to appear in the chart once you see the candle as soon as Enter "CALL in Binary option" ,Now you can enable the Tradingview Alert after the setting so that you get alert and trade (Put option logic not included ,This is only work for Call ,But it can be used for any forex,equity ,currency market)
3.As soon as you sea the blue candle forming Enter Buy (If you see the black candle after the candle made huge high avoid entering the trade at very high level price) and expiry time should be 1-2min for 1min chart, 5 to 10min for 5min chart ,Normally 1plus times of chart frame time.
4.If it is forex or equity Cover the the trade after 2to3 candle for quick profit or keep it for 15

60seconds Binary option StretegyReliable Indicator
U mean Up
D mean Down
How i use it:-
1- I add this indicator to my 5min chart
2-I create Alert manully
3-As soon as Alert come i trade for 1min.
Best if alert comes just in start of new candle in 1min or 5min
Guys let me know your results
:)
Enjoy.

BO STRATEGY v4.0Multitimeframe channels based strategy for binary options. Non repainting signals. Entry on the next candle after a signal.

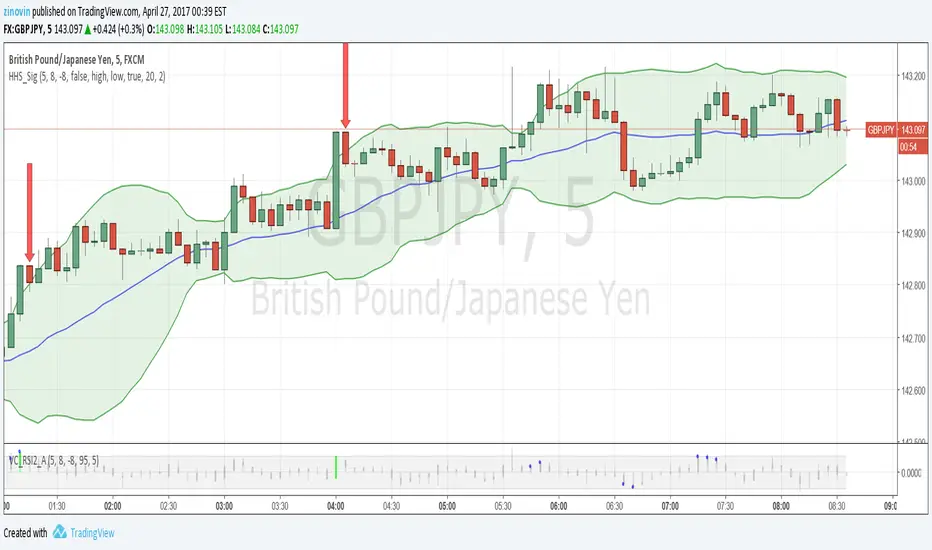
Hubba Hubba Style SignalsThe indicator shows signals for "Hubba Hubba Style" strategy (binary options). It is the best to use one with "Value Chart and RSI2 with Alert" indicator. I recommend to use TF5 and expiration time till 5 min.
Also HHS_Sig can show Bollinger Bands, Resistance and support lines based on William's fractals
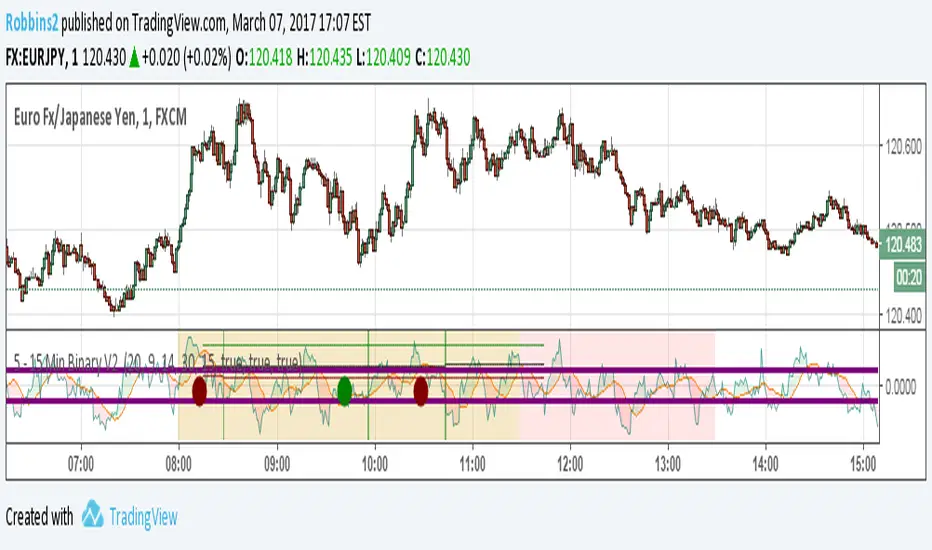
5 - 15 Min Binary V2 Hey guys
As promised back with the updated indicator without needing my blessing to use. Please post feedback so that I can perfect it.
Works great on EU/JP and USDCAD with a risk factor of 20 – 25. Use 1 time frame with 15 mins Expiry for nest results. Possible to get 90% ITM with this setup.
Updated Feature
Risk Factor: Higher the number lowers the risk but also means lower trade setups. Best between 20 – 25.
Added an additional Filter to minimize bad setups
No trading between 11.30 EST to 13.00 EST. Not worth the risk.
Displays ITM rate in Green, Red and total in Black.
Alert capable for Both, Call or Put
Please demo before you take it live. Also during normal trading hours I have not seen more than 3 consecutive loses, (unless there is a news release) so with money management you can greatly increase your total ITM rate.
If you like this indicator, feel free to donate some BTC at 18qrzku9LrQuMq9LyRYmiTbqUtC2bSAv3y
It does take considerable amount of tweaking and testing to put out something like this.
Post feedback so that everyone can benefit.
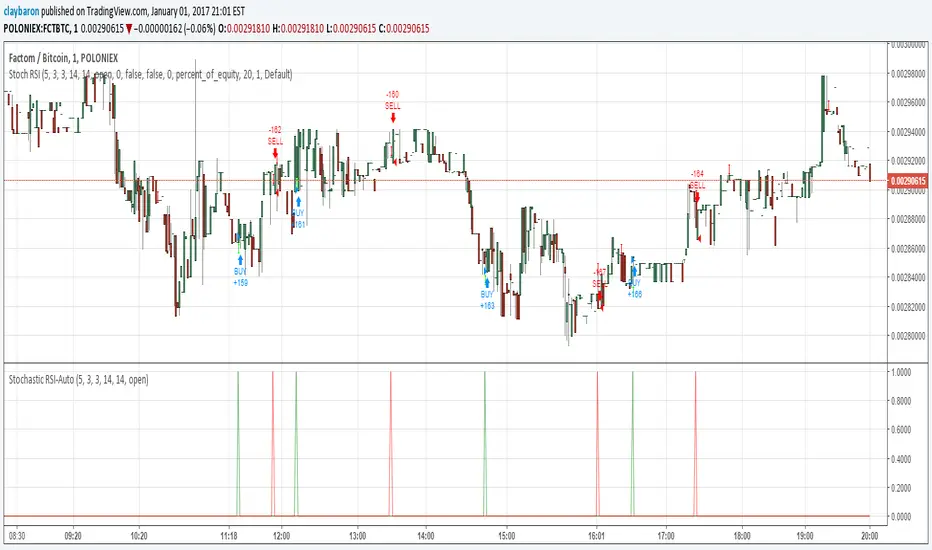
Stochastic RSI StrategyThis is an an adaption of Binary option 1 minute by Maxim Chechel to a strategy. I have had success with this on FCT/BTC on Poloniex.
VDUB BB %B REVERSAL_v4.2 revised by JustUncleLThis is an revised Open Public version of Vdub Bollinger Band %B reversal indicator. This version includes optional Divergence Finder with selectable channel width, optional Market Session time highlighting and optional Binary Option expiry markers.

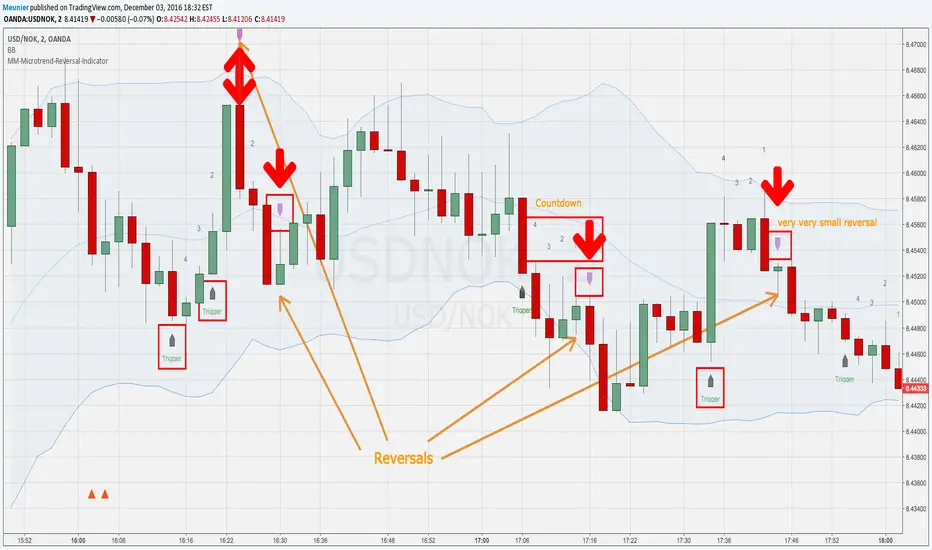
MM-Microtrend-Reversal-IndicatorThis indicator detects microtrend reversals based on crossing of the DMI+ and DMI- + signals
It indicates the trigger event on the chart as well as the reversal candle
In addition to that it shows a countdown above the bars
This is helping when multiple reversals occur
Important: when the Bollinger Bands are crossed in the previous bars it's possible that the prognosted reversal will NOT show up
Recommended timeframes are M1 and M2
Avoid trading sideway trends, the reverals are low and reversal triggers and assumed reversal candles could get chaotic

MM-Microtrend-Reversal-IndicatorThis indicator detects microtrend reversals based on crossings of the DMI+ and DMI- signals
It indicates the trigger event on the chart as well as the reversal candle
In addition to that it shows a countdown above the bars
This is helping when multiple reversals occur.
Important: when the Bollinger Bands are crossed in the previous bars it's possible that the prognosted reversal will NOT show up
Recommended timeframes are M1 and M2
Avoid trading sideway trends, the reversals are low and reversal triggers and assumed reversal candles could get chaotic sometimes