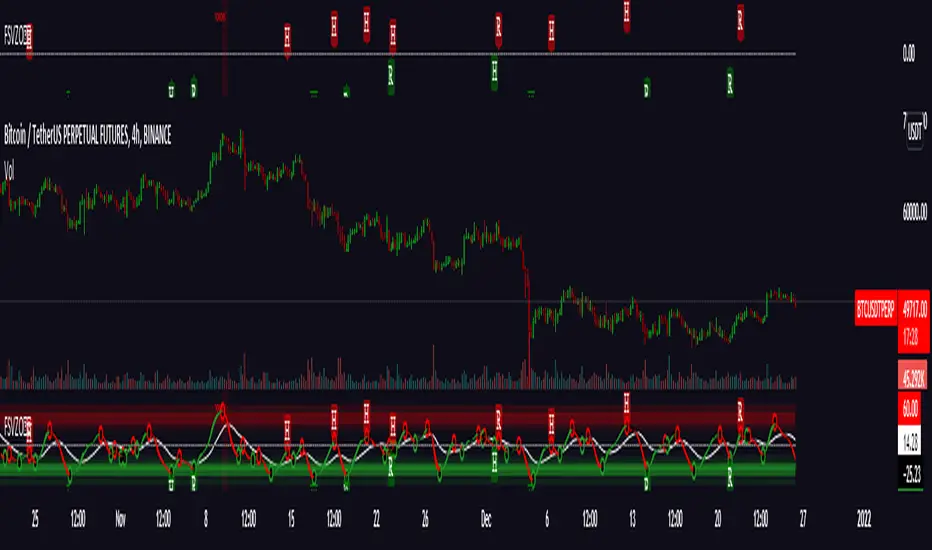
Regularized Volume Zone Oscillator FSVZORegularized VZO
Vanilla in link below
White noise and 1 confirm auto divs included
Bande di Bollinger (BB)


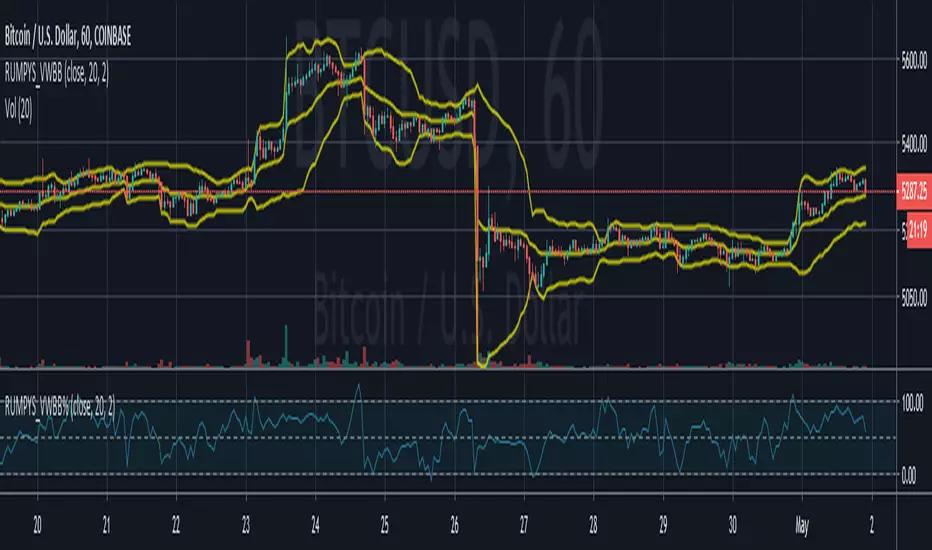
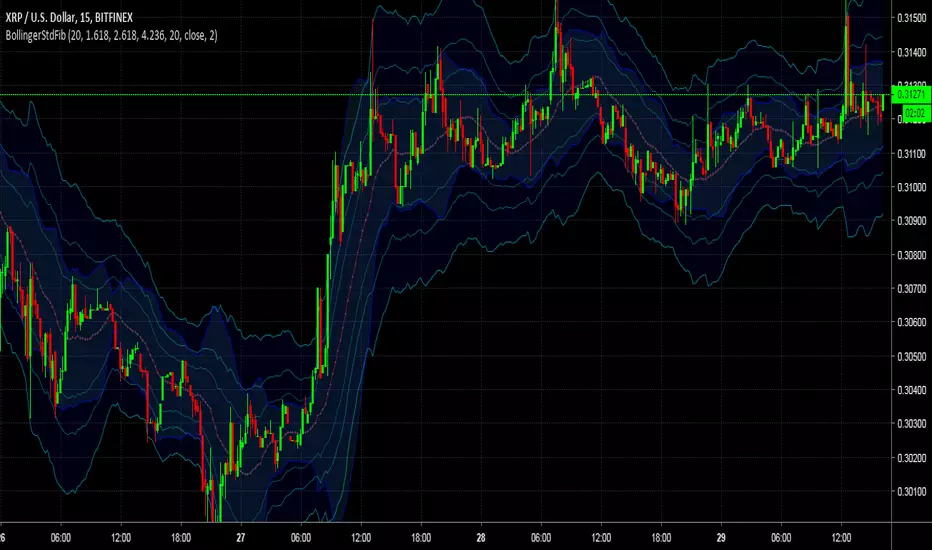
Rumpy's Volume Weighted Bollinger Bands % (B%)Bollinger Band % constructed using a volume weighted EMA as the basis and a volume weighted standard deviation to calculate the bands.
---------------------------------------
If you find it useful please consider a tip/donation :
BTC - 3BMEXEDyWJ58eXUEALYPadbn1wwWKmf6sA
Rumpy's Volume Weighted Bollinger BandsBollinger Bands constructed using a volume weighted EMA as the basis and a volume weighted standard deviation to calculate the bands.
---------------------------------------
If you find it useful please consider a tip/donation :
BTC - 3BMEXEDyWJ58eXUEALYPadbn1wwWKmf6sA


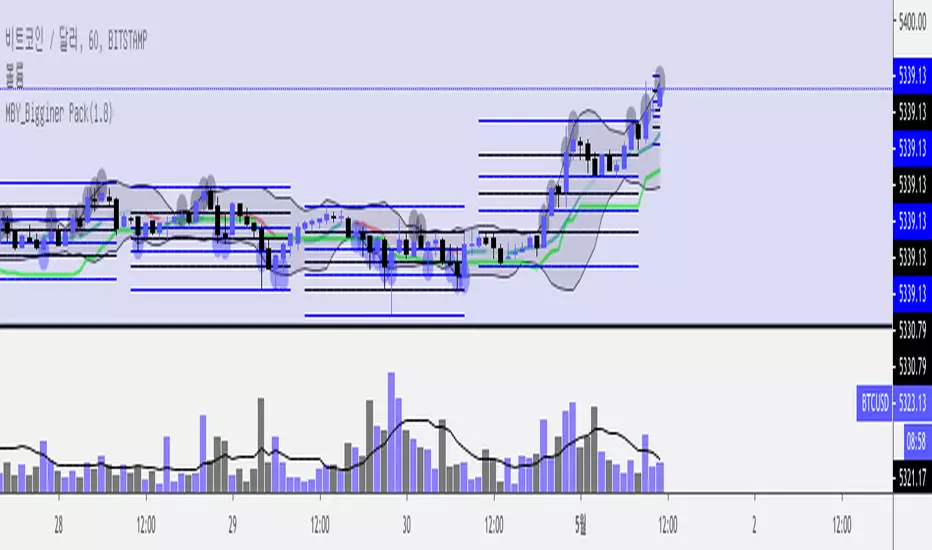
MBY_Bigginer Pack(Free)BITFINEX:BTCUSD
Hi, everyone.
This is MBY.
This indicator show you 1)Fibonacci Support&Resistance Line 2)Moving average With MACD based on MACD 3) ichimoku base line 4) Bollinger bands.
Using This indicator, no longer necessary to draw supporting lines and moving average lines.
Thanks.

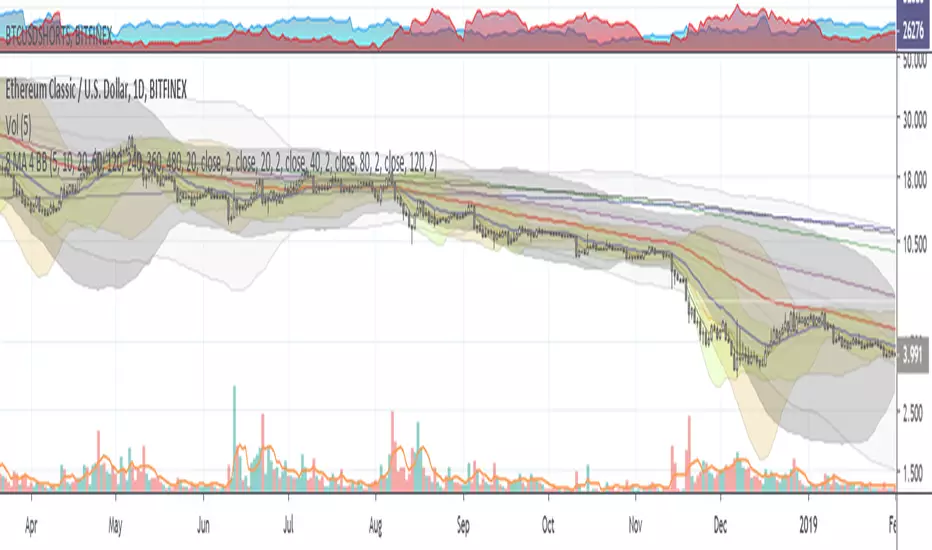
8 MA + 4 Bollinger Bands by Theo ParkThis indicator contains :
- 8 Moving Averages
- 4 Bollinger Bands
- 1 Fibonnaci
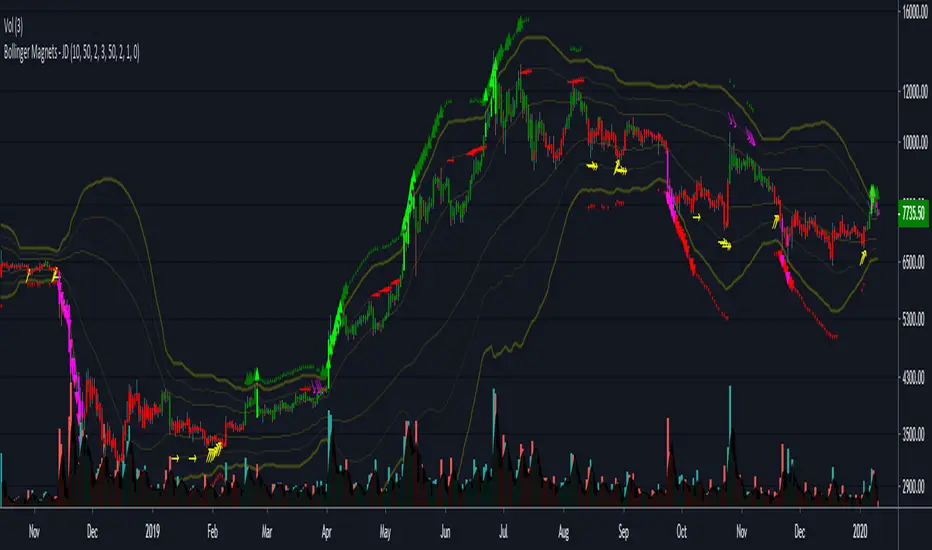
Bollinger Magnets - JDThis indicator does the same thing as my "Deviation Magnet" script, but is in 'overlay' form
and is more oriented towards the people who like to keep their eyes on the chart rather than a bottom indicator.
As tated in my "Deviation Magnet" script, contrary to the popular use where price is seen as BOUNCING AGAINST the different deviations (or upper and lower BBands),
I tend to find that price likes to STICK to those deviations once it hits them (with a high or a low wick) and "rides them" for a while.
I call this "THE MAGNET EFFECT" of the standard deviations.
The indicator highlights those "MAGNET MOVES".
For most assets I like to use 50 period deviations better than the standard 20 period because it shows the bigger trends better
but of course this can be modified to your liking!
JD.
#NotTradingAdvice
#DYOR
I build these indicators for myself and provide them open source, to use for free to use and improve upon,
as I believe the best way to learn is toghether.

Hara's Favorit Stochastic 2BBs by Theo ParkThis indicator include :
- Stochastic
- Bollinger Bands of Stochastic
- Fibonacci based Bollinger Bands of Stochastic
with fill background color options for each BB. (upper and lower)

ATS Master's IndicatorThis master indicator is a collection of multiple useful indicators, which only requires one indicator slot in TradingView.
In this collection you will find the following 15 indicators:
Bollinger Bands (three different types: Fibonacci, Standard, Improved)
Gaps Checker
Large Candles Checker
SPY Checker Lite
Volume Checker Pro
Moving Averages (up to two individual MA indicators)
Exponential Moving Averages (up to two individual EMA indicators)
Double Exponential Moving Averages (up to two individual DEMA indicators)
Tripple Exponential Moving Averages (up to two individual TEMA indicators)
So, using this master indicator you are able to use up to 15 indicators in one.
If you would like to use this master indicator drop me a line and send a request for it.

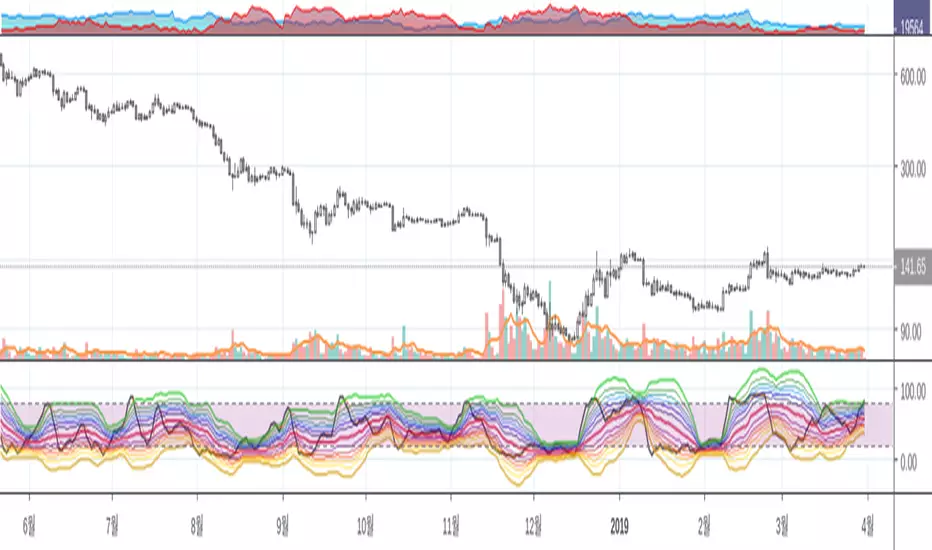
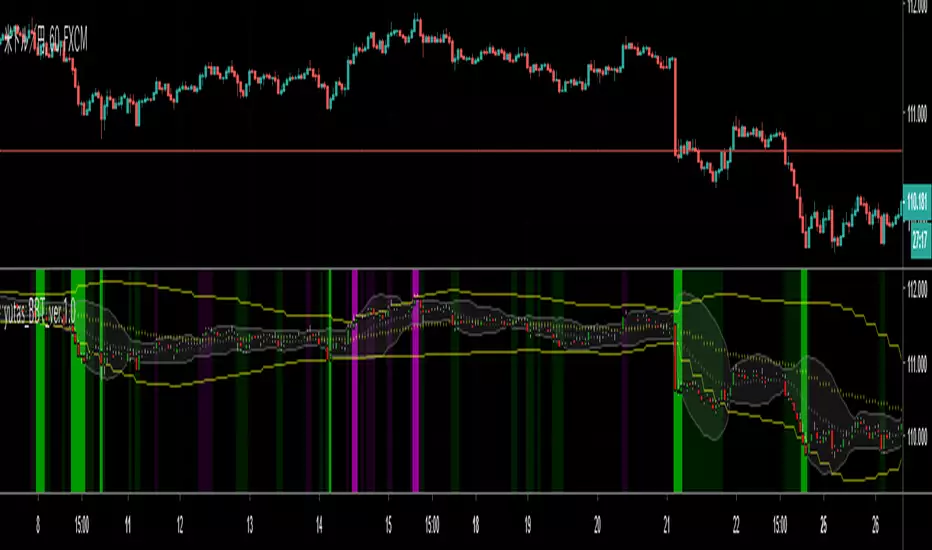
yutas_RSI_Stochastic_BBver .1.0
Produce a combined signature of RSI, Stochastic and BB.
MTF compatible.
With alert function.
-----------------------------------------------------------------
RSIとStochasticとBBの複合サインを出します。
MTF対応。
アラート機能付き。
-----------------------------------------------------------------

Stoch + Stoch BB + Stoch BB with Fibnacci sequence by Theo ParkThis indicator contains :
- 1 Stochastic
- 1 Stochastic Bollinger Bands
the source of the Bollinger Bands is the %K of the Stochastic obove
- 1 Fibonacci Bollinger Bands
Stochastic Bollinger Bands with Fibonacci sequence like
0.236, 0.382, 0.5, 0.618, 0.764, 1..
yutas_Bollinger Band Touchver.1.0
Bollinger Bands ±2(figures changeable)σ × 2(MTF)
Show / hide candlesticks.
BB touch sign display / non-display.
BB①② composite sign display / non-display.
Alert function.
-----------------------------------------------------------------
ボリンジャーバンド ±2(数値の変更可)σ × 2(マルチタイムフレーム)
ローソク足の表示・非表示。
BBタッチサイン表示・非表示。
BB①②の複合サイン表示・非表示。
アラート機能。
-----------------------------------------------------------------
Quad Bollinger Bands CCI Splash by ZekisQuad Bollinger Bands CCI Splash combine four Bollinger Bands with modified standard deviations and some other calcs and CCI indicator.
It's working very well in trending market (obviously) with a very high win/loss ratio.
It's working in any time frame.
The long threshold should be opposed to the short one (ex.: Long T. 50 / Short T. -50), but it can be 0 for both.
Greater difference between thresholds means fewer trades.
There are standard entries for Longs and Shorts and reentries marked with RE.
Also there are exits correlated with standard entries only.
Enjoy!
@Zekis

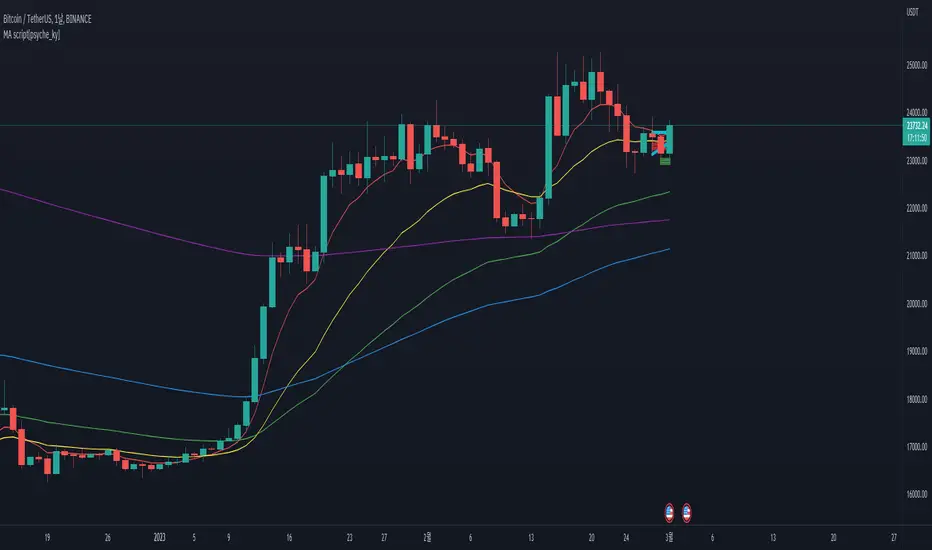
(YEK) Combo(YEK) Combo is a combination of several indicators (listed below). You can use them together or one by one. Just click settings, and choose which of them to be shown.
Here are the indicators included in this script:
- Ichimoku Cloud
- Bollinger Bands
- Moving Average 1
- Moving Average 2 (In case of detecting golden crosses or death crosses)
- Exponential Moving Average
- T3 Tillson
- MavilimW
Enjoy!


AG Ultimate Bollinger BandsWe believe we have really built the ultimate Bollinger Bands! There are so many options with these Bands:
- use an SMA or EMA for the Basis Moving Average
- displaying the Average Highs/Lows (blue lines) to create a Moving Band
- show breakouts of the Upper/Lower Bollinger Bands with arrows for simplicity (no more wondering whether it closed out or not!)
- show a standard deviation of Highs/Lows alongside the traditional Upper/Lower Bollinger Bands.
All options are togglable, for full flexibility and customisation.

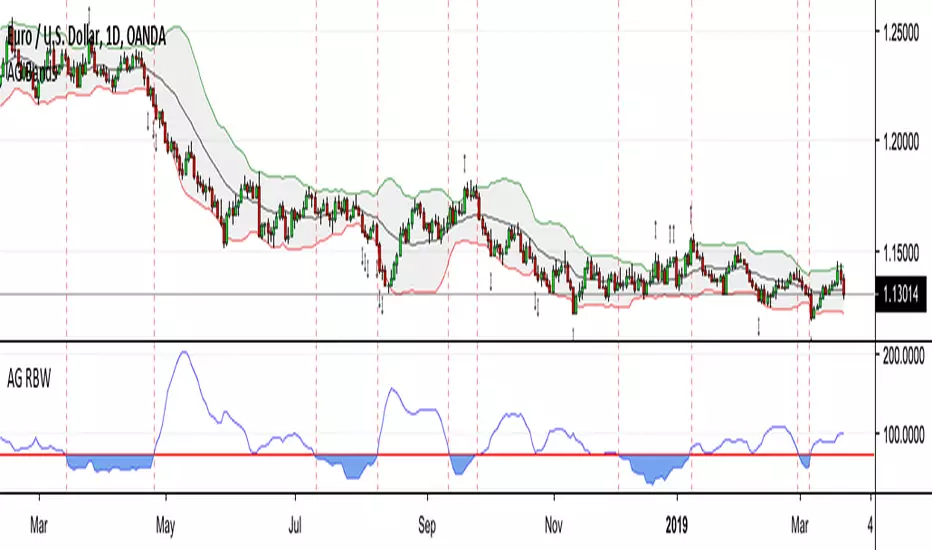
AG Relative BandWidthThis is an indicator that we've been using for a while, very useful for identifying when the market is in a low volatility state. We use the bandwidth of the Bollinger Bands as a proxy for this, but we do something different - we ask the question of "relative to what?".
Whereas typical Bollinger BandWidth indicators give values only applicable for that particular asset, the normalised nature of our Relative BandWidth indicator means that it works and be inferred the same across all assets and timeframes. A really handy tool!
"After periods of low volatility come periods of high volatility" is a well-known theory, and this indicator helps to quickly and easily identify when markets are in low volatility states. Another name for the information our indicator shows is known as the "Bollinger squeeze". Trading breakouts of this squeeze in Bands can be a profitable strategy, given one can filter the false breakouts adequately.
I have shown examples of when the indicator was showing low volatility, take note of what the price action and the width of the Bollinger Bands are doing.
Every parameter is editable, so feel free to play around with the settings. The default settings are what we have used for a long time and have worked well.